Free Statistics

of Irreproducible Research!

Author's title

Author*The author of this computation has been verified*
R Software Modulerwasp_autocorrelation.wasp
Title produced by software(Partial) Autocorrelation Function
Date of computationFri, 19 Dec 2008 12:46:26 -0700
Cite this page as followsStatistical Computations at FreeStatistics.org, Office for Research Development and Education, URL https://freestatistics.org/blog/index.php?v=date/2008/Dec/19/t1229716030yycq442nzc90d4e.htm/, Retrieved Wed, 15 May 2024 23:04:26 +0000
Statistical Computations at FreeStatistics.org, Office for Research Development and Education, URL https://freestatistics.org/blog/index.php?pk=35253, Retrieved Wed, 15 May 2024 23:04:26 +0000
QR Codes:

Original text written by user:
IsPrivate?No (this computation is public)
User-defined keywords
Estimated Impact231
Family? (F = Feedback message, R = changed R code, M = changed R Module, P = changed Parameters, D = changed Data)
-     [Standard Deviation-Mean Plot] [Paper - SMP] [2008-12-19 16:30:21] [23bfa928dab4b48567707937094f7011]
- RMP   [(Partial) Autocorrelation Function] [Paper - ACF ] [2008-12-19 19:43:42] [23bfa928dab4b48567707937094f7011]
-   PD      [(Partial) Autocorrelation Function] [Paper - ACF ] [2008-12-19 19:46:26] [63302faa1e3976bf98d1de42298c0b24] [Current]
-   P         [(Partial) Autocorrelation Function] [Paper - ACF ] [2008-12-21 19:55:13] [23bfa928dab4b48567707937094f7011]
Feedback Forum

Post a new message
Dataseries X:
90.8
96.4
90
92.1
97.2
95.1
88.5
91
90.5
75
66.3
66
68.4
70.6
83.9
90.1
90.6
87.1
90.8
94.1
99.8
96.8
87
96.3
107.1
115.2
106.1
89.5
91.3
97.6
100.7
104.6
94.7
101.8
102.5
105.3
110.3
109.8
117.3
118.8
131.3
125.9
133.1
147
145.8
164.4
149.8
137.7
151.7
156.8
180
180.4
170.4
191.6
199.5
218.2
217.5
205
194
199.3


Summary of computational transaction
Raw Inputview raw input (R code)
Raw Outputview raw output of R engine
Computing time3 seconds
R Server'Herman Ole Andreas Wold' @ 193.190.124.10:1001

\begin{tabular}{lllllllll}
\hline
Summary of computational transaction \tabularnewline
Raw Input & view raw input (R code)  \tabularnewline
Raw Output & view raw output of R engine  \tabularnewline
Computing time & 3 seconds \tabularnewline
R Server & 'Herman Ole Andreas Wold' @ 193.190.124.10:1001 \tabularnewline
\hline
\end{tabular}
%Source: https://freestatistics.org/blog/index.php?pk=35253&T=0

[TABLE]
[ROW][C]Summary of computational transaction[/C][/ROW]
[ROW][C]Raw Input[/C][C]view raw input (R code) [/C][/ROW]
[ROW][C]Raw Output[/C][C]view raw output of R engine [/C][/ROW]
[ROW][C]Computing time[/C][C]3 seconds[/C][/ROW]
[ROW][C]R Server[/C][C]'Herman Ole Andreas Wold' @ 193.190.124.10:1001[/C][/ROW]
[/TABLE]
Source: https://freestatistics.org/blog/index.php?pk=35253&T=0

Globally Unique Identifier (entire table): ba.freestatistics.org/blog/index.php?pk=35253&T=0

As an alternative you can also use a QR Code:  

The GUIDs for individual cells are displayed in the table below:

Summary of computational transaction
Raw Inputview raw input (R code)
Raw Outputview raw output of R engine
Computing time3 seconds
R Server'Herman Ole Andreas Wold' @ 193.190.124.10:1001


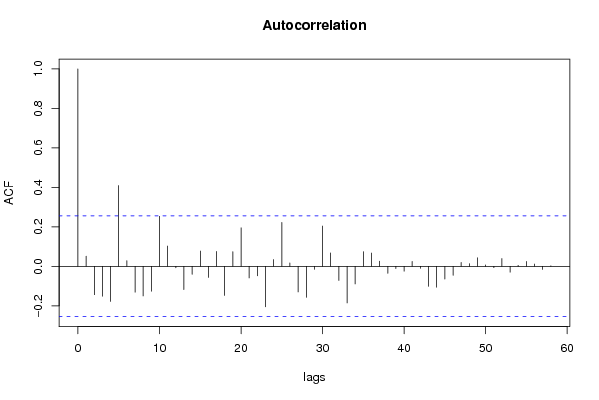
Autocorrelation Function
Time lag kACF(k)T-STATP-value
10.0510250.39190.348262
2-0.144024-1.10630.136551
3-0.151793-1.16590.124164
4-0.178163-1.36850.088173
50.4094043.14470.001302
60.0281750.21640.414705
7-0.131468-1.00980.158351
8-0.150366-1.1550.126377
9-0.126241-0.96970.168083
100.2535411.94750.02812
110.1027410.78920.216587
12-0.007892-0.06060.475933
13-0.117915-0.90570.184384
14-0.040691-0.31260.37786
150.0769010.59070.278492
16-0.056368-0.4330.333307
170.0751750.57740.282924
18-0.147822-1.13540.130391
190.0739740.56820.286025
200.1952521.49980.069505
21-0.059219-0.45490.325437
22-0.048203-0.37030.35626
23-0.205524-1.57870.059881
240.0340670.26170.397241
250.2223221.70770.046476
260.0172010.13210.44767
27-0.130041-0.99890.16097
28-0.157022-1.20610.116295
29-0.015181-0.11660.453785
300.2041991.56850.061058
310.0679590.5220.301812
32-0.071564-0.54970.292301
33-0.185592-1.42560.079632
34-0.089597-0.68820.24701
350.0740960.56910.28571
360.066980.51450.304417
370.0256260.19680.422315
38-0.03544-0.27220.393201
39-0.011737-0.09020.464235
40-0.024553-0.18860.42553
410.0244980.18820.425694
42-0.010364-0.07960.46841
43-0.10165-0.78080.219024
44-0.106008-0.81430.209384
45-0.064642-0.49650.310684
46-0.045821-0.3520.363061
470.0192920.14820.441352
480.0132970.10210.459497
490.042740.32830.371926
500.0068070.05230.47924
51-0.006922-0.05320.478889
520.0389790.29940.382842
53-0.029777-0.22870.409938
540.0052550.04040.483971
550.0244040.18750.425975
560.0110480.08490.466328
57-0.016085-0.12360.451045
580.0027260.02090.491682
59NANANA
60NANANA

\begin{tabular}{lllllllll}
\hline
Autocorrelation Function \tabularnewline
Time lag k & ACF(k) & T-STAT & P-value \tabularnewline
1 & 0.051025 & 0.3919 & 0.348262 \tabularnewline
2 & -0.144024 & -1.1063 & 0.136551 \tabularnewline
3 & -0.151793 & -1.1659 & 0.124164 \tabularnewline
4 & -0.178163 & -1.3685 & 0.088173 \tabularnewline
5 & 0.409404 & 3.1447 & 0.001302 \tabularnewline
6 & 0.028175 & 0.2164 & 0.414705 \tabularnewline
7 & -0.131468 & -1.0098 & 0.158351 \tabularnewline
8 & -0.150366 & -1.155 & 0.126377 \tabularnewline
9 & -0.126241 & -0.9697 & 0.168083 \tabularnewline
10 & 0.253541 & 1.9475 & 0.02812 \tabularnewline
11 & 0.102741 & 0.7892 & 0.216587 \tabularnewline
12 & -0.007892 & -0.0606 & 0.475933 \tabularnewline
13 & -0.117915 & -0.9057 & 0.184384 \tabularnewline
14 & -0.040691 & -0.3126 & 0.37786 \tabularnewline
15 & 0.076901 & 0.5907 & 0.278492 \tabularnewline
16 & -0.056368 & -0.433 & 0.333307 \tabularnewline
17 & 0.075175 & 0.5774 & 0.282924 \tabularnewline
18 & -0.147822 & -1.1354 & 0.130391 \tabularnewline
19 & 0.073974 & 0.5682 & 0.286025 \tabularnewline
20 & 0.195252 & 1.4998 & 0.069505 \tabularnewline
21 & -0.059219 & -0.4549 & 0.325437 \tabularnewline
22 & -0.048203 & -0.3703 & 0.35626 \tabularnewline
23 & -0.205524 & -1.5787 & 0.059881 \tabularnewline
24 & 0.034067 & 0.2617 & 0.397241 \tabularnewline
25 & 0.222322 & 1.7077 & 0.046476 \tabularnewline
26 & 0.017201 & 0.1321 & 0.44767 \tabularnewline
27 & -0.130041 & -0.9989 & 0.16097 \tabularnewline
28 & -0.157022 & -1.2061 & 0.116295 \tabularnewline
29 & -0.015181 & -0.1166 & 0.453785 \tabularnewline
30 & 0.204199 & 1.5685 & 0.061058 \tabularnewline
31 & 0.067959 & 0.522 & 0.301812 \tabularnewline
32 & -0.071564 & -0.5497 & 0.292301 \tabularnewline
33 & -0.185592 & -1.4256 & 0.079632 \tabularnewline
34 & -0.089597 & -0.6882 & 0.24701 \tabularnewline
35 & 0.074096 & 0.5691 & 0.28571 \tabularnewline
36 & 0.06698 & 0.5145 & 0.304417 \tabularnewline
37 & 0.025626 & 0.1968 & 0.422315 \tabularnewline
38 & -0.03544 & -0.2722 & 0.393201 \tabularnewline
39 & -0.011737 & -0.0902 & 0.464235 \tabularnewline
40 & -0.024553 & -0.1886 & 0.42553 \tabularnewline
41 & 0.024498 & 0.1882 & 0.425694 \tabularnewline
42 & -0.010364 & -0.0796 & 0.46841 \tabularnewline
43 & -0.10165 & -0.7808 & 0.219024 \tabularnewline
44 & -0.106008 & -0.8143 & 0.209384 \tabularnewline
45 & -0.064642 & -0.4965 & 0.310684 \tabularnewline
46 & -0.045821 & -0.352 & 0.363061 \tabularnewline
47 & 0.019292 & 0.1482 & 0.441352 \tabularnewline
48 & 0.013297 & 0.1021 & 0.459497 \tabularnewline
49 & 0.04274 & 0.3283 & 0.371926 \tabularnewline
50 & 0.006807 & 0.0523 & 0.47924 \tabularnewline
51 & -0.006922 & -0.0532 & 0.478889 \tabularnewline
52 & 0.038979 & 0.2994 & 0.382842 \tabularnewline
53 & -0.029777 & -0.2287 & 0.409938 \tabularnewline
54 & 0.005255 & 0.0404 & 0.483971 \tabularnewline
55 & 0.024404 & 0.1875 & 0.425975 \tabularnewline
56 & 0.011048 & 0.0849 & 0.466328 \tabularnewline
57 & -0.016085 & -0.1236 & 0.451045 \tabularnewline
58 & 0.002726 & 0.0209 & 0.491682 \tabularnewline
59 & NA & NA & NA \tabularnewline
60 & NA & NA & NA \tabularnewline
\hline
\end{tabular}
%Source: https://freestatistics.org/blog/index.php?pk=35253&T=1

[TABLE]
[ROW][C]Autocorrelation Function[/C][/ROW]
[ROW][C]Time lag k[/C][C]ACF(k)[/C][C]T-STAT[/C][C]P-value[/C][/ROW]
[ROW][C]1[/C][C]0.051025[/C][C]0.3919[/C][C]0.348262[/C][/ROW]
[ROW][C]2[/C][C]-0.144024[/C][C]-1.1063[/C][C]0.136551[/C][/ROW]
[ROW][C]3[/C][C]-0.151793[/C][C]-1.1659[/C][C]0.124164[/C][/ROW]
[ROW][C]4[/C][C]-0.178163[/C][C]-1.3685[/C][C]0.088173[/C][/ROW]
[ROW][C]5[/C][C]0.409404[/C][C]3.1447[/C][C]0.001302[/C][/ROW]
[ROW][C]6[/C][C]0.028175[/C][C]0.2164[/C][C]0.414705[/C][/ROW]
[ROW][C]7[/C][C]-0.131468[/C][C]-1.0098[/C][C]0.158351[/C][/ROW]
[ROW][C]8[/C][C]-0.150366[/C][C]-1.155[/C][C]0.126377[/C][/ROW]
[ROW][C]9[/C][C]-0.126241[/C][C]-0.9697[/C][C]0.168083[/C][/ROW]
[ROW][C]10[/C][C]0.253541[/C][C]1.9475[/C][C]0.02812[/C][/ROW]
[ROW][C]11[/C][C]0.102741[/C][C]0.7892[/C][C]0.216587[/C][/ROW]
[ROW][C]12[/C][C]-0.007892[/C][C]-0.0606[/C][C]0.475933[/C][/ROW]
[ROW][C]13[/C][C]-0.117915[/C][C]-0.9057[/C][C]0.184384[/C][/ROW]
[ROW][C]14[/C][C]-0.040691[/C][C]-0.3126[/C][C]0.37786[/C][/ROW]
[ROW][C]15[/C][C]0.076901[/C][C]0.5907[/C][C]0.278492[/C][/ROW]
[ROW][C]16[/C][C]-0.056368[/C][C]-0.433[/C][C]0.333307[/C][/ROW]
[ROW][C]17[/C][C]0.075175[/C][C]0.5774[/C][C]0.282924[/C][/ROW]
[ROW][C]18[/C][C]-0.147822[/C][C]-1.1354[/C][C]0.130391[/C][/ROW]
[ROW][C]19[/C][C]0.073974[/C][C]0.5682[/C][C]0.286025[/C][/ROW]
[ROW][C]20[/C][C]0.195252[/C][C]1.4998[/C][C]0.069505[/C][/ROW]
[ROW][C]21[/C][C]-0.059219[/C][C]-0.4549[/C][C]0.325437[/C][/ROW]
[ROW][C]22[/C][C]-0.048203[/C][C]-0.3703[/C][C]0.35626[/C][/ROW]
[ROW][C]23[/C][C]-0.205524[/C][C]-1.5787[/C][C]0.059881[/C][/ROW]
[ROW][C]24[/C][C]0.034067[/C][C]0.2617[/C][C]0.397241[/C][/ROW]
[ROW][C]25[/C][C]0.222322[/C][C]1.7077[/C][C]0.046476[/C][/ROW]
[ROW][C]26[/C][C]0.017201[/C][C]0.1321[/C][C]0.44767[/C][/ROW]
[ROW][C]27[/C][C]-0.130041[/C][C]-0.9989[/C][C]0.16097[/C][/ROW]
[ROW][C]28[/C][C]-0.157022[/C][C]-1.2061[/C][C]0.116295[/C][/ROW]
[ROW][C]29[/C][C]-0.015181[/C][C]-0.1166[/C][C]0.453785[/C][/ROW]
[ROW][C]30[/C][C]0.204199[/C][C]1.5685[/C][C]0.061058[/C][/ROW]
[ROW][C]31[/C][C]0.067959[/C][C]0.522[/C][C]0.301812[/C][/ROW]
[ROW][C]32[/C][C]-0.071564[/C][C]-0.5497[/C][C]0.292301[/C][/ROW]
[ROW][C]33[/C][C]-0.185592[/C][C]-1.4256[/C][C]0.079632[/C][/ROW]
[ROW][C]34[/C][C]-0.089597[/C][C]-0.6882[/C][C]0.24701[/C][/ROW]
[ROW][C]35[/C][C]0.074096[/C][C]0.5691[/C][C]0.28571[/C][/ROW]
[ROW][C]36[/C][C]0.06698[/C][C]0.5145[/C][C]0.304417[/C][/ROW]
[ROW][C]37[/C][C]0.025626[/C][C]0.1968[/C][C]0.422315[/C][/ROW]
[ROW][C]38[/C][C]-0.03544[/C][C]-0.2722[/C][C]0.393201[/C][/ROW]
[ROW][C]39[/C][C]-0.011737[/C][C]-0.0902[/C][C]0.464235[/C][/ROW]
[ROW][C]40[/C][C]-0.024553[/C][C]-0.1886[/C][C]0.42553[/C][/ROW]
[ROW][C]41[/C][C]0.024498[/C][C]0.1882[/C][C]0.425694[/C][/ROW]
[ROW][C]42[/C][C]-0.010364[/C][C]-0.0796[/C][C]0.46841[/C][/ROW]
[ROW][C]43[/C][C]-0.10165[/C][C]-0.7808[/C][C]0.219024[/C][/ROW]
[ROW][C]44[/C][C]-0.106008[/C][C]-0.8143[/C][C]0.209384[/C][/ROW]
[ROW][C]45[/C][C]-0.064642[/C][C]-0.4965[/C][C]0.310684[/C][/ROW]
[ROW][C]46[/C][C]-0.045821[/C][C]-0.352[/C][C]0.363061[/C][/ROW]
[ROW][C]47[/C][C]0.019292[/C][C]0.1482[/C][C]0.441352[/C][/ROW]
[ROW][C]48[/C][C]0.013297[/C][C]0.1021[/C][C]0.459497[/C][/ROW]
[ROW][C]49[/C][C]0.04274[/C][C]0.3283[/C][C]0.371926[/C][/ROW]
[ROW][C]50[/C][C]0.006807[/C][C]0.0523[/C][C]0.47924[/C][/ROW]
[ROW][C]51[/C][C]-0.006922[/C][C]-0.0532[/C][C]0.478889[/C][/ROW]
[ROW][C]52[/C][C]0.038979[/C][C]0.2994[/C][C]0.382842[/C][/ROW]
[ROW][C]53[/C][C]-0.029777[/C][C]-0.2287[/C][C]0.409938[/C][/ROW]
[ROW][C]54[/C][C]0.005255[/C][C]0.0404[/C][C]0.483971[/C][/ROW]
[ROW][C]55[/C][C]0.024404[/C][C]0.1875[/C][C]0.425975[/C][/ROW]
[ROW][C]56[/C][C]0.011048[/C][C]0.0849[/C][C]0.466328[/C][/ROW]
[ROW][C]57[/C][C]-0.016085[/C][C]-0.1236[/C][C]0.451045[/C][/ROW]
[ROW][C]58[/C][C]0.002726[/C][C]0.0209[/C][C]0.491682[/C][/ROW]
[ROW][C]59[/C][C]NA[/C][C]NA[/C][C]NA[/C][/ROW]
[ROW][C]60[/C][C]NA[/C][C]NA[/C][C]NA[/C][/ROW]
[/TABLE]
Source: https://freestatistics.org/blog/index.php?pk=35253&T=1

Globally Unique Identifier (entire table): ba.freestatistics.org/blog/index.php?pk=35253&T=1

As an alternative you can also use a QR Code:  

The GUIDs for individual cells are displayed in the table below:

Autocorrelation Function
Time lag kACF(k)T-STATP-value
10.0510250.39190.348262
2-0.144024-1.10630.136551
3-0.151793-1.16590.124164
4-0.178163-1.36850.088173
50.4094043.14470.001302
60.0281750.21640.414705
7-0.131468-1.00980.158351
8-0.150366-1.1550.126377
9-0.126241-0.96970.168083
100.2535411.94750.02812
110.1027410.78920.216587
12-0.007892-0.06060.475933
13-0.117915-0.90570.184384
14-0.040691-0.31260.37786
150.0769010.59070.278492
16-0.056368-0.4330.333307
170.0751750.57740.282924
18-0.147822-1.13540.130391
190.0739740.56820.286025
200.1952521.49980.069505
21-0.059219-0.45490.325437
22-0.048203-0.37030.35626
23-0.205524-1.57870.059881
240.0340670.26170.397241
250.2223221.70770.046476
260.0172010.13210.44767
27-0.130041-0.99890.16097
28-0.157022-1.20610.116295
29-0.015181-0.11660.453785
300.2041991.56850.061058
310.0679590.5220.301812
32-0.071564-0.54970.292301
33-0.185592-1.42560.079632
34-0.089597-0.68820.24701
350.0740960.56910.28571
360.066980.51450.304417
370.0256260.19680.422315
38-0.03544-0.27220.393201
39-0.011737-0.09020.464235
40-0.024553-0.18860.42553
410.0244980.18820.425694
42-0.010364-0.07960.46841
43-0.10165-0.78080.219024
44-0.106008-0.81430.209384
45-0.064642-0.49650.310684
46-0.045821-0.3520.363061
470.0192920.14820.441352
480.0132970.10210.459497
490.042740.32830.371926
500.0068070.05230.47924
51-0.006922-0.05320.478889
520.0389790.29940.382842
53-0.029777-0.22870.409938
540.0052550.04040.483971
550.0244040.18750.425975
560.0110480.08490.466328
57-0.016085-0.12360.451045
580.0027260.02090.491682
59NANANA
60NANANA


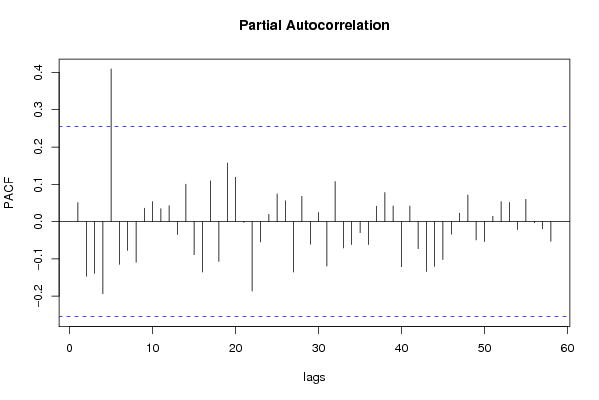
Partial Autocorrelation Function
Time lag kPACF(k)T-STATP-value
10.0510250.39190.348262
2-0.14701-1.12920.131691
3-0.139226-1.06940.144619
4-0.193621-1.48720.071139
50.4094363.14490.001301
6-0.114633-0.88050.191077
7-0.077594-0.5960.276725
8-0.109252-0.83920.202378
90.0358140.27510.392102
100.0537790.41310.340522
110.0344270.26440.39618
120.0424760.32630.372688
13-0.035023-0.2690.394428
140.1001780.76950.222338
15-0.089067-0.68410.248283
16-0.135638-1.04190.150865
170.10940.84030.202061
18-0.107067-0.82240.207081
190.1569651.20570.116378
200.1189750.91390.182255
21-0.00236-0.01810.4928
22-0.186635-1.43360.078487
23-0.054868-0.42140.33748
240.0194610.14950.440841
250.0741540.56960.285561
260.0556580.42750.335281
27-0.135589-1.04150.150951
280.067670.51980.30258
29-0.060857-0.46740.32095
300.0245710.18870.425474
31-0.119446-0.91750.181313
320.1072890.82410.2066
33-0.070844-0.54420.29419
34-0.061803-0.47470.318371
35-0.029953-0.23010.409415
36-0.06185-0.47510.318243
370.0410740.31550.376751
380.0778780.59820.276
390.0419880.32250.3741
40-0.121172-0.93070.17789
410.0417320.32060.374842
42-0.072815-0.55930.289036
43-0.133706-1.0270.154303
44-0.120432-0.92510.179352
45-0.101888-0.78260.218491
46-0.033841-0.25990.397908
470.0225710.17340.431476
480.0711560.54660.293371
49-0.049219-0.37810.353373
50-0.053821-0.41340.340403
510.0139640.10730.457474
520.0535720.41150.341101
530.0511490.39290.34791
54-0.021644-0.16630.434264
550.0597480.45890.323984
56-0.00311-0.02390.490513
57-0.019329-0.14850.441239
58-0.052922-0.40650.342923
59NANANA
60NANANA

\begin{tabular}{lllllllll}
\hline
Partial Autocorrelation Function \tabularnewline
Time lag k & PACF(k) & T-STAT & P-value \tabularnewline
1 & 0.051025 & 0.3919 & 0.348262 \tabularnewline
2 & -0.14701 & -1.1292 & 0.131691 \tabularnewline
3 & -0.139226 & -1.0694 & 0.144619 \tabularnewline
4 & -0.193621 & -1.4872 & 0.071139 \tabularnewline
5 & 0.409436 & 3.1449 & 0.001301 \tabularnewline
6 & -0.114633 & -0.8805 & 0.191077 \tabularnewline
7 & -0.077594 & -0.596 & 0.276725 \tabularnewline
8 & -0.109252 & -0.8392 & 0.202378 \tabularnewline
9 & 0.035814 & 0.2751 & 0.392102 \tabularnewline
10 & 0.053779 & 0.4131 & 0.340522 \tabularnewline
11 & 0.034427 & 0.2644 & 0.39618 \tabularnewline
12 & 0.042476 & 0.3263 & 0.372688 \tabularnewline
13 & -0.035023 & -0.269 & 0.394428 \tabularnewline
14 & 0.100178 & 0.7695 & 0.222338 \tabularnewline
15 & -0.089067 & -0.6841 & 0.248283 \tabularnewline
16 & -0.135638 & -1.0419 & 0.150865 \tabularnewline
17 & 0.1094 & 0.8403 & 0.202061 \tabularnewline
18 & -0.107067 & -0.8224 & 0.207081 \tabularnewline
19 & 0.156965 & 1.2057 & 0.116378 \tabularnewline
20 & 0.118975 & 0.9139 & 0.182255 \tabularnewline
21 & -0.00236 & -0.0181 & 0.4928 \tabularnewline
22 & -0.186635 & -1.4336 & 0.078487 \tabularnewline
23 & -0.054868 & -0.4214 & 0.33748 \tabularnewline
24 & 0.019461 & 0.1495 & 0.440841 \tabularnewline
25 & 0.074154 & 0.5696 & 0.285561 \tabularnewline
26 & 0.055658 & 0.4275 & 0.335281 \tabularnewline
27 & -0.135589 & -1.0415 & 0.150951 \tabularnewline
28 & 0.06767 & 0.5198 & 0.30258 \tabularnewline
29 & -0.060857 & -0.4674 & 0.32095 \tabularnewline
30 & 0.024571 & 0.1887 & 0.425474 \tabularnewline
31 & -0.119446 & -0.9175 & 0.181313 \tabularnewline
32 & 0.107289 & 0.8241 & 0.2066 \tabularnewline
33 & -0.070844 & -0.5442 & 0.29419 \tabularnewline
34 & -0.061803 & -0.4747 & 0.318371 \tabularnewline
35 & -0.029953 & -0.2301 & 0.409415 \tabularnewline
36 & -0.06185 & -0.4751 & 0.318243 \tabularnewline
37 & 0.041074 & 0.3155 & 0.376751 \tabularnewline
38 & 0.077878 & 0.5982 & 0.276 \tabularnewline
39 & 0.041988 & 0.3225 & 0.3741 \tabularnewline
40 & -0.121172 & -0.9307 & 0.17789 \tabularnewline
41 & 0.041732 & 0.3206 & 0.374842 \tabularnewline
42 & -0.072815 & -0.5593 & 0.289036 \tabularnewline
43 & -0.133706 & -1.027 & 0.154303 \tabularnewline
44 & -0.120432 & -0.9251 & 0.179352 \tabularnewline
45 & -0.101888 & -0.7826 & 0.218491 \tabularnewline
46 & -0.033841 & -0.2599 & 0.397908 \tabularnewline
47 & 0.022571 & 0.1734 & 0.431476 \tabularnewline
48 & 0.071156 & 0.5466 & 0.293371 \tabularnewline
49 & -0.049219 & -0.3781 & 0.353373 \tabularnewline
50 & -0.053821 & -0.4134 & 0.340403 \tabularnewline
51 & 0.013964 & 0.1073 & 0.457474 \tabularnewline
52 & 0.053572 & 0.4115 & 0.341101 \tabularnewline
53 & 0.051149 & 0.3929 & 0.34791 \tabularnewline
54 & -0.021644 & -0.1663 & 0.434264 \tabularnewline
55 & 0.059748 & 0.4589 & 0.323984 \tabularnewline
56 & -0.00311 & -0.0239 & 0.490513 \tabularnewline
57 & -0.019329 & -0.1485 & 0.441239 \tabularnewline
58 & -0.052922 & -0.4065 & 0.342923 \tabularnewline
59 & NA & NA & NA \tabularnewline
60 & NA & NA & NA \tabularnewline
\hline
\end{tabular}
%Source: https://freestatistics.org/blog/index.php?pk=35253&T=2

[TABLE]
[ROW][C]Partial Autocorrelation Function[/C][/ROW]
[ROW][C]Time lag k[/C][C]PACF(k)[/C][C]T-STAT[/C][C]P-value[/C][/ROW]
[ROW][C]1[/C][C]0.051025[/C][C]0.3919[/C][C]0.348262[/C][/ROW]
[ROW][C]2[/C][C]-0.14701[/C][C]-1.1292[/C][C]0.131691[/C][/ROW]
[ROW][C]3[/C][C]-0.139226[/C][C]-1.0694[/C][C]0.144619[/C][/ROW]
[ROW][C]4[/C][C]-0.193621[/C][C]-1.4872[/C][C]0.071139[/C][/ROW]
[ROW][C]5[/C][C]0.409436[/C][C]3.1449[/C][C]0.001301[/C][/ROW]
[ROW][C]6[/C][C]-0.114633[/C][C]-0.8805[/C][C]0.191077[/C][/ROW]
[ROW][C]7[/C][C]-0.077594[/C][C]-0.596[/C][C]0.276725[/C][/ROW]
[ROW][C]8[/C][C]-0.109252[/C][C]-0.8392[/C][C]0.202378[/C][/ROW]
[ROW][C]9[/C][C]0.035814[/C][C]0.2751[/C][C]0.392102[/C][/ROW]
[ROW][C]10[/C][C]0.053779[/C][C]0.4131[/C][C]0.340522[/C][/ROW]
[ROW][C]11[/C][C]0.034427[/C][C]0.2644[/C][C]0.39618[/C][/ROW]
[ROW][C]12[/C][C]0.042476[/C][C]0.3263[/C][C]0.372688[/C][/ROW]
[ROW][C]13[/C][C]-0.035023[/C][C]-0.269[/C][C]0.394428[/C][/ROW]
[ROW][C]14[/C][C]0.100178[/C][C]0.7695[/C][C]0.222338[/C][/ROW]
[ROW][C]15[/C][C]-0.089067[/C][C]-0.6841[/C][C]0.248283[/C][/ROW]
[ROW][C]16[/C][C]-0.135638[/C][C]-1.0419[/C][C]0.150865[/C][/ROW]
[ROW][C]17[/C][C]0.1094[/C][C]0.8403[/C][C]0.202061[/C][/ROW]
[ROW][C]18[/C][C]-0.107067[/C][C]-0.8224[/C][C]0.207081[/C][/ROW]
[ROW][C]19[/C][C]0.156965[/C][C]1.2057[/C][C]0.116378[/C][/ROW]
[ROW][C]20[/C][C]0.118975[/C][C]0.9139[/C][C]0.182255[/C][/ROW]
[ROW][C]21[/C][C]-0.00236[/C][C]-0.0181[/C][C]0.4928[/C][/ROW]
[ROW][C]22[/C][C]-0.186635[/C][C]-1.4336[/C][C]0.078487[/C][/ROW]
[ROW][C]23[/C][C]-0.054868[/C][C]-0.4214[/C][C]0.33748[/C][/ROW]
[ROW][C]24[/C][C]0.019461[/C][C]0.1495[/C][C]0.440841[/C][/ROW]
[ROW][C]25[/C][C]0.074154[/C][C]0.5696[/C][C]0.285561[/C][/ROW]
[ROW][C]26[/C][C]0.055658[/C][C]0.4275[/C][C]0.335281[/C][/ROW]
[ROW][C]27[/C][C]-0.135589[/C][C]-1.0415[/C][C]0.150951[/C][/ROW]
[ROW][C]28[/C][C]0.06767[/C][C]0.5198[/C][C]0.30258[/C][/ROW]
[ROW][C]29[/C][C]-0.060857[/C][C]-0.4674[/C][C]0.32095[/C][/ROW]
[ROW][C]30[/C][C]0.024571[/C][C]0.1887[/C][C]0.425474[/C][/ROW]
[ROW][C]31[/C][C]-0.119446[/C][C]-0.9175[/C][C]0.181313[/C][/ROW]
[ROW][C]32[/C][C]0.107289[/C][C]0.8241[/C][C]0.2066[/C][/ROW]
[ROW][C]33[/C][C]-0.070844[/C][C]-0.5442[/C][C]0.29419[/C][/ROW]
[ROW][C]34[/C][C]-0.061803[/C][C]-0.4747[/C][C]0.318371[/C][/ROW]
[ROW][C]35[/C][C]-0.029953[/C][C]-0.2301[/C][C]0.409415[/C][/ROW]
[ROW][C]36[/C][C]-0.06185[/C][C]-0.4751[/C][C]0.318243[/C][/ROW]
[ROW][C]37[/C][C]0.041074[/C][C]0.3155[/C][C]0.376751[/C][/ROW]
[ROW][C]38[/C][C]0.077878[/C][C]0.5982[/C][C]0.276[/C][/ROW]
[ROW][C]39[/C][C]0.041988[/C][C]0.3225[/C][C]0.3741[/C][/ROW]
[ROW][C]40[/C][C]-0.121172[/C][C]-0.9307[/C][C]0.17789[/C][/ROW]
[ROW][C]41[/C][C]0.041732[/C][C]0.3206[/C][C]0.374842[/C][/ROW]
[ROW][C]42[/C][C]-0.072815[/C][C]-0.5593[/C][C]0.289036[/C][/ROW]
[ROW][C]43[/C][C]-0.133706[/C][C]-1.027[/C][C]0.154303[/C][/ROW]
[ROW][C]44[/C][C]-0.120432[/C][C]-0.9251[/C][C]0.179352[/C][/ROW]
[ROW][C]45[/C][C]-0.101888[/C][C]-0.7826[/C][C]0.218491[/C][/ROW]
[ROW][C]46[/C][C]-0.033841[/C][C]-0.2599[/C][C]0.397908[/C][/ROW]
[ROW][C]47[/C][C]0.022571[/C][C]0.1734[/C][C]0.431476[/C][/ROW]
[ROW][C]48[/C][C]0.071156[/C][C]0.5466[/C][C]0.293371[/C][/ROW]
[ROW][C]49[/C][C]-0.049219[/C][C]-0.3781[/C][C]0.353373[/C][/ROW]
[ROW][C]50[/C][C]-0.053821[/C][C]-0.4134[/C][C]0.340403[/C][/ROW]
[ROW][C]51[/C][C]0.013964[/C][C]0.1073[/C][C]0.457474[/C][/ROW]
[ROW][C]52[/C][C]0.053572[/C][C]0.4115[/C][C]0.341101[/C][/ROW]
[ROW][C]53[/C][C]0.051149[/C][C]0.3929[/C][C]0.34791[/C][/ROW]
[ROW][C]54[/C][C]-0.021644[/C][C]-0.1663[/C][C]0.434264[/C][/ROW]
[ROW][C]55[/C][C]0.059748[/C][C]0.4589[/C][C]0.323984[/C][/ROW]
[ROW][C]56[/C][C]-0.00311[/C][C]-0.0239[/C][C]0.490513[/C][/ROW]
[ROW][C]57[/C][C]-0.019329[/C][C]-0.1485[/C][C]0.441239[/C][/ROW]
[ROW][C]58[/C][C]-0.052922[/C][C]-0.4065[/C][C]0.342923[/C][/ROW]
[ROW][C]59[/C][C]NA[/C][C]NA[/C][C]NA[/C][/ROW]
[ROW][C]60[/C][C]NA[/C][C]NA[/C][C]NA[/C][/ROW]
[/TABLE]
Source: https://freestatistics.org/blog/index.php?pk=35253&T=2

Globally Unique Identifier (entire table): ba.freestatistics.org/blog/index.php?pk=35253&T=2

As an alternative you can also use a QR Code:  

The GUIDs for individual cells are displayed in the table below:

Partial Autocorrelation Function
Time lag kPACF(k)T-STATP-value
10.0510250.39190.348262
2-0.14701-1.12920.131691
3-0.139226-1.06940.144619
4-0.193621-1.48720.071139
50.4094363.14490.001301
6-0.114633-0.88050.191077
7-0.077594-0.5960.276725
8-0.109252-0.83920.202378
90.0358140.27510.392102
100.0537790.41310.340522
110.0344270.26440.39618
120.0424760.32630.372688
13-0.035023-0.2690.394428
140.1001780.76950.222338
15-0.089067-0.68410.248283
16-0.135638-1.04190.150865
170.10940.84030.202061
18-0.107067-0.82240.207081
190.1569651.20570.116378
200.1189750.91390.182255
21-0.00236-0.01810.4928
22-0.186635-1.43360.078487
23-0.054868-0.42140.33748
240.0194610.14950.440841
250.0741540.56960.285561
260.0556580.42750.335281
27-0.135589-1.04150.150951
280.067670.51980.30258
29-0.060857-0.46740.32095
300.0245710.18870.425474
31-0.119446-0.91750.181313
320.1072890.82410.2066
33-0.070844-0.54420.29419
34-0.061803-0.47470.318371
35-0.029953-0.23010.409415
36-0.06185-0.47510.318243
370.0410740.31550.376751
380.0778780.59820.276
390.0419880.32250.3741
40-0.121172-0.93070.17789
410.0417320.32060.374842
42-0.072815-0.55930.289036
43-0.133706-1.0270.154303
44-0.120432-0.92510.179352
45-0.101888-0.78260.218491
46-0.033841-0.25990.397908
470.0225710.17340.431476
480.0711560.54660.293371
49-0.049219-0.37810.353373
50-0.053821-0.41340.340403
510.0139640.10730.457474
520.0535720.41150.341101
530.0511490.39290.34791
54-0.021644-0.16630.434264
550.0597480.45890.323984
56-0.00311-0.02390.490513
57-0.019329-0.14850.441239
58-0.052922-0.40650.342923
59NANANA
60NANANA


Parameters (Session):
par1 = 60 ; par2 = 1 ; par3 = 1 ; par4 = 0 ; par5 = 12 ;
Parameters (R input):
par1 = 60 ; par2 = 1 ; par3 = 1 ; par4 = 0 ; par5 = 12 ;
R code (references can be found in the software module):
if (par1 == 'Default') {
par1 = 10*log10(length(x))
} else {
par1 <- as.numeric(par1)
}
par2 <- as.numeric(par2)
par3 <- as.numeric(par3)
par4 <- as.numeric(par4)
par5 <- as.numeric(par5)
if (par2 == 0) {
x <- log(x)
} else {
x <- (x ^ par2 - 1) / par2
}
if (par3 > 0) x <- diff(x,lag=1,difference=par3)
if (par4 > 0) x <- diff(x,lag=par5,difference=par4)
bitmap(file='pic1.png')
racf <- acf(x,par1,main='Autocorrelation',xlab='lags',ylab='ACF')
dev.off()
bitmap(file='pic2.png')
rpacf <- pacf(x,par1,main='Partial Autocorrelation',xlab='lags',ylab='PACF')
dev.off()
(myacf <- c(racf$acf))
(mypacf <- c(rpacf$acf))
lengthx <- length(x)
sqrtn <- sqrt(lengthx)
load(file='createtable')
a<-table.start()
a<-table.row.start(a)
a<-table.element(a,'Autocorrelation Function',4,TRUE)
a<-table.row.end(a)
a<-table.row.start(a)
a<-table.element(a,'Time lag k',header=TRUE)
a<-table.element(a,hyperlink('basics.htm','ACF(k)','click here for more information about the Autocorrelation Function'),header=TRUE)
a<-table.element(a,'T-STAT',header=TRUE)
a<-table.element(a,'P-value',header=TRUE)
a<-table.row.end(a)
for (i in 2:(par1+1)) {
a<-table.row.start(a)
a<-table.element(a,i-1,header=TRUE)
a<-table.element(a,round(myacf[i],6))
mytstat <- myacf[i]*sqrtn
a<-table.element(a,round(mytstat,4))
a<-table.element(a,round(1-pt(abs(mytstat),lengthx),6))
a<-table.row.end(a)
}
a<-table.end(a)
table.save(a,file='mytable.tab')
a<-table.start()
a<-table.row.start(a)
a<-table.element(a,'Partial Autocorrelation Function',4,TRUE)
a<-table.row.end(a)
a<-table.row.start(a)
a<-table.element(a,'Time lag k',header=TRUE)
a<-table.element(a,hyperlink('basics.htm','PACF(k)','click here for more information about the Partial Autocorrelation Function'),header=TRUE)
a<-table.element(a,'T-STAT',header=TRUE)
a<-table.element(a,'P-value',header=TRUE)
a<-table.row.end(a)
for (i in 1:par1) {
a<-table.row.start(a)
a<-table.element(a,i,header=TRUE)
a<-table.element(a,round(mypacf[i],6))
mytstat <- mypacf[i]*sqrtn
a<-table.element(a,round(mytstat,4))
a<-table.element(a,round(1-pt(abs(mytstat),lengthx),6))
a<-table.row.end(a)
}
a<-table.end(a)
table.save(a,file='mytable1.tab')