Free Statistics

of Irreproducible Research!

Author's title

Author*The author of this computation has been verified*
R Software Modulerwasp_autocorrelation.wasp
Title produced by software(Partial) Autocorrelation Function
Date of computationFri, 19 Dec 2008 10:22:27 -0700
Cite this page as followsStatistical Computations at FreeStatistics.org, Office for Research Development and Education, URL https://freestatistics.org/blog/index.php?v=date/2008/Dec/19/t1229707369793vpfrxl0octnk.htm/, Retrieved Wed, 15 May 2024 00:49:58 +0000
Statistical Computations at FreeStatistics.org, Office for Research Development and Education, URL https://freestatistics.org/blog/index.php?pk=35230, Retrieved Wed, 15 May 2024 00:49:58 +0000
QR Codes:

Original text written by user:
IsPrivate?No (this computation is public)
User-defined keywords
Estimated Impact175
Family? (F = Feedback message, R = changed R code, M = changed R Module, P = changed Parameters, D = changed Data)
-     [Univariate Data Series] [data set] [2008-12-01 19:54:57] [b98453cac15ba1066b407e146608df68]
- RMPD  [(Partial) Autocorrelation Function] [T8 12] [2008-12-03 19:18:47] [8eb83367d7ce233bbf617141d324189b]
-   PD      [(Partial) Autocorrelation Function] [Paper - ACF ] [2008-12-19 17:22:27] [63302faa1e3976bf98d1de42298c0b24] [Current]
Feedback Forum

Post a new message
Dataseries X:
90,8
96,4
90
92,1
97,2
95,1
88,5
91
90,5
75
66,3
66
68,4
70,6
83,9
90,1
90,6
87,1
90,8
94,1
99,8
96,8
87
96,3
107,1
115,2
106,1
89,5
91,3
97,6
100,7
104,6
94,7
101,8
102,5
105,3
110,3
109,8
117,3
118,8
131,3
125,9
133,1
147
145,8
164,4
149,8
137,7
151,7
156,8
180
180,4
170,4
191,6
199,5
218,2
217,5
205
194
199,3


Summary of computational transaction
Raw Inputview raw input (R code)
Raw Outputview raw output of R engine
Computing time2 seconds
R Server'Sir Ronald Aylmer Fisher' @ 193.190.124.24

\begin{tabular}{lllllllll}
\hline
Summary of computational transaction \tabularnewline
Raw Input & view raw input (R code)  \tabularnewline
Raw Output & view raw output of R engine  \tabularnewline
Computing time & 2 seconds \tabularnewline
R Server & 'Sir Ronald Aylmer Fisher' @ 193.190.124.24 \tabularnewline
\hline
\end{tabular}
%Source: https://freestatistics.org/blog/index.php?pk=35230&T=0

[TABLE]
[ROW][C]Summary of computational transaction[/C][/ROW]
[ROW][C]Raw Input[/C][C]view raw input (R code) [/C][/ROW]
[ROW][C]Raw Output[/C][C]view raw output of R engine [/C][/ROW]
[ROW][C]Computing time[/C][C]2 seconds[/C][/ROW]
[ROW][C]R Server[/C][C]'Sir Ronald Aylmer Fisher' @ 193.190.124.24[/C][/ROW]
[/TABLE]
Source: https://freestatistics.org/blog/index.php?pk=35230&T=0

Globally Unique Identifier (entire table): ba.freestatistics.org/blog/index.php?pk=35230&T=0

As an alternative you can also use a QR Code:  

The GUIDs for individual cells are displayed in the table below:

Summary of computational transaction
Raw Inputview raw input (R code)
Raw Outputview raw output of R engine
Computing time2 seconds
R Server'Sir Ronald Aylmer Fisher' @ 193.190.124.24


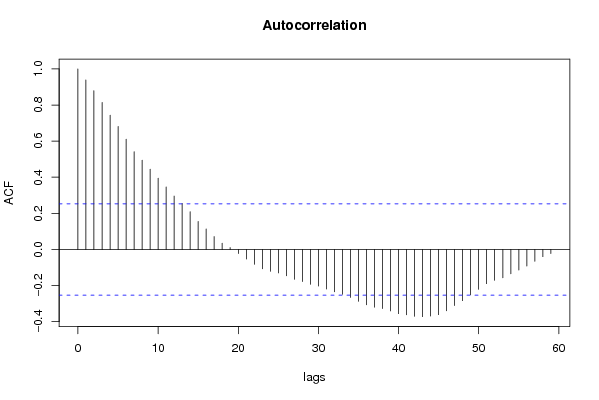
Autocorrelation Function
Time lag kACF(k)T-STATP-value
10.9389487.27310
20.8794736.81240
30.8140566.30560
40.7440845.76360
50.6811825.27641e-06
60.6109524.73247e-06
70.54174.1964.6e-05
80.4947443.83230.000153
90.4449063.44620.000522
100.394743.05760.001665
110.3465072.6840.004694
120.2953992.28810.012834
130.2548871.97430.026475
140.209061.61940.055306
150.1553481.20330.11679
160.1130970.8760.19225
170.0711450.55110.29181
180.0342970.26570.395704
190.0101020.07830.468944
20-0.022344-0.17310.431586
21-0.053521-0.41460.339967
22-0.082612-0.63990.262334
23-0.107368-0.83170.204446
24-0.121048-0.93760.176097
25-0.130031-1.00720.158937
26-0.145708-1.12860.13177
27-0.165064-1.27860.102984
28-0.178285-1.3810.086202
29-0.192594-1.49180.070492
30-0.202283-1.56690.061202
31-0.219338-1.6990.047251
32-0.234288-1.81480.037278
33-0.248202-1.92260.029643
34-0.265684-2.0580.021972
35-0.287351-2.22580.014898
36-0.306494-2.37410.010405
37-0.31972-2.47650.008052
38-0.327701-2.53840.006875
39-0.340592-2.63820.0053
40-0.355866-2.75650.003864
41-0.362477-2.80770.003361
42-0.369912-2.86530.002868
43-0.372395-2.88460.002718
44-0.369238-2.86010.002909
45-0.361412-2.79950.003437
46-0.340221-2.63530.005341
47-0.310475-2.40490.009639
48-0.283683-2.19740.015932
49-0.25163-1.94910.02798
50-0.220393-1.70720.046482
51-0.189545-1.46820.073635
52-0.170739-1.32250.095504
53-0.157373-1.2190.113806
54-0.134384-1.04090.151041
55-0.11457-0.88750.189189
56-0.091868-0.71160.239732
57-0.065398-0.50660.307156
58-0.039878-0.30890.379236
59-0.022944-0.17770.429771
60NANANA

\begin{tabular}{lllllllll}
\hline
Autocorrelation Function \tabularnewline
Time lag k & ACF(k) & T-STAT & P-value \tabularnewline
1 & 0.938948 & 7.2731 & 0 \tabularnewline
2 & 0.879473 & 6.8124 & 0 \tabularnewline
3 & 0.814056 & 6.3056 & 0 \tabularnewline
4 & 0.744084 & 5.7636 & 0 \tabularnewline
5 & 0.681182 & 5.2764 & 1e-06 \tabularnewline
6 & 0.610952 & 4.7324 & 7e-06 \tabularnewline
7 & 0.5417 & 4.196 & 4.6e-05 \tabularnewline
8 & 0.494744 & 3.8323 & 0.000153 \tabularnewline
9 & 0.444906 & 3.4462 & 0.000522 \tabularnewline
10 & 0.39474 & 3.0576 & 0.001665 \tabularnewline
11 & 0.346507 & 2.684 & 0.004694 \tabularnewline
12 & 0.295399 & 2.2881 & 0.012834 \tabularnewline
13 & 0.254887 & 1.9743 & 0.026475 \tabularnewline
14 & 0.20906 & 1.6194 & 0.055306 \tabularnewline
15 & 0.155348 & 1.2033 & 0.11679 \tabularnewline
16 & 0.113097 & 0.876 & 0.19225 \tabularnewline
17 & 0.071145 & 0.5511 & 0.29181 \tabularnewline
18 & 0.034297 & 0.2657 & 0.395704 \tabularnewline
19 & 0.010102 & 0.0783 & 0.468944 \tabularnewline
20 & -0.022344 & -0.1731 & 0.431586 \tabularnewline
21 & -0.053521 & -0.4146 & 0.339967 \tabularnewline
22 & -0.082612 & -0.6399 & 0.262334 \tabularnewline
23 & -0.107368 & -0.8317 & 0.204446 \tabularnewline
24 & -0.121048 & -0.9376 & 0.176097 \tabularnewline
25 & -0.130031 & -1.0072 & 0.158937 \tabularnewline
26 & -0.145708 & -1.1286 & 0.13177 \tabularnewline
27 & -0.165064 & -1.2786 & 0.102984 \tabularnewline
28 & -0.178285 & -1.381 & 0.086202 \tabularnewline
29 & -0.192594 & -1.4918 & 0.070492 \tabularnewline
30 & -0.202283 & -1.5669 & 0.061202 \tabularnewline
31 & -0.219338 & -1.699 & 0.047251 \tabularnewline
32 & -0.234288 & -1.8148 & 0.037278 \tabularnewline
33 & -0.248202 & -1.9226 & 0.029643 \tabularnewline
34 & -0.265684 & -2.058 & 0.021972 \tabularnewline
35 & -0.287351 & -2.2258 & 0.014898 \tabularnewline
36 & -0.306494 & -2.3741 & 0.010405 \tabularnewline
37 & -0.31972 & -2.4765 & 0.008052 \tabularnewline
38 & -0.327701 & -2.5384 & 0.006875 \tabularnewline
39 & -0.340592 & -2.6382 & 0.0053 \tabularnewline
40 & -0.355866 & -2.7565 & 0.003864 \tabularnewline
41 & -0.362477 & -2.8077 & 0.003361 \tabularnewline
42 & -0.369912 & -2.8653 & 0.002868 \tabularnewline
43 & -0.372395 & -2.8846 & 0.002718 \tabularnewline
44 & -0.369238 & -2.8601 & 0.002909 \tabularnewline
45 & -0.361412 & -2.7995 & 0.003437 \tabularnewline
46 & -0.340221 & -2.6353 & 0.005341 \tabularnewline
47 & -0.310475 & -2.4049 & 0.009639 \tabularnewline
48 & -0.283683 & -2.1974 & 0.015932 \tabularnewline
49 & -0.25163 & -1.9491 & 0.02798 \tabularnewline
50 & -0.220393 & -1.7072 & 0.046482 \tabularnewline
51 & -0.189545 & -1.4682 & 0.073635 \tabularnewline
52 & -0.170739 & -1.3225 & 0.095504 \tabularnewline
53 & -0.157373 & -1.219 & 0.113806 \tabularnewline
54 & -0.134384 & -1.0409 & 0.151041 \tabularnewline
55 & -0.11457 & -0.8875 & 0.189189 \tabularnewline
56 & -0.091868 & -0.7116 & 0.239732 \tabularnewline
57 & -0.065398 & -0.5066 & 0.307156 \tabularnewline
58 & -0.039878 & -0.3089 & 0.379236 \tabularnewline
59 & -0.022944 & -0.1777 & 0.429771 \tabularnewline
60 & NA & NA & NA \tabularnewline
\hline
\end{tabular}
%Source: https://freestatistics.org/blog/index.php?pk=35230&T=1

[TABLE]
[ROW][C]Autocorrelation Function[/C][/ROW]
[ROW][C]Time lag k[/C][C]ACF(k)[/C][C]T-STAT[/C][C]P-value[/C][/ROW]
[ROW][C]1[/C][C]0.938948[/C][C]7.2731[/C][C]0[/C][/ROW]
[ROW][C]2[/C][C]0.879473[/C][C]6.8124[/C][C]0[/C][/ROW]
[ROW][C]3[/C][C]0.814056[/C][C]6.3056[/C][C]0[/C][/ROW]
[ROW][C]4[/C][C]0.744084[/C][C]5.7636[/C][C]0[/C][/ROW]
[ROW][C]5[/C][C]0.681182[/C][C]5.2764[/C][C]1e-06[/C][/ROW]
[ROW][C]6[/C][C]0.610952[/C][C]4.7324[/C][C]7e-06[/C][/ROW]
[ROW][C]7[/C][C]0.5417[/C][C]4.196[/C][C]4.6e-05[/C][/ROW]
[ROW][C]8[/C][C]0.494744[/C][C]3.8323[/C][C]0.000153[/C][/ROW]
[ROW][C]9[/C][C]0.444906[/C][C]3.4462[/C][C]0.000522[/C][/ROW]
[ROW][C]10[/C][C]0.39474[/C][C]3.0576[/C][C]0.001665[/C][/ROW]
[ROW][C]11[/C][C]0.346507[/C][C]2.684[/C][C]0.004694[/C][/ROW]
[ROW][C]12[/C][C]0.295399[/C][C]2.2881[/C][C]0.012834[/C][/ROW]
[ROW][C]13[/C][C]0.254887[/C][C]1.9743[/C][C]0.026475[/C][/ROW]
[ROW][C]14[/C][C]0.20906[/C][C]1.6194[/C][C]0.055306[/C][/ROW]
[ROW][C]15[/C][C]0.155348[/C][C]1.2033[/C][C]0.11679[/C][/ROW]
[ROW][C]16[/C][C]0.113097[/C][C]0.876[/C][C]0.19225[/C][/ROW]
[ROW][C]17[/C][C]0.071145[/C][C]0.5511[/C][C]0.29181[/C][/ROW]
[ROW][C]18[/C][C]0.034297[/C][C]0.2657[/C][C]0.395704[/C][/ROW]
[ROW][C]19[/C][C]0.010102[/C][C]0.0783[/C][C]0.468944[/C][/ROW]
[ROW][C]20[/C][C]-0.022344[/C][C]-0.1731[/C][C]0.431586[/C][/ROW]
[ROW][C]21[/C][C]-0.053521[/C][C]-0.4146[/C][C]0.339967[/C][/ROW]
[ROW][C]22[/C][C]-0.082612[/C][C]-0.6399[/C][C]0.262334[/C][/ROW]
[ROW][C]23[/C][C]-0.107368[/C][C]-0.8317[/C][C]0.204446[/C][/ROW]
[ROW][C]24[/C][C]-0.121048[/C][C]-0.9376[/C][C]0.176097[/C][/ROW]
[ROW][C]25[/C][C]-0.130031[/C][C]-1.0072[/C][C]0.158937[/C][/ROW]
[ROW][C]26[/C][C]-0.145708[/C][C]-1.1286[/C][C]0.13177[/C][/ROW]
[ROW][C]27[/C][C]-0.165064[/C][C]-1.2786[/C][C]0.102984[/C][/ROW]
[ROW][C]28[/C][C]-0.178285[/C][C]-1.381[/C][C]0.086202[/C][/ROW]
[ROW][C]29[/C][C]-0.192594[/C][C]-1.4918[/C][C]0.070492[/C][/ROW]
[ROW][C]30[/C][C]-0.202283[/C][C]-1.5669[/C][C]0.061202[/C][/ROW]
[ROW][C]31[/C][C]-0.219338[/C][C]-1.699[/C][C]0.047251[/C][/ROW]
[ROW][C]32[/C][C]-0.234288[/C][C]-1.8148[/C][C]0.037278[/C][/ROW]
[ROW][C]33[/C][C]-0.248202[/C][C]-1.9226[/C][C]0.029643[/C][/ROW]
[ROW][C]34[/C][C]-0.265684[/C][C]-2.058[/C][C]0.021972[/C][/ROW]
[ROW][C]35[/C][C]-0.287351[/C][C]-2.2258[/C][C]0.014898[/C][/ROW]
[ROW][C]36[/C][C]-0.306494[/C][C]-2.3741[/C][C]0.010405[/C][/ROW]
[ROW][C]37[/C][C]-0.31972[/C][C]-2.4765[/C][C]0.008052[/C][/ROW]
[ROW][C]38[/C][C]-0.327701[/C][C]-2.5384[/C][C]0.006875[/C][/ROW]
[ROW][C]39[/C][C]-0.340592[/C][C]-2.6382[/C][C]0.0053[/C][/ROW]
[ROW][C]40[/C][C]-0.355866[/C][C]-2.7565[/C][C]0.003864[/C][/ROW]
[ROW][C]41[/C][C]-0.362477[/C][C]-2.8077[/C][C]0.003361[/C][/ROW]
[ROW][C]42[/C][C]-0.369912[/C][C]-2.8653[/C][C]0.002868[/C][/ROW]
[ROW][C]43[/C][C]-0.372395[/C][C]-2.8846[/C][C]0.002718[/C][/ROW]
[ROW][C]44[/C][C]-0.369238[/C][C]-2.8601[/C][C]0.002909[/C][/ROW]
[ROW][C]45[/C][C]-0.361412[/C][C]-2.7995[/C][C]0.003437[/C][/ROW]
[ROW][C]46[/C][C]-0.340221[/C][C]-2.6353[/C][C]0.005341[/C][/ROW]
[ROW][C]47[/C][C]-0.310475[/C][C]-2.4049[/C][C]0.009639[/C][/ROW]
[ROW][C]48[/C][C]-0.283683[/C][C]-2.1974[/C][C]0.015932[/C][/ROW]
[ROW][C]49[/C][C]-0.25163[/C][C]-1.9491[/C][C]0.02798[/C][/ROW]
[ROW][C]50[/C][C]-0.220393[/C][C]-1.7072[/C][C]0.046482[/C][/ROW]
[ROW][C]51[/C][C]-0.189545[/C][C]-1.4682[/C][C]0.073635[/C][/ROW]
[ROW][C]52[/C][C]-0.170739[/C][C]-1.3225[/C][C]0.095504[/C][/ROW]
[ROW][C]53[/C][C]-0.157373[/C][C]-1.219[/C][C]0.113806[/C][/ROW]
[ROW][C]54[/C][C]-0.134384[/C][C]-1.0409[/C][C]0.151041[/C][/ROW]
[ROW][C]55[/C][C]-0.11457[/C][C]-0.8875[/C][C]0.189189[/C][/ROW]
[ROW][C]56[/C][C]-0.091868[/C][C]-0.7116[/C][C]0.239732[/C][/ROW]
[ROW][C]57[/C][C]-0.065398[/C][C]-0.5066[/C][C]0.307156[/C][/ROW]
[ROW][C]58[/C][C]-0.039878[/C][C]-0.3089[/C][C]0.379236[/C][/ROW]
[ROW][C]59[/C][C]-0.022944[/C][C]-0.1777[/C][C]0.429771[/C][/ROW]
[ROW][C]60[/C][C]NA[/C][C]NA[/C][C]NA[/C][/ROW]
[/TABLE]
Source: https://freestatistics.org/blog/index.php?pk=35230&T=1

Globally Unique Identifier (entire table): ba.freestatistics.org/blog/index.php?pk=35230&T=1

As an alternative you can also use a QR Code:  

The GUIDs for individual cells are displayed in the table below:

Autocorrelation Function
Time lag kACF(k)T-STATP-value
10.9389487.27310
20.8794736.81240
30.8140566.30560
40.7440845.76360
50.6811825.27641e-06
60.6109524.73247e-06
70.54174.1964.6e-05
80.4947443.83230.000153
90.4449063.44620.000522
100.394743.05760.001665
110.3465072.6840.004694
120.2953992.28810.012834
130.2548871.97430.026475
140.209061.61940.055306
150.1553481.20330.11679
160.1130970.8760.19225
170.0711450.55110.29181
180.0342970.26570.395704
190.0101020.07830.468944
20-0.022344-0.17310.431586
21-0.053521-0.41460.339967
22-0.082612-0.63990.262334
23-0.107368-0.83170.204446
24-0.121048-0.93760.176097
25-0.130031-1.00720.158937
26-0.145708-1.12860.13177
27-0.165064-1.27860.102984
28-0.178285-1.3810.086202
29-0.192594-1.49180.070492
30-0.202283-1.56690.061202
31-0.219338-1.6990.047251
32-0.234288-1.81480.037278
33-0.248202-1.92260.029643
34-0.265684-2.0580.021972
35-0.287351-2.22580.014898
36-0.306494-2.37410.010405
37-0.31972-2.47650.008052
38-0.327701-2.53840.006875
39-0.340592-2.63820.0053
40-0.355866-2.75650.003864
41-0.362477-2.80770.003361
42-0.369912-2.86530.002868
43-0.372395-2.88460.002718
44-0.369238-2.86010.002909
45-0.361412-2.79950.003437
46-0.340221-2.63530.005341
47-0.310475-2.40490.009639
48-0.283683-2.19740.015932
49-0.25163-1.94910.02798
50-0.220393-1.70720.046482
51-0.189545-1.46820.073635
52-0.170739-1.32250.095504
53-0.157373-1.2190.113806
54-0.134384-1.04090.151041
55-0.11457-0.88750.189189
56-0.091868-0.71160.239732
57-0.065398-0.50660.307156
58-0.039878-0.30890.379236
59-0.022944-0.17770.429771
60NANANA


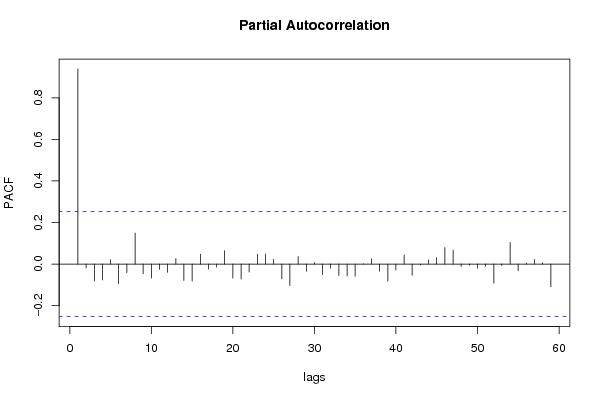
Partial Autocorrelation Function
Time lag kPACF(k)T-STATP-value
10.9389487.27310
2-0.018171-0.14070.44427
3-0.081694-0.63280.264635
4-0.076165-0.590.278711
50.0212810.16480.434811
6-0.094686-0.73340.233074
7-0.041155-0.31880.3755
80.149181.15550.126224
9-0.046599-0.3610.3597
10-0.066874-0.5180.303181
11-0.025742-0.19940.421313
12-0.039195-0.30360.381241
130.0263240.20390.419559
14-0.078589-0.60880.272494
15-0.081326-0.62990.26556
160.0474760.36780.357176
17-0.023594-0.18280.427801
18-0.014262-0.11050.456201
190.0646390.50070.30921
20-0.06732-0.52150.301983
21-0.071915-0.55710.289782
22-0.038153-0.29550.384303
230.0472070.36570.357951
240.0483140.37420.354773
250.0231090.1790.42927
26-0.071012-0.55010.292161
27-0.103191-0.79930.21363
280.0360390.27920.390541
29-0.034307-0.26570.395674
300.0076660.05940.476422
31-0.050737-0.3930.347853
32-0.020369-0.15780.437582
33-0.054584-0.42280.336974
34-0.05689-0.44070.330519
35-0.05821-0.45090.326847
36-0.000942-0.00730.4971
370.0250360.19390.423444
38-0.034592-0.2680.394828
39-0.081575-0.63190.264933
40-0.028664-0.2220.412523
410.0431990.33460.36954
42-0.05397-0.41810.338701
43-0.004734-0.03670.485437
440.019880.1540.439066
450.0308740.23920.405901
460.0792720.6140.270755
470.0668960.51820.303122
48-0.011192-0.08670.465602
49-0.005577-0.04320.482844
50-0.019957-0.15460.438832
51-0.010121-0.07840.468888
52-0.091842-0.71140.239795
53-0.007303-0.05660.477539
540.1042990.80790.211172
55-0.032012-0.2480.402506
560.0053870.04170.483428
570.0220280.17060.432544
580.006870.05320.47887
59-0.109691-0.84970.199444
60NANANA

\begin{tabular}{lllllllll}
\hline
Partial Autocorrelation Function \tabularnewline
Time lag k & PACF(k) & T-STAT & P-value \tabularnewline
1 & 0.938948 & 7.2731 & 0 \tabularnewline
2 & -0.018171 & -0.1407 & 0.44427 \tabularnewline
3 & -0.081694 & -0.6328 & 0.264635 \tabularnewline
4 & -0.076165 & -0.59 & 0.278711 \tabularnewline
5 & 0.021281 & 0.1648 & 0.434811 \tabularnewline
6 & -0.094686 & -0.7334 & 0.233074 \tabularnewline
7 & -0.041155 & -0.3188 & 0.3755 \tabularnewline
8 & 0.14918 & 1.1555 & 0.126224 \tabularnewline
9 & -0.046599 & -0.361 & 0.3597 \tabularnewline
10 & -0.066874 & -0.518 & 0.303181 \tabularnewline
11 & -0.025742 & -0.1994 & 0.421313 \tabularnewline
12 & -0.039195 & -0.3036 & 0.381241 \tabularnewline
13 & 0.026324 & 0.2039 & 0.419559 \tabularnewline
14 & -0.078589 & -0.6088 & 0.272494 \tabularnewline
15 & -0.081326 & -0.6299 & 0.26556 \tabularnewline
16 & 0.047476 & 0.3678 & 0.357176 \tabularnewline
17 & -0.023594 & -0.1828 & 0.427801 \tabularnewline
18 & -0.014262 & -0.1105 & 0.456201 \tabularnewline
19 & 0.064639 & 0.5007 & 0.30921 \tabularnewline
20 & -0.06732 & -0.5215 & 0.301983 \tabularnewline
21 & -0.071915 & -0.5571 & 0.289782 \tabularnewline
22 & -0.038153 & -0.2955 & 0.384303 \tabularnewline
23 & 0.047207 & 0.3657 & 0.357951 \tabularnewline
24 & 0.048314 & 0.3742 & 0.354773 \tabularnewline
25 & 0.023109 & 0.179 & 0.42927 \tabularnewline
26 & -0.071012 & -0.5501 & 0.292161 \tabularnewline
27 & -0.103191 & -0.7993 & 0.21363 \tabularnewline
28 & 0.036039 & 0.2792 & 0.390541 \tabularnewline
29 & -0.034307 & -0.2657 & 0.395674 \tabularnewline
30 & 0.007666 & 0.0594 & 0.476422 \tabularnewline
31 & -0.050737 & -0.393 & 0.347853 \tabularnewline
32 & -0.020369 & -0.1578 & 0.437582 \tabularnewline
33 & -0.054584 & -0.4228 & 0.336974 \tabularnewline
34 & -0.05689 & -0.4407 & 0.330519 \tabularnewline
35 & -0.05821 & -0.4509 & 0.326847 \tabularnewline
36 & -0.000942 & -0.0073 & 0.4971 \tabularnewline
37 & 0.025036 & 0.1939 & 0.423444 \tabularnewline
38 & -0.034592 & -0.268 & 0.394828 \tabularnewline
39 & -0.081575 & -0.6319 & 0.264933 \tabularnewline
40 & -0.028664 & -0.222 & 0.412523 \tabularnewline
41 & 0.043199 & 0.3346 & 0.36954 \tabularnewline
42 & -0.05397 & -0.4181 & 0.338701 \tabularnewline
43 & -0.004734 & -0.0367 & 0.485437 \tabularnewline
44 & 0.01988 & 0.154 & 0.439066 \tabularnewline
45 & 0.030874 & 0.2392 & 0.405901 \tabularnewline
46 & 0.079272 & 0.614 & 0.270755 \tabularnewline
47 & 0.066896 & 0.5182 & 0.303122 \tabularnewline
48 & -0.011192 & -0.0867 & 0.465602 \tabularnewline
49 & -0.005577 & -0.0432 & 0.482844 \tabularnewline
50 & -0.019957 & -0.1546 & 0.438832 \tabularnewline
51 & -0.010121 & -0.0784 & 0.468888 \tabularnewline
52 & -0.091842 & -0.7114 & 0.239795 \tabularnewline
53 & -0.007303 & -0.0566 & 0.477539 \tabularnewline
54 & 0.104299 & 0.8079 & 0.211172 \tabularnewline
55 & -0.032012 & -0.248 & 0.402506 \tabularnewline
56 & 0.005387 & 0.0417 & 0.483428 \tabularnewline
57 & 0.022028 & 0.1706 & 0.432544 \tabularnewline
58 & 0.00687 & 0.0532 & 0.47887 \tabularnewline
59 & -0.109691 & -0.8497 & 0.199444 \tabularnewline
60 & NA & NA & NA \tabularnewline
\hline
\end{tabular}
%Source: https://freestatistics.org/blog/index.php?pk=35230&T=2

[TABLE]
[ROW][C]Partial Autocorrelation Function[/C][/ROW]
[ROW][C]Time lag k[/C][C]PACF(k)[/C][C]T-STAT[/C][C]P-value[/C][/ROW]
[ROW][C]1[/C][C]0.938948[/C][C]7.2731[/C][C]0[/C][/ROW]
[ROW][C]2[/C][C]-0.018171[/C][C]-0.1407[/C][C]0.44427[/C][/ROW]
[ROW][C]3[/C][C]-0.081694[/C][C]-0.6328[/C][C]0.264635[/C][/ROW]
[ROW][C]4[/C][C]-0.076165[/C][C]-0.59[/C][C]0.278711[/C][/ROW]
[ROW][C]5[/C][C]0.021281[/C][C]0.1648[/C][C]0.434811[/C][/ROW]
[ROW][C]6[/C][C]-0.094686[/C][C]-0.7334[/C][C]0.233074[/C][/ROW]
[ROW][C]7[/C][C]-0.041155[/C][C]-0.3188[/C][C]0.3755[/C][/ROW]
[ROW][C]8[/C][C]0.14918[/C][C]1.1555[/C][C]0.126224[/C][/ROW]
[ROW][C]9[/C][C]-0.046599[/C][C]-0.361[/C][C]0.3597[/C][/ROW]
[ROW][C]10[/C][C]-0.066874[/C][C]-0.518[/C][C]0.303181[/C][/ROW]
[ROW][C]11[/C][C]-0.025742[/C][C]-0.1994[/C][C]0.421313[/C][/ROW]
[ROW][C]12[/C][C]-0.039195[/C][C]-0.3036[/C][C]0.381241[/C][/ROW]
[ROW][C]13[/C][C]0.026324[/C][C]0.2039[/C][C]0.419559[/C][/ROW]
[ROW][C]14[/C][C]-0.078589[/C][C]-0.6088[/C][C]0.272494[/C][/ROW]
[ROW][C]15[/C][C]-0.081326[/C][C]-0.6299[/C][C]0.26556[/C][/ROW]
[ROW][C]16[/C][C]0.047476[/C][C]0.3678[/C][C]0.357176[/C][/ROW]
[ROW][C]17[/C][C]-0.023594[/C][C]-0.1828[/C][C]0.427801[/C][/ROW]
[ROW][C]18[/C][C]-0.014262[/C][C]-0.1105[/C][C]0.456201[/C][/ROW]
[ROW][C]19[/C][C]0.064639[/C][C]0.5007[/C][C]0.30921[/C][/ROW]
[ROW][C]20[/C][C]-0.06732[/C][C]-0.5215[/C][C]0.301983[/C][/ROW]
[ROW][C]21[/C][C]-0.071915[/C][C]-0.5571[/C][C]0.289782[/C][/ROW]
[ROW][C]22[/C][C]-0.038153[/C][C]-0.2955[/C][C]0.384303[/C][/ROW]
[ROW][C]23[/C][C]0.047207[/C][C]0.3657[/C][C]0.357951[/C][/ROW]
[ROW][C]24[/C][C]0.048314[/C][C]0.3742[/C][C]0.354773[/C][/ROW]
[ROW][C]25[/C][C]0.023109[/C][C]0.179[/C][C]0.42927[/C][/ROW]
[ROW][C]26[/C][C]-0.071012[/C][C]-0.5501[/C][C]0.292161[/C][/ROW]
[ROW][C]27[/C][C]-0.103191[/C][C]-0.7993[/C][C]0.21363[/C][/ROW]
[ROW][C]28[/C][C]0.036039[/C][C]0.2792[/C][C]0.390541[/C][/ROW]
[ROW][C]29[/C][C]-0.034307[/C][C]-0.2657[/C][C]0.395674[/C][/ROW]
[ROW][C]30[/C][C]0.007666[/C][C]0.0594[/C][C]0.476422[/C][/ROW]
[ROW][C]31[/C][C]-0.050737[/C][C]-0.393[/C][C]0.347853[/C][/ROW]
[ROW][C]32[/C][C]-0.020369[/C][C]-0.1578[/C][C]0.437582[/C][/ROW]
[ROW][C]33[/C][C]-0.054584[/C][C]-0.4228[/C][C]0.336974[/C][/ROW]
[ROW][C]34[/C][C]-0.05689[/C][C]-0.4407[/C][C]0.330519[/C][/ROW]
[ROW][C]35[/C][C]-0.05821[/C][C]-0.4509[/C][C]0.326847[/C][/ROW]
[ROW][C]36[/C][C]-0.000942[/C][C]-0.0073[/C][C]0.4971[/C][/ROW]
[ROW][C]37[/C][C]0.025036[/C][C]0.1939[/C][C]0.423444[/C][/ROW]
[ROW][C]38[/C][C]-0.034592[/C][C]-0.268[/C][C]0.394828[/C][/ROW]
[ROW][C]39[/C][C]-0.081575[/C][C]-0.6319[/C][C]0.264933[/C][/ROW]
[ROW][C]40[/C][C]-0.028664[/C][C]-0.222[/C][C]0.412523[/C][/ROW]
[ROW][C]41[/C][C]0.043199[/C][C]0.3346[/C][C]0.36954[/C][/ROW]
[ROW][C]42[/C][C]-0.05397[/C][C]-0.4181[/C][C]0.338701[/C][/ROW]
[ROW][C]43[/C][C]-0.004734[/C][C]-0.0367[/C][C]0.485437[/C][/ROW]
[ROW][C]44[/C][C]0.01988[/C][C]0.154[/C][C]0.439066[/C][/ROW]
[ROW][C]45[/C][C]0.030874[/C][C]0.2392[/C][C]0.405901[/C][/ROW]
[ROW][C]46[/C][C]0.079272[/C][C]0.614[/C][C]0.270755[/C][/ROW]
[ROW][C]47[/C][C]0.066896[/C][C]0.5182[/C][C]0.303122[/C][/ROW]
[ROW][C]48[/C][C]-0.011192[/C][C]-0.0867[/C][C]0.465602[/C][/ROW]
[ROW][C]49[/C][C]-0.005577[/C][C]-0.0432[/C][C]0.482844[/C][/ROW]
[ROW][C]50[/C][C]-0.019957[/C][C]-0.1546[/C][C]0.438832[/C][/ROW]
[ROW][C]51[/C][C]-0.010121[/C][C]-0.0784[/C][C]0.468888[/C][/ROW]
[ROW][C]52[/C][C]-0.091842[/C][C]-0.7114[/C][C]0.239795[/C][/ROW]
[ROW][C]53[/C][C]-0.007303[/C][C]-0.0566[/C][C]0.477539[/C][/ROW]
[ROW][C]54[/C][C]0.104299[/C][C]0.8079[/C][C]0.211172[/C][/ROW]
[ROW][C]55[/C][C]-0.032012[/C][C]-0.248[/C][C]0.402506[/C][/ROW]
[ROW][C]56[/C][C]0.005387[/C][C]0.0417[/C][C]0.483428[/C][/ROW]
[ROW][C]57[/C][C]0.022028[/C][C]0.1706[/C][C]0.432544[/C][/ROW]
[ROW][C]58[/C][C]0.00687[/C][C]0.0532[/C][C]0.47887[/C][/ROW]
[ROW][C]59[/C][C]-0.109691[/C][C]-0.8497[/C][C]0.199444[/C][/ROW]
[ROW][C]60[/C][C]NA[/C][C]NA[/C][C]NA[/C][/ROW]
[/TABLE]
Source: https://freestatistics.org/blog/index.php?pk=35230&T=2

Globally Unique Identifier (entire table): ba.freestatistics.org/blog/index.php?pk=35230&T=2

As an alternative you can also use a QR Code:  

The GUIDs for individual cells are displayed in the table below:

Partial Autocorrelation Function
Time lag kPACF(k)T-STATP-value
10.9389487.27310
2-0.018171-0.14070.44427
3-0.081694-0.63280.264635
4-0.076165-0.590.278711
50.0212810.16480.434811
6-0.094686-0.73340.233074
7-0.041155-0.31880.3755
80.149181.15550.126224
9-0.046599-0.3610.3597
10-0.066874-0.5180.303181
11-0.025742-0.19940.421313
12-0.039195-0.30360.381241
130.0263240.20390.419559
14-0.078589-0.60880.272494
15-0.081326-0.62990.26556
160.0474760.36780.357176
17-0.023594-0.18280.427801
18-0.014262-0.11050.456201
190.0646390.50070.30921
20-0.06732-0.52150.301983
21-0.071915-0.55710.289782
22-0.038153-0.29550.384303
230.0472070.36570.357951
240.0483140.37420.354773
250.0231090.1790.42927
26-0.071012-0.55010.292161
27-0.103191-0.79930.21363
280.0360390.27920.390541
29-0.034307-0.26570.395674
300.0076660.05940.476422
31-0.050737-0.3930.347853
32-0.020369-0.15780.437582
33-0.054584-0.42280.336974
34-0.05689-0.44070.330519
35-0.05821-0.45090.326847
36-0.000942-0.00730.4971
370.0250360.19390.423444
38-0.034592-0.2680.394828
39-0.081575-0.63190.264933
40-0.028664-0.2220.412523
410.0431990.33460.36954
42-0.05397-0.41810.338701
43-0.004734-0.03670.485437
440.019880.1540.439066
450.0308740.23920.405901
460.0792720.6140.270755
470.0668960.51820.303122
48-0.011192-0.08670.465602
49-0.005577-0.04320.482844
50-0.019957-0.15460.438832
51-0.010121-0.07840.468888
52-0.091842-0.71140.239795
53-0.007303-0.05660.477539
540.1042990.80790.211172
55-0.032012-0.2480.402506
560.0053870.04170.483428
570.0220280.17060.432544
580.006870.05320.47887
59-0.109691-0.84970.199444
60NANANA


Parameters (Session):
par1 = 60 ; par2 = 1 ; par3 = 0 ; par4 = 0 ; par5 = 12 ;
Parameters (R input):
par1 = 60 ; par2 = 1 ; par3 = 0 ; par4 = 0 ; par5 = 12 ;
R code (references can be found in the software module):
if (par1 == 'Default') {
par1 = 10*log10(length(x))
} else {
par1 <- as.numeric(par1)
}
par2 <- as.numeric(par2)
par3 <- as.numeric(par3)
par4 <- as.numeric(par4)
par5 <- as.numeric(par5)
if (par2 == 0) {
x <- log(x)
} else {
x <- (x ^ par2 - 1) / par2
}
if (par3 > 0) x <- diff(x,lag=1,difference=par3)
if (par4 > 0) x <- diff(x,lag=par5,difference=par4)
bitmap(file='pic1.png')
racf <- acf(x,par1,main='Autocorrelation',xlab='lags',ylab='ACF')
dev.off()
bitmap(file='pic2.png')
rpacf <- pacf(x,par1,main='Partial Autocorrelation',xlab='lags',ylab='PACF')
dev.off()
(myacf <- c(racf$acf))
(mypacf <- c(rpacf$acf))
lengthx <- length(x)
sqrtn <- sqrt(lengthx)
load(file='createtable')
a<-table.start()
a<-table.row.start(a)
a<-table.element(a,'Autocorrelation Function',4,TRUE)
a<-table.row.end(a)
a<-table.row.start(a)
a<-table.element(a,'Time lag k',header=TRUE)
a<-table.element(a,hyperlink('basics.htm','ACF(k)','click here for more information about the Autocorrelation Function'),header=TRUE)
a<-table.element(a,'T-STAT',header=TRUE)
a<-table.element(a,'P-value',header=TRUE)
a<-table.row.end(a)
for (i in 2:(par1+1)) {
a<-table.row.start(a)
a<-table.element(a,i-1,header=TRUE)
a<-table.element(a,round(myacf[i],6))
mytstat <- myacf[i]*sqrtn
a<-table.element(a,round(mytstat,4))
a<-table.element(a,round(1-pt(abs(mytstat),lengthx),6))
a<-table.row.end(a)
}
a<-table.end(a)
table.save(a,file='mytable.tab')
a<-table.start()
a<-table.row.start(a)
a<-table.element(a,'Partial Autocorrelation Function',4,TRUE)
a<-table.row.end(a)
a<-table.row.start(a)
a<-table.element(a,'Time lag k',header=TRUE)
a<-table.element(a,hyperlink('basics.htm','PACF(k)','click here for more information about the Partial Autocorrelation Function'),header=TRUE)
a<-table.element(a,'T-STAT',header=TRUE)
a<-table.element(a,'P-value',header=TRUE)
a<-table.row.end(a)
for (i in 1:par1) {
a<-table.row.start(a)
a<-table.element(a,i,header=TRUE)
a<-table.element(a,round(mypacf[i],6))
mytstat <- mypacf[i]*sqrtn
a<-table.element(a,round(mytstat,4))
a<-table.element(a,round(1-pt(abs(mytstat),lengthx),6))
a<-table.row.end(a)
}
a<-table.end(a)
table.save(a,file='mytable1.tab')