Free Statistics

of Irreproducible Research!

Author's title

Author*The author of this computation has been verified*
R Software Modulerwasp_autocorrelation.wasp
Title produced by software(Partial) Autocorrelation Function
Date of computationFri, 19 Dec 2008 09:40:53 -0700
Cite this page as followsStatistical Computations at FreeStatistics.org, Office for Research Development and Education, URL https://freestatistics.org/blog/index.php?v=date/2008/Dec/19/t1229704953huli2do689vx2gq.htm/, Retrieved Wed, 15 May 2024 07:14:14 +0000
Statistical Computations at FreeStatistics.org, Office for Research Development and Education, URL https://freestatistics.org/blog/index.php?pk=35218, Retrieved Wed, 15 May 2024 07:14:14 +0000
QR Codes:

Original text written by user:
IsPrivate?No (this computation is public)
User-defined keywords
Estimated Impact163
Family? (F = Feedback message, R = changed R code, M = changed R Module, P = changed Parameters, D = changed Data)
-     [Univariate Data Series] [data set] [2008-12-01 19:54:57] [b98453cac15ba1066b407e146608df68]
F RMP   [(Partial) Autocorrelation Function] [ACF met alle juis...] [2008-12-07 12:01:48] [7a664918911e34206ce9d0436dd7c1c8]
-   PD    [(Partial) Autocorrelation Function] [Paper - Autocorre...] [2008-12-12 14:38:21] [7a664918911e34206ce9d0436dd7c1c8]
-   P         [(Partial) Autocorrelation Function] [Paper - autocorre...] [2008-12-19 16:40:53] [98255691c21504803b38711776845ae0] [Current]
Feedback Forum

Post a new message
Dataseries X:
14929387.5
14717825.3
15826281.2
16301309.6
15033016.9
16998460.6
14066462.7
13328937.3
17319718.2
17586426.8
15887037.4
17935679.1
15869489
15892510.9
17556558.1
16791643
15953688.5
18144913.6
14390881
13885708.7
17332571.5
17152595.8
16003877.1
16841467.1
14783398.1
14667847.5
17714362.2
16282088
15014866.2
17722582.4
13876509.4
15495489.6
17799521.1
17920079.1
17248022.4
18813782.4
16249688.3
17823358.5
20424438.3
17814218.7
19699959.6
19776328.1
15679833.1
17119266.5
20092613
20863688.3
20925203.1
21032593
20664684.3
19711511.4
22553293.4
19498332.9
20722827.8
21321275
17960847.7
17789654.9
20003708.5
21169851.7
20422839.4
19810562.3


Summary of computational transaction
Raw Inputview raw input (R code)
Raw Outputview raw output of R engine
Computing time2 seconds
R Server'Gwilym Jenkins' @ 72.249.127.135

\begin{tabular}{lllllllll}
\hline
Summary of computational transaction \tabularnewline
Raw Input & view raw input (R code)  \tabularnewline
Raw Output & view raw output of R engine  \tabularnewline
Computing time & 2 seconds \tabularnewline
R Server & 'Gwilym Jenkins' @ 72.249.127.135 \tabularnewline
\hline
\end{tabular}
%Source: https://freestatistics.org/blog/index.php?pk=35218&T=0

[TABLE]
[ROW][C]Summary of computational transaction[/C][/ROW]
[ROW][C]Raw Input[/C][C]view raw input (R code) [/C][/ROW]
[ROW][C]Raw Output[/C][C]view raw output of R engine [/C][/ROW]
[ROW][C]Computing time[/C][C]2 seconds[/C][/ROW]
[ROW][C]R Server[/C][C]'Gwilym Jenkins' @ 72.249.127.135[/C][/ROW]
[/TABLE]
Source: https://freestatistics.org/blog/index.php?pk=35218&T=0

Globally Unique Identifier (entire table): ba.freestatistics.org/blog/index.php?pk=35218&T=0

As an alternative you can also use a QR Code:  

The GUIDs for individual cells are displayed in the table below:

Summary of computational transaction
Raw Inputview raw input (R code)
Raw Outputview raw output of R engine
Computing time2 seconds
R Server'Gwilym Jenkins' @ 72.249.127.135


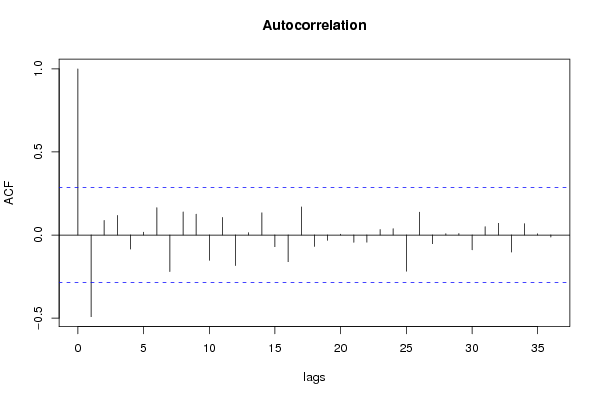
Autocorrelation Function
Time lag kACF(k)T-STATP-value
1-0.491762-3.37140.000752
20.0877850.60180.275091
30.1179160.80840.21147
4-0.084371-0.57840.282872
50.0170760.11710.453653
60.164321.12650.132832
7-0.220537-1.51190.068624
80.1390840.95350.172605
90.1250320.85720.197849
10-0.152775-1.04740.150142
110.1060570.72710.235388
12-0.183936-1.2610.106766
130.0139640.09570.462071
140.1337980.91730.181841
15-0.070053-0.48030.316636
16-0.161076-1.10430.137546
170.1686751.15640.126686
18-0.068549-0.46990.320282
19-0.032375-0.22190.412657
200.0047990.03290.486946
21-0.044333-0.30390.38126
22-0.043308-0.29690.383924
230.0324820.22270.412373
240.0379940.26050.397819
25-0.218-1.49450.07086
260.137660.94380.175062
27-0.052559-0.36030.360109
280.0079790.05470.478305
290.008270.05670.477513
30-0.089327-0.61240.271614
310.0499980.34280.366651
320.0707620.48510.314923
33-0.102569-0.70320.242708
340.0684490.46930.320525
350.006920.04740.481182
36-0.012651-0.08670.465627

\begin{tabular}{lllllllll}
\hline
Autocorrelation Function \tabularnewline
Time lag k & ACF(k) & T-STAT & P-value \tabularnewline
1 & -0.491762 & -3.3714 & 0.000752 \tabularnewline
2 & 0.087785 & 0.6018 & 0.275091 \tabularnewline
3 & 0.117916 & 0.8084 & 0.21147 \tabularnewline
4 & -0.084371 & -0.5784 & 0.282872 \tabularnewline
5 & 0.017076 & 0.1171 & 0.453653 \tabularnewline
6 & 0.16432 & 1.1265 & 0.132832 \tabularnewline
7 & -0.220537 & -1.5119 & 0.068624 \tabularnewline
8 & 0.139084 & 0.9535 & 0.172605 \tabularnewline
9 & 0.125032 & 0.8572 & 0.197849 \tabularnewline
10 & -0.152775 & -1.0474 & 0.150142 \tabularnewline
11 & 0.106057 & 0.7271 & 0.235388 \tabularnewline
12 & -0.183936 & -1.261 & 0.106766 \tabularnewline
13 & 0.013964 & 0.0957 & 0.462071 \tabularnewline
14 & 0.133798 & 0.9173 & 0.181841 \tabularnewline
15 & -0.070053 & -0.4803 & 0.316636 \tabularnewline
16 & -0.161076 & -1.1043 & 0.137546 \tabularnewline
17 & 0.168675 & 1.1564 & 0.126686 \tabularnewline
18 & -0.068549 & -0.4699 & 0.320282 \tabularnewline
19 & -0.032375 & -0.2219 & 0.412657 \tabularnewline
20 & 0.004799 & 0.0329 & 0.486946 \tabularnewline
21 & -0.044333 & -0.3039 & 0.38126 \tabularnewline
22 & -0.043308 & -0.2969 & 0.383924 \tabularnewline
23 & 0.032482 & 0.2227 & 0.412373 \tabularnewline
24 & 0.037994 & 0.2605 & 0.397819 \tabularnewline
25 & -0.218 & -1.4945 & 0.07086 \tabularnewline
26 & 0.13766 & 0.9438 & 0.175062 \tabularnewline
27 & -0.052559 & -0.3603 & 0.360109 \tabularnewline
28 & 0.007979 & 0.0547 & 0.478305 \tabularnewline
29 & 0.00827 & 0.0567 & 0.477513 \tabularnewline
30 & -0.089327 & -0.6124 & 0.271614 \tabularnewline
31 & 0.049998 & 0.3428 & 0.366651 \tabularnewline
32 & 0.070762 & 0.4851 & 0.314923 \tabularnewline
33 & -0.102569 & -0.7032 & 0.242708 \tabularnewline
34 & 0.068449 & 0.4693 & 0.320525 \tabularnewline
35 & 0.00692 & 0.0474 & 0.481182 \tabularnewline
36 & -0.012651 & -0.0867 & 0.465627 \tabularnewline
\hline
\end{tabular}
%Source: https://freestatistics.org/blog/index.php?pk=35218&T=1

[TABLE]
[ROW][C]Autocorrelation Function[/C][/ROW]
[ROW][C]Time lag k[/C][C]ACF(k)[/C][C]T-STAT[/C][C]P-value[/C][/ROW]
[ROW][C]1[/C][C]-0.491762[/C][C]-3.3714[/C][C]0.000752[/C][/ROW]
[ROW][C]2[/C][C]0.087785[/C][C]0.6018[/C][C]0.275091[/C][/ROW]
[ROW][C]3[/C][C]0.117916[/C][C]0.8084[/C][C]0.21147[/C][/ROW]
[ROW][C]4[/C][C]-0.084371[/C][C]-0.5784[/C][C]0.282872[/C][/ROW]
[ROW][C]5[/C][C]0.017076[/C][C]0.1171[/C][C]0.453653[/C][/ROW]
[ROW][C]6[/C][C]0.16432[/C][C]1.1265[/C][C]0.132832[/C][/ROW]
[ROW][C]7[/C][C]-0.220537[/C][C]-1.5119[/C][C]0.068624[/C][/ROW]
[ROW][C]8[/C][C]0.139084[/C][C]0.9535[/C][C]0.172605[/C][/ROW]
[ROW][C]9[/C][C]0.125032[/C][C]0.8572[/C][C]0.197849[/C][/ROW]
[ROW][C]10[/C][C]-0.152775[/C][C]-1.0474[/C][C]0.150142[/C][/ROW]
[ROW][C]11[/C][C]0.106057[/C][C]0.7271[/C][C]0.235388[/C][/ROW]
[ROW][C]12[/C][C]-0.183936[/C][C]-1.261[/C][C]0.106766[/C][/ROW]
[ROW][C]13[/C][C]0.013964[/C][C]0.0957[/C][C]0.462071[/C][/ROW]
[ROW][C]14[/C][C]0.133798[/C][C]0.9173[/C][C]0.181841[/C][/ROW]
[ROW][C]15[/C][C]-0.070053[/C][C]-0.4803[/C][C]0.316636[/C][/ROW]
[ROW][C]16[/C][C]-0.161076[/C][C]-1.1043[/C][C]0.137546[/C][/ROW]
[ROW][C]17[/C][C]0.168675[/C][C]1.1564[/C][C]0.126686[/C][/ROW]
[ROW][C]18[/C][C]-0.068549[/C][C]-0.4699[/C][C]0.320282[/C][/ROW]
[ROW][C]19[/C][C]-0.032375[/C][C]-0.2219[/C][C]0.412657[/C][/ROW]
[ROW][C]20[/C][C]0.004799[/C][C]0.0329[/C][C]0.486946[/C][/ROW]
[ROW][C]21[/C][C]-0.044333[/C][C]-0.3039[/C][C]0.38126[/C][/ROW]
[ROW][C]22[/C][C]-0.043308[/C][C]-0.2969[/C][C]0.383924[/C][/ROW]
[ROW][C]23[/C][C]0.032482[/C][C]0.2227[/C][C]0.412373[/C][/ROW]
[ROW][C]24[/C][C]0.037994[/C][C]0.2605[/C][C]0.397819[/C][/ROW]
[ROW][C]25[/C][C]-0.218[/C][C]-1.4945[/C][C]0.07086[/C][/ROW]
[ROW][C]26[/C][C]0.13766[/C][C]0.9438[/C][C]0.175062[/C][/ROW]
[ROW][C]27[/C][C]-0.052559[/C][C]-0.3603[/C][C]0.360109[/C][/ROW]
[ROW][C]28[/C][C]0.007979[/C][C]0.0547[/C][C]0.478305[/C][/ROW]
[ROW][C]29[/C][C]0.00827[/C][C]0.0567[/C][C]0.477513[/C][/ROW]
[ROW][C]30[/C][C]-0.089327[/C][C]-0.6124[/C][C]0.271614[/C][/ROW]
[ROW][C]31[/C][C]0.049998[/C][C]0.3428[/C][C]0.366651[/C][/ROW]
[ROW][C]32[/C][C]0.070762[/C][C]0.4851[/C][C]0.314923[/C][/ROW]
[ROW][C]33[/C][C]-0.102569[/C][C]-0.7032[/C][C]0.242708[/C][/ROW]
[ROW][C]34[/C][C]0.068449[/C][C]0.4693[/C][C]0.320525[/C][/ROW]
[ROW][C]35[/C][C]0.00692[/C][C]0.0474[/C][C]0.481182[/C][/ROW]
[ROW][C]36[/C][C]-0.012651[/C][C]-0.0867[/C][C]0.465627[/C][/ROW]
[/TABLE]
Source: https://freestatistics.org/blog/index.php?pk=35218&T=1

Globally Unique Identifier (entire table): ba.freestatistics.org/blog/index.php?pk=35218&T=1

As an alternative you can also use a QR Code:  

The GUIDs for individual cells are displayed in the table below:

Autocorrelation Function
Time lag kACF(k)T-STATP-value
1-0.491762-3.37140.000752
20.0877850.60180.275091
30.1179160.80840.21147
4-0.084371-0.57840.282872
50.0170760.11710.453653
60.164321.12650.132832
7-0.220537-1.51190.068624
80.1390840.95350.172605
90.1250320.85720.197849
10-0.152775-1.04740.150142
110.1060570.72710.235388
12-0.183936-1.2610.106766
130.0139640.09570.462071
140.1337980.91730.181841
15-0.070053-0.48030.316636
16-0.161076-1.10430.137546
170.1686751.15640.126686
18-0.068549-0.46990.320282
19-0.032375-0.22190.412657
200.0047990.03290.486946
21-0.044333-0.30390.38126
22-0.043308-0.29690.383924
230.0324820.22270.412373
240.0379940.26050.397819
25-0.218-1.49450.07086
260.137660.94380.175062
27-0.052559-0.36030.360109
280.0079790.05470.478305
290.008270.05670.477513
30-0.089327-0.61240.271614
310.0499980.34280.366651
320.0707620.48510.314923
33-0.102569-0.70320.242708
340.0684490.46930.320525
350.006920.04740.481182
36-0.012651-0.08670.465627


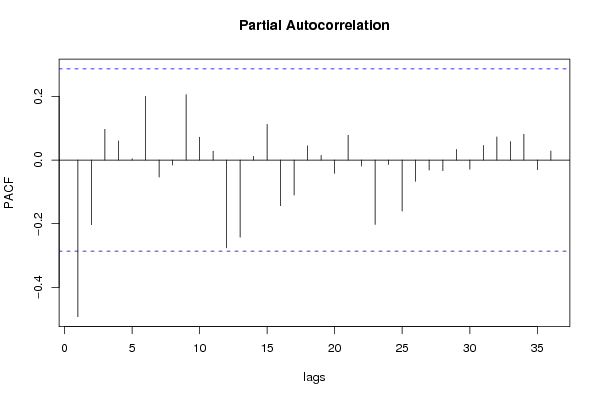
Partial Autocorrelation Function
Time lag kPACF(k)T-STATP-value
1-0.491762-3.37140.000752
2-0.20318-1.39290.085097
30.0962210.65970.256347
40.0600550.41170.341209
50.0036190.02480.490155
60.1998821.37030.088549
7-0.05335-0.36570.358097
8-0.015385-0.10550.458225
90.2049851.40530.083253
100.0716960.49150.312671
110.0276860.18980.425141
12-0.275757-1.89050.032433
13-0.242386-1.66170.051613
140.0117310.08040.468122
150.1119070.76720.223402
16-0.143331-0.98260.16541
17-0.109599-0.75140.228086
180.0446340.3060.380479
190.014370.09850.46097
20-0.041681-0.28580.388162
210.0776160.53210.298578
22-0.018866-0.12930.44882
23-0.202327-1.38710.08598
24-0.014393-0.09870.460908
25-0.16044-1.09990.138485
26-0.066965-0.45910.324143
27-0.031427-0.21550.415173
28-0.033552-0.230.409536
290.0331640.22740.410566
30-0.028694-0.19670.42245
310.0456780.31320.377775
320.072620.49790.310452
330.0578980.39690.346607
340.0812410.5570.290098
35-0.030512-0.20920.417607
360.0285860.1960.422737

\begin{tabular}{lllllllll}
\hline
Partial Autocorrelation Function \tabularnewline
Time lag k & PACF(k) & T-STAT & P-value \tabularnewline
1 & -0.491762 & -3.3714 & 0.000752 \tabularnewline
2 & -0.20318 & -1.3929 & 0.085097 \tabularnewline
3 & 0.096221 & 0.6597 & 0.256347 \tabularnewline
4 & 0.060055 & 0.4117 & 0.341209 \tabularnewline
5 & 0.003619 & 0.0248 & 0.490155 \tabularnewline
6 & 0.199882 & 1.3703 & 0.088549 \tabularnewline
7 & -0.05335 & -0.3657 & 0.358097 \tabularnewline
8 & -0.015385 & -0.1055 & 0.458225 \tabularnewline
9 & 0.204985 & 1.4053 & 0.083253 \tabularnewline
10 & 0.071696 & 0.4915 & 0.312671 \tabularnewline
11 & 0.027686 & 0.1898 & 0.425141 \tabularnewline
12 & -0.275757 & -1.8905 & 0.032433 \tabularnewline
13 & -0.242386 & -1.6617 & 0.051613 \tabularnewline
14 & 0.011731 & 0.0804 & 0.468122 \tabularnewline
15 & 0.111907 & 0.7672 & 0.223402 \tabularnewline
16 & -0.143331 & -0.9826 & 0.16541 \tabularnewline
17 & -0.109599 & -0.7514 & 0.228086 \tabularnewline
18 & 0.044634 & 0.306 & 0.380479 \tabularnewline
19 & 0.01437 & 0.0985 & 0.46097 \tabularnewline
20 & -0.041681 & -0.2858 & 0.388162 \tabularnewline
21 & 0.077616 & 0.5321 & 0.298578 \tabularnewline
22 & -0.018866 & -0.1293 & 0.44882 \tabularnewline
23 & -0.202327 & -1.3871 & 0.08598 \tabularnewline
24 & -0.014393 & -0.0987 & 0.460908 \tabularnewline
25 & -0.16044 & -1.0999 & 0.138485 \tabularnewline
26 & -0.066965 & -0.4591 & 0.324143 \tabularnewline
27 & -0.031427 & -0.2155 & 0.415173 \tabularnewline
28 & -0.033552 & -0.23 & 0.409536 \tabularnewline
29 & 0.033164 & 0.2274 & 0.410566 \tabularnewline
30 & -0.028694 & -0.1967 & 0.42245 \tabularnewline
31 & 0.045678 & 0.3132 & 0.377775 \tabularnewline
32 & 0.07262 & 0.4979 & 0.310452 \tabularnewline
33 & 0.057898 & 0.3969 & 0.346607 \tabularnewline
34 & 0.081241 & 0.557 & 0.290098 \tabularnewline
35 & -0.030512 & -0.2092 & 0.417607 \tabularnewline
36 & 0.028586 & 0.196 & 0.422737 \tabularnewline
\hline
\end{tabular}
%Source: https://freestatistics.org/blog/index.php?pk=35218&T=2

[TABLE]
[ROW][C]Partial Autocorrelation Function[/C][/ROW]
[ROW][C]Time lag k[/C][C]PACF(k)[/C][C]T-STAT[/C][C]P-value[/C][/ROW]
[ROW][C]1[/C][C]-0.491762[/C][C]-3.3714[/C][C]0.000752[/C][/ROW]
[ROW][C]2[/C][C]-0.20318[/C][C]-1.3929[/C][C]0.085097[/C][/ROW]
[ROW][C]3[/C][C]0.096221[/C][C]0.6597[/C][C]0.256347[/C][/ROW]
[ROW][C]4[/C][C]0.060055[/C][C]0.4117[/C][C]0.341209[/C][/ROW]
[ROW][C]5[/C][C]0.003619[/C][C]0.0248[/C][C]0.490155[/C][/ROW]
[ROW][C]6[/C][C]0.199882[/C][C]1.3703[/C][C]0.088549[/C][/ROW]
[ROW][C]7[/C][C]-0.05335[/C][C]-0.3657[/C][C]0.358097[/C][/ROW]
[ROW][C]8[/C][C]-0.015385[/C][C]-0.1055[/C][C]0.458225[/C][/ROW]
[ROW][C]9[/C][C]0.204985[/C][C]1.4053[/C][C]0.083253[/C][/ROW]
[ROW][C]10[/C][C]0.071696[/C][C]0.4915[/C][C]0.312671[/C][/ROW]
[ROW][C]11[/C][C]0.027686[/C][C]0.1898[/C][C]0.425141[/C][/ROW]
[ROW][C]12[/C][C]-0.275757[/C][C]-1.8905[/C][C]0.032433[/C][/ROW]
[ROW][C]13[/C][C]-0.242386[/C][C]-1.6617[/C][C]0.051613[/C][/ROW]
[ROW][C]14[/C][C]0.011731[/C][C]0.0804[/C][C]0.468122[/C][/ROW]
[ROW][C]15[/C][C]0.111907[/C][C]0.7672[/C][C]0.223402[/C][/ROW]
[ROW][C]16[/C][C]-0.143331[/C][C]-0.9826[/C][C]0.16541[/C][/ROW]
[ROW][C]17[/C][C]-0.109599[/C][C]-0.7514[/C][C]0.228086[/C][/ROW]
[ROW][C]18[/C][C]0.044634[/C][C]0.306[/C][C]0.380479[/C][/ROW]
[ROW][C]19[/C][C]0.01437[/C][C]0.0985[/C][C]0.46097[/C][/ROW]
[ROW][C]20[/C][C]-0.041681[/C][C]-0.2858[/C][C]0.388162[/C][/ROW]
[ROW][C]21[/C][C]0.077616[/C][C]0.5321[/C][C]0.298578[/C][/ROW]
[ROW][C]22[/C][C]-0.018866[/C][C]-0.1293[/C][C]0.44882[/C][/ROW]
[ROW][C]23[/C][C]-0.202327[/C][C]-1.3871[/C][C]0.08598[/C][/ROW]
[ROW][C]24[/C][C]-0.014393[/C][C]-0.0987[/C][C]0.460908[/C][/ROW]
[ROW][C]25[/C][C]-0.16044[/C][C]-1.0999[/C][C]0.138485[/C][/ROW]
[ROW][C]26[/C][C]-0.066965[/C][C]-0.4591[/C][C]0.324143[/C][/ROW]
[ROW][C]27[/C][C]-0.031427[/C][C]-0.2155[/C][C]0.415173[/C][/ROW]
[ROW][C]28[/C][C]-0.033552[/C][C]-0.23[/C][C]0.409536[/C][/ROW]
[ROW][C]29[/C][C]0.033164[/C][C]0.2274[/C][C]0.410566[/C][/ROW]
[ROW][C]30[/C][C]-0.028694[/C][C]-0.1967[/C][C]0.42245[/C][/ROW]
[ROW][C]31[/C][C]0.045678[/C][C]0.3132[/C][C]0.377775[/C][/ROW]
[ROW][C]32[/C][C]0.07262[/C][C]0.4979[/C][C]0.310452[/C][/ROW]
[ROW][C]33[/C][C]0.057898[/C][C]0.3969[/C][C]0.346607[/C][/ROW]
[ROW][C]34[/C][C]0.081241[/C][C]0.557[/C][C]0.290098[/C][/ROW]
[ROW][C]35[/C][C]-0.030512[/C][C]-0.2092[/C][C]0.417607[/C][/ROW]
[ROW][C]36[/C][C]0.028586[/C][C]0.196[/C][C]0.422737[/C][/ROW]
[/TABLE]
Source: https://freestatistics.org/blog/index.php?pk=35218&T=2

Globally Unique Identifier (entire table): ba.freestatistics.org/blog/index.php?pk=35218&T=2

As an alternative you can also use a QR Code:  

The GUIDs for individual cells are displayed in the table below:

Partial Autocorrelation Function
Time lag kPACF(k)T-STATP-value
1-0.491762-3.37140.000752
2-0.20318-1.39290.085097
30.0962210.65970.256347
40.0600550.41170.341209
50.0036190.02480.490155
60.1998821.37030.088549
7-0.05335-0.36570.358097
8-0.015385-0.10550.458225
90.2049851.40530.083253
100.0716960.49150.312671
110.0276860.18980.425141
12-0.275757-1.89050.032433
13-0.242386-1.66170.051613
140.0117310.08040.468122
150.1119070.76720.223402
16-0.143331-0.98260.16541
17-0.109599-0.75140.228086
180.0446340.3060.380479
190.014370.09850.46097
20-0.041681-0.28580.388162
210.0776160.53210.298578
22-0.018866-0.12930.44882
23-0.202327-1.38710.08598
24-0.014393-0.09870.460908
25-0.16044-1.09990.138485
26-0.066965-0.45910.324143
27-0.031427-0.21550.415173
28-0.033552-0.230.409536
290.0331640.22740.410566
30-0.028694-0.19670.42245
310.0456780.31320.377775
320.072620.49790.310452
330.0578980.39690.346607
340.0812410.5570.290098
35-0.030512-0.20920.417607
360.0285860.1960.422737


Parameters (Session):
par1 = 36 ; par2 = 1.0 ; par3 = 1 ; par4 = 1 ; par5 = 12 ;
Parameters (R input):
par1 = 36 ; par2 = 1.0 ; par3 = 1 ; par4 = 1 ; par5 = 12 ;
R code (references can be found in the software module):
if (par1 == 'Default') {
par1 = 10*log10(length(x))
} else {
par1 <- as.numeric(par1)
}
par2 <- as.numeric(par2)
par3 <- as.numeric(par3)
par4 <- as.numeric(par4)
par5 <- as.numeric(par5)
if (par2 == 0) {
x <- log(x)
} else {
x <- (x ^ par2 - 1) / par2
}
if (par3 > 0) x <- diff(x,lag=1,difference=par3)
if (par4 > 0) x <- diff(x,lag=par5,difference=par4)
bitmap(file='pic1.png')
racf <- acf(x,par1,main='Autocorrelation',xlab='lags',ylab='ACF')
dev.off()
bitmap(file='pic2.png')
rpacf <- pacf(x,par1,main='Partial Autocorrelation',xlab='lags',ylab='PACF')
dev.off()
(myacf <- c(racf$acf))
(mypacf <- c(rpacf$acf))
lengthx <- length(x)
sqrtn <- sqrt(lengthx)
load(file='createtable')
a<-table.start()
a<-table.row.start(a)
a<-table.element(a,'Autocorrelation Function',4,TRUE)
a<-table.row.end(a)
a<-table.row.start(a)
a<-table.element(a,'Time lag k',header=TRUE)
a<-table.element(a,hyperlink('basics.htm','ACF(k)','click here for more information about the Autocorrelation Function'),header=TRUE)
a<-table.element(a,'T-STAT',header=TRUE)
a<-table.element(a,'P-value',header=TRUE)
a<-table.row.end(a)
for (i in 2:(par1+1)) {
a<-table.row.start(a)
a<-table.element(a,i-1,header=TRUE)
a<-table.element(a,round(myacf[i],6))
mytstat <- myacf[i]*sqrtn
a<-table.element(a,round(mytstat,4))
a<-table.element(a,round(1-pt(abs(mytstat),lengthx),6))
a<-table.row.end(a)
}
a<-table.end(a)
table.save(a,file='mytable.tab')
a<-table.start()
a<-table.row.start(a)
a<-table.element(a,'Partial Autocorrelation Function',4,TRUE)
a<-table.row.end(a)
a<-table.row.start(a)
a<-table.element(a,'Time lag k',header=TRUE)
a<-table.element(a,hyperlink('basics.htm','PACF(k)','click here for more information about the Partial Autocorrelation Function'),header=TRUE)
a<-table.element(a,'T-STAT',header=TRUE)
a<-table.element(a,'P-value',header=TRUE)
a<-table.row.end(a)
for (i in 1:par1) {
a<-table.row.start(a)
a<-table.element(a,i,header=TRUE)
a<-table.element(a,round(mypacf[i],6))
mytstat <- mypacf[i]*sqrtn
a<-table.element(a,round(mytstat,4))
a<-table.element(a,round(1-pt(abs(mytstat),lengthx),6))
a<-table.row.end(a)
}
a<-table.end(a)
table.save(a,file='mytable1.tab')