Free Statistics

of Irreproducible Research!

Author's title

Author*The author of this computation has been verified*
R Software Modulerwasp_autocorrelation.wasp
Title produced by software(Partial) Autocorrelation Function
Date of computationFri, 19 Dec 2008 09:03:40 -0700
Cite this page as followsStatistical Computations at FreeStatistics.org, Office for Research Development and Education, URL https://freestatistics.org/blog/index.php?v=date/2008/Dec/19/t1229702672qg9l1ziyyycmv8k.htm/, Retrieved Wed, 15 May 2024 00:13:21 +0000
Statistical Computations at FreeStatistics.org, Office for Research Development and Education, URL https://freestatistics.org/blog/index.php?pk=35204, Retrieved Wed, 15 May 2024 00:13:21 +0000
QR Codes:

Original text written by user:
IsPrivate?No (this computation is public)
User-defined keywords
Estimated Impact242
Family? (F = Feedback message, R = changed R code, M = changed R Module, P = changed Parameters, D = changed Data)
-     [(Partial) Autocorrelation Function] [(P)ACF omzet] [2008-12-17 19:57:22] [5161246d1ccc1b670cc664d03050f084]
-   PD    [(Partial) Autocorrelation Function] [paper: (p)acf omzet] [2008-12-19 16:03:40] [366411ff82333cf2a466cacd3525c11d] [Current]
Feedback Forum

Post a new message
Dataseries X:
124.1
110.7
128.1
108.9
111.2
131.9
120.5
115.4
130.8
112.6
111.1
129.5
131.8
127.7
142.6
115.8
119.5
139.8
130.6
126.2
141.7
118.9
120.3
141.2
138.9
141.3
153.7
131
136.5
160.1
139.8
143.8
155.8
131
131.8
151.7
153.8
152.9
156.1
147.2
145.7
165.3
147.4
154.4
165.3
145.2
139.7
158.4
169.1
162.1
166.2
157.2
161.4
169
171.8
161.4
175.7
164.7
146.1
173


Summary of computational transaction
Raw Inputview raw input (R code)
Raw Outputview raw output of R engine
Computing time3 seconds
R Server'Herman Ole Andreas Wold' @ 193.190.124.10:1001

\begin{tabular}{lllllllll}
\hline
Summary of computational transaction \tabularnewline
Raw Input & view raw input (R code)  \tabularnewline
Raw Output & view raw output of R engine  \tabularnewline
Computing time & 3 seconds \tabularnewline
R Server & 'Herman Ole Andreas Wold' @ 193.190.124.10:1001 \tabularnewline
\hline
\end{tabular}
%Source: https://freestatistics.org/blog/index.php?pk=35204&T=0

[TABLE]
[ROW][C]Summary of computational transaction[/C][/ROW]
[ROW][C]Raw Input[/C][C]view raw input (R code) [/C][/ROW]
[ROW][C]Raw Output[/C][C]view raw output of R engine [/C][/ROW]
[ROW][C]Computing time[/C][C]3 seconds[/C][/ROW]
[ROW][C]R Server[/C][C]'Herman Ole Andreas Wold' @ 193.190.124.10:1001[/C][/ROW]
[/TABLE]
Source: https://freestatistics.org/blog/index.php?pk=35204&T=0

Globally Unique Identifier (entire table): ba.freestatistics.org/blog/index.php?pk=35204&T=0

As an alternative you can also use a QR Code:  

The GUIDs for individual cells are displayed in the table below:

Summary of computational transaction
Raw Inputview raw input (R code)
Raw Outputview raw output of R engine
Computing time3 seconds
R Server'Herman Ole Andreas Wold' @ 193.190.124.10:1001


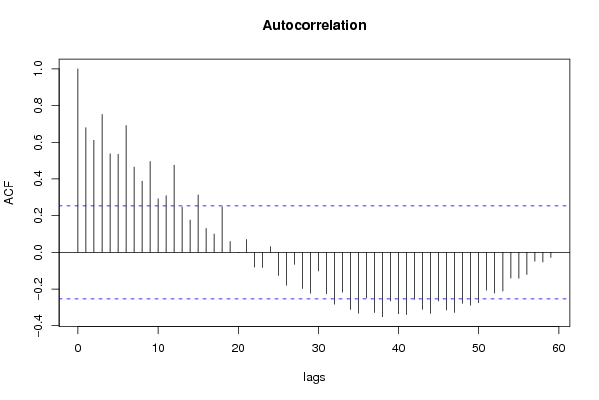
Autocorrelation Function
Time lag kACF(k)T-STATP-value
10.6797735.26551e-06
20.6106254.72997e-06
30.7516885.82260
40.5370764.16025.1e-05
50.5346664.14155.5e-05
60.6910725.3531e-06
70.4650983.60260.00032
80.3881563.00660.001927
90.4952243.8360.000151
100.2919812.26170.013677
110.3091112.39440.009895
120.4749823.67920.000251
130.2466541.91060.030421
140.176211.36490.088688
150.3130782.42510.009166
160.1301281.0080.158759
170.0999270.7740.220975
180.2486091.92570.029441
190.0586860.45460.325527
20-0.00205-0.01590.493692
210.0704630.54580.293612
22-0.080077-0.62030.268713
23-0.082388-0.63820.262894
240.0316670.24530.403535
25-0.126088-0.97670.166326
26-0.179101-1.38730.08524
27-0.065103-0.50430.307953
28-0.197516-1.530.065642
29-0.222444-1.7230.045016
30-0.101537-0.78650.217334
31-0.225107-1.74370.043169
32-0.282521-2.18840.016272
33-0.217216-1.68250.04883
34-0.311114-2.40990.009521
35-0.331559-2.56820.006364
36-0.247818-1.91960.029834
37-0.328665-2.54580.006744
38-0.350638-2.7160.004309
39-0.264741-2.05070.022337
40-0.334348-2.58980.006017
41-0.339522-2.62990.005417
42-0.255587-1.97980.026161
43-0.310483-2.4050.009637
44-0.333008-2.57950.006182
45-0.265049-2.05310.022217
46-0.313951-2.43190.009012
47-0.32761-2.53770.006888
48-0.277671-2.15080.017764
49-0.288242-2.23270.014656
50-0.274281-2.12460.018876
51-0.20666-1.60080.057339
52-0.221991-1.71950.045336
53-0.210912-1.63370.053777
54-0.140333-1.0870.140689
55-0.140824-1.09080.139856
56-0.120164-0.93080.177846
57-0.048421-0.37510.354467
58-0.052371-0.40570.343215
59-0.027765-0.21510.415222
60NANANA

\begin{tabular}{lllllllll}
\hline
Autocorrelation Function \tabularnewline
Time lag k & ACF(k) & T-STAT & P-value \tabularnewline
1 & 0.679773 & 5.2655 & 1e-06 \tabularnewline
2 & 0.610625 & 4.7299 & 7e-06 \tabularnewline
3 & 0.751688 & 5.8226 & 0 \tabularnewline
4 & 0.537076 & 4.1602 & 5.1e-05 \tabularnewline
5 & 0.534666 & 4.1415 & 5.5e-05 \tabularnewline
6 & 0.691072 & 5.353 & 1e-06 \tabularnewline
7 & 0.465098 & 3.6026 & 0.00032 \tabularnewline
8 & 0.388156 & 3.0066 & 0.001927 \tabularnewline
9 & 0.495224 & 3.836 & 0.000151 \tabularnewline
10 & 0.291981 & 2.2617 & 0.013677 \tabularnewline
11 & 0.309111 & 2.3944 & 0.009895 \tabularnewline
12 & 0.474982 & 3.6792 & 0.000251 \tabularnewline
13 & 0.246654 & 1.9106 & 0.030421 \tabularnewline
14 & 0.17621 & 1.3649 & 0.088688 \tabularnewline
15 & 0.313078 & 2.4251 & 0.009166 \tabularnewline
16 & 0.130128 & 1.008 & 0.158759 \tabularnewline
17 & 0.099927 & 0.774 & 0.220975 \tabularnewline
18 & 0.248609 & 1.9257 & 0.029441 \tabularnewline
19 & 0.058686 & 0.4546 & 0.325527 \tabularnewline
20 & -0.00205 & -0.0159 & 0.493692 \tabularnewline
21 & 0.070463 & 0.5458 & 0.293612 \tabularnewline
22 & -0.080077 & -0.6203 & 0.268713 \tabularnewline
23 & -0.082388 & -0.6382 & 0.262894 \tabularnewline
24 & 0.031667 & 0.2453 & 0.403535 \tabularnewline
25 & -0.126088 & -0.9767 & 0.166326 \tabularnewline
26 & -0.179101 & -1.3873 & 0.08524 \tabularnewline
27 & -0.065103 & -0.5043 & 0.307953 \tabularnewline
28 & -0.197516 & -1.53 & 0.065642 \tabularnewline
29 & -0.222444 & -1.723 & 0.045016 \tabularnewline
30 & -0.101537 & -0.7865 & 0.217334 \tabularnewline
31 & -0.225107 & -1.7437 & 0.043169 \tabularnewline
32 & -0.282521 & -2.1884 & 0.016272 \tabularnewline
33 & -0.217216 & -1.6825 & 0.04883 \tabularnewline
34 & -0.311114 & -2.4099 & 0.009521 \tabularnewline
35 & -0.331559 & -2.5682 & 0.006364 \tabularnewline
36 & -0.247818 & -1.9196 & 0.029834 \tabularnewline
37 & -0.328665 & -2.5458 & 0.006744 \tabularnewline
38 & -0.350638 & -2.716 & 0.004309 \tabularnewline
39 & -0.264741 & -2.0507 & 0.022337 \tabularnewline
40 & -0.334348 & -2.5898 & 0.006017 \tabularnewline
41 & -0.339522 & -2.6299 & 0.005417 \tabularnewline
42 & -0.255587 & -1.9798 & 0.026161 \tabularnewline
43 & -0.310483 & -2.405 & 0.009637 \tabularnewline
44 & -0.333008 & -2.5795 & 0.006182 \tabularnewline
45 & -0.265049 & -2.0531 & 0.022217 \tabularnewline
46 & -0.313951 & -2.4319 & 0.009012 \tabularnewline
47 & -0.32761 & -2.5377 & 0.006888 \tabularnewline
48 & -0.277671 & -2.1508 & 0.017764 \tabularnewline
49 & -0.288242 & -2.2327 & 0.014656 \tabularnewline
50 & -0.274281 & -2.1246 & 0.018876 \tabularnewline
51 & -0.20666 & -1.6008 & 0.057339 \tabularnewline
52 & -0.221991 & -1.7195 & 0.045336 \tabularnewline
53 & -0.210912 & -1.6337 & 0.053777 \tabularnewline
54 & -0.140333 & -1.087 & 0.140689 \tabularnewline
55 & -0.140824 & -1.0908 & 0.139856 \tabularnewline
56 & -0.120164 & -0.9308 & 0.177846 \tabularnewline
57 & -0.048421 & -0.3751 & 0.354467 \tabularnewline
58 & -0.052371 & -0.4057 & 0.343215 \tabularnewline
59 & -0.027765 & -0.2151 & 0.415222 \tabularnewline
60 & NA & NA & NA \tabularnewline
\hline
\end{tabular}
%Source: https://freestatistics.org/blog/index.php?pk=35204&T=1

[TABLE]
[ROW][C]Autocorrelation Function[/C][/ROW]
[ROW][C]Time lag k[/C][C]ACF(k)[/C][C]T-STAT[/C][C]P-value[/C][/ROW]
[ROW][C]1[/C][C]0.679773[/C][C]5.2655[/C][C]1e-06[/C][/ROW]
[ROW][C]2[/C][C]0.610625[/C][C]4.7299[/C][C]7e-06[/C][/ROW]
[ROW][C]3[/C][C]0.751688[/C][C]5.8226[/C][C]0[/C][/ROW]
[ROW][C]4[/C][C]0.537076[/C][C]4.1602[/C][C]5.1e-05[/C][/ROW]
[ROW][C]5[/C][C]0.534666[/C][C]4.1415[/C][C]5.5e-05[/C][/ROW]
[ROW][C]6[/C][C]0.691072[/C][C]5.353[/C][C]1e-06[/C][/ROW]
[ROW][C]7[/C][C]0.465098[/C][C]3.6026[/C][C]0.00032[/C][/ROW]
[ROW][C]8[/C][C]0.388156[/C][C]3.0066[/C][C]0.001927[/C][/ROW]
[ROW][C]9[/C][C]0.495224[/C][C]3.836[/C][C]0.000151[/C][/ROW]
[ROW][C]10[/C][C]0.291981[/C][C]2.2617[/C][C]0.013677[/C][/ROW]
[ROW][C]11[/C][C]0.309111[/C][C]2.3944[/C][C]0.009895[/C][/ROW]
[ROW][C]12[/C][C]0.474982[/C][C]3.6792[/C][C]0.000251[/C][/ROW]
[ROW][C]13[/C][C]0.246654[/C][C]1.9106[/C][C]0.030421[/C][/ROW]
[ROW][C]14[/C][C]0.17621[/C][C]1.3649[/C][C]0.088688[/C][/ROW]
[ROW][C]15[/C][C]0.313078[/C][C]2.4251[/C][C]0.009166[/C][/ROW]
[ROW][C]16[/C][C]0.130128[/C][C]1.008[/C][C]0.158759[/C][/ROW]
[ROW][C]17[/C][C]0.099927[/C][C]0.774[/C][C]0.220975[/C][/ROW]
[ROW][C]18[/C][C]0.248609[/C][C]1.9257[/C][C]0.029441[/C][/ROW]
[ROW][C]19[/C][C]0.058686[/C][C]0.4546[/C][C]0.325527[/C][/ROW]
[ROW][C]20[/C][C]-0.00205[/C][C]-0.0159[/C][C]0.493692[/C][/ROW]
[ROW][C]21[/C][C]0.070463[/C][C]0.5458[/C][C]0.293612[/C][/ROW]
[ROW][C]22[/C][C]-0.080077[/C][C]-0.6203[/C][C]0.268713[/C][/ROW]
[ROW][C]23[/C][C]-0.082388[/C][C]-0.6382[/C][C]0.262894[/C][/ROW]
[ROW][C]24[/C][C]0.031667[/C][C]0.2453[/C][C]0.403535[/C][/ROW]
[ROW][C]25[/C][C]-0.126088[/C][C]-0.9767[/C][C]0.166326[/C][/ROW]
[ROW][C]26[/C][C]-0.179101[/C][C]-1.3873[/C][C]0.08524[/C][/ROW]
[ROW][C]27[/C][C]-0.065103[/C][C]-0.5043[/C][C]0.307953[/C][/ROW]
[ROW][C]28[/C][C]-0.197516[/C][C]-1.53[/C][C]0.065642[/C][/ROW]
[ROW][C]29[/C][C]-0.222444[/C][C]-1.723[/C][C]0.045016[/C][/ROW]
[ROW][C]30[/C][C]-0.101537[/C][C]-0.7865[/C][C]0.217334[/C][/ROW]
[ROW][C]31[/C][C]-0.225107[/C][C]-1.7437[/C][C]0.043169[/C][/ROW]
[ROW][C]32[/C][C]-0.282521[/C][C]-2.1884[/C][C]0.016272[/C][/ROW]
[ROW][C]33[/C][C]-0.217216[/C][C]-1.6825[/C][C]0.04883[/C][/ROW]
[ROW][C]34[/C][C]-0.311114[/C][C]-2.4099[/C][C]0.009521[/C][/ROW]
[ROW][C]35[/C][C]-0.331559[/C][C]-2.5682[/C][C]0.006364[/C][/ROW]
[ROW][C]36[/C][C]-0.247818[/C][C]-1.9196[/C][C]0.029834[/C][/ROW]
[ROW][C]37[/C][C]-0.328665[/C][C]-2.5458[/C][C]0.006744[/C][/ROW]
[ROW][C]38[/C][C]-0.350638[/C][C]-2.716[/C][C]0.004309[/C][/ROW]
[ROW][C]39[/C][C]-0.264741[/C][C]-2.0507[/C][C]0.022337[/C][/ROW]
[ROW][C]40[/C][C]-0.334348[/C][C]-2.5898[/C][C]0.006017[/C][/ROW]
[ROW][C]41[/C][C]-0.339522[/C][C]-2.6299[/C][C]0.005417[/C][/ROW]
[ROW][C]42[/C][C]-0.255587[/C][C]-1.9798[/C][C]0.026161[/C][/ROW]
[ROW][C]43[/C][C]-0.310483[/C][C]-2.405[/C][C]0.009637[/C][/ROW]
[ROW][C]44[/C][C]-0.333008[/C][C]-2.5795[/C][C]0.006182[/C][/ROW]
[ROW][C]45[/C][C]-0.265049[/C][C]-2.0531[/C][C]0.022217[/C][/ROW]
[ROW][C]46[/C][C]-0.313951[/C][C]-2.4319[/C][C]0.009012[/C][/ROW]
[ROW][C]47[/C][C]-0.32761[/C][C]-2.5377[/C][C]0.006888[/C][/ROW]
[ROW][C]48[/C][C]-0.277671[/C][C]-2.1508[/C][C]0.017764[/C][/ROW]
[ROW][C]49[/C][C]-0.288242[/C][C]-2.2327[/C][C]0.014656[/C][/ROW]
[ROW][C]50[/C][C]-0.274281[/C][C]-2.1246[/C][C]0.018876[/C][/ROW]
[ROW][C]51[/C][C]-0.20666[/C][C]-1.6008[/C][C]0.057339[/C][/ROW]
[ROW][C]52[/C][C]-0.221991[/C][C]-1.7195[/C][C]0.045336[/C][/ROW]
[ROW][C]53[/C][C]-0.210912[/C][C]-1.6337[/C][C]0.053777[/C][/ROW]
[ROW][C]54[/C][C]-0.140333[/C][C]-1.087[/C][C]0.140689[/C][/ROW]
[ROW][C]55[/C][C]-0.140824[/C][C]-1.0908[/C][C]0.139856[/C][/ROW]
[ROW][C]56[/C][C]-0.120164[/C][C]-0.9308[/C][C]0.177846[/C][/ROW]
[ROW][C]57[/C][C]-0.048421[/C][C]-0.3751[/C][C]0.354467[/C][/ROW]
[ROW][C]58[/C][C]-0.052371[/C][C]-0.4057[/C][C]0.343215[/C][/ROW]
[ROW][C]59[/C][C]-0.027765[/C][C]-0.2151[/C][C]0.415222[/C][/ROW]
[ROW][C]60[/C][C]NA[/C][C]NA[/C][C]NA[/C][/ROW]
[/TABLE]
Source: https://freestatistics.org/blog/index.php?pk=35204&T=1

Globally Unique Identifier (entire table): ba.freestatistics.org/blog/index.php?pk=35204&T=1

As an alternative you can also use a QR Code:  

The GUIDs for individual cells are displayed in the table below:

Autocorrelation Function
Time lag kACF(k)T-STATP-value
10.6797735.26551e-06
20.6106254.72997e-06
30.7516885.82260
40.5370764.16025.1e-05
50.5346664.14155.5e-05
60.6910725.3531e-06
70.4650983.60260.00032
80.3881563.00660.001927
90.4952243.8360.000151
100.2919812.26170.013677
110.3091112.39440.009895
120.4749823.67920.000251
130.2466541.91060.030421
140.176211.36490.088688
150.3130782.42510.009166
160.1301281.0080.158759
170.0999270.7740.220975
180.2486091.92570.029441
190.0586860.45460.325527
20-0.00205-0.01590.493692
210.0704630.54580.293612
22-0.080077-0.62030.268713
23-0.082388-0.63820.262894
240.0316670.24530.403535
25-0.126088-0.97670.166326
26-0.179101-1.38730.08524
27-0.065103-0.50430.307953
28-0.197516-1.530.065642
29-0.222444-1.7230.045016
30-0.101537-0.78650.217334
31-0.225107-1.74370.043169
32-0.282521-2.18840.016272
33-0.217216-1.68250.04883
34-0.311114-2.40990.009521
35-0.331559-2.56820.006364
36-0.247818-1.91960.029834
37-0.328665-2.54580.006744
38-0.350638-2.7160.004309
39-0.264741-2.05070.022337
40-0.334348-2.58980.006017
41-0.339522-2.62990.005417
42-0.255587-1.97980.026161
43-0.310483-2.4050.009637
44-0.333008-2.57950.006182
45-0.265049-2.05310.022217
46-0.313951-2.43190.009012
47-0.32761-2.53770.006888
48-0.277671-2.15080.017764
49-0.288242-2.23270.014656
50-0.274281-2.12460.018876
51-0.20666-1.60080.057339
52-0.221991-1.71950.045336
53-0.210912-1.63370.053777
54-0.140333-1.0870.140689
55-0.140824-1.09080.139856
56-0.120164-0.93080.177846
57-0.048421-0.37510.354467
58-0.052371-0.40570.343215
59-0.027765-0.21510.415222
60NANANA


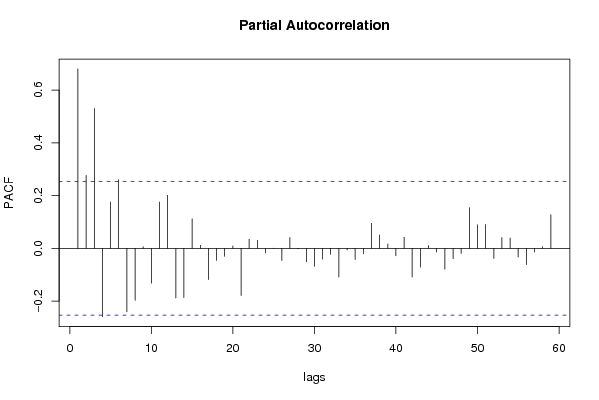
Partial Autocorrelation Function
Time lag kPACF(k)T-STATP-value
10.6797735.26551e-06
20.2761322.13890.018261
30.5303214.10786.1e-05
4-0.258983-2.00610.024681
50.1754941.35940.089558
60.2598132.01250.024331
7-0.240817-1.86540.033511
8-0.196859-1.52490.066273
90.006110.04730.481205
10-0.132005-1.02250.155322
110.1754231.35880.089644
120.200991.55690.062382
13-0.188354-1.4590.074892
14-0.186555-1.44510.076823
150.1119510.86720.194653
160.0112090.08680.465549
17-0.118469-0.91770.181236
18-0.045989-0.35620.36146
19-0.030193-0.23390.407941
200.009040.070.472205
21-0.178348-1.38150.086127
220.0347490.26920.394365
230.0302380.23420.407804
24-0.017669-0.13690.445799
250.0003770.00290.49884
26-0.045879-0.35540.361776
270.0405870.31440.377158
28-0.001655-0.01280.494906
29-0.051143-0.39620.3467
30-0.068247-0.52860.299502
31-0.041197-0.31910.375376
32-0.022892-0.17730.429926
33-0.108796-0.84270.201362
34-0.006339-0.04910.480501
35-0.042492-0.32910.371597
36-0.021031-0.16290.43557
370.0948530.73470.232683
380.0507930.39340.347693
390.0159780.12380.450956
40-0.02854-0.22110.412893
410.0416240.32240.374128
42-0.108751-0.84240.201461
43-0.071354-0.55270.29126
440.0109530.08480.466334
45-0.014414-0.11160.455738
46-0.079158-0.61320.271044
47-0.039098-0.30290.381524
48-0.019452-0.15070.440369
490.1537731.19110.119149
500.0890620.68990.246468
510.0902860.69940.243517
52-0.038608-0.29910.382966
530.0407360.31550.376725
540.0387320.30.382601
55-0.033269-0.25770.398761
56-0.061711-0.4780.31719
57-0.013635-0.10560.458119
580.0063840.04950.480362
590.1276520.98880.163368
60NANANA

\begin{tabular}{lllllllll}
\hline
Partial Autocorrelation Function \tabularnewline
Time lag k & PACF(k) & T-STAT & P-value \tabularnewline
1 & 0.679773 & 5.2655 & 1e-06 \tabularnewline
2 & 0.276132 & 2.1389 & 0.018261 \tabularnewline
3 & 0.530321 & 4.1078 & 6.1e-05 \tabularnewline
4 & -0.258983 & -2.0061 & 0.024681 \tabularnewline
5 & 0.175494 & 1.3594 & 0.089558 \tabularnewline
6 & 0.259813 & 2.0125 & 0.024331 \tabularnewline
7 & -0.240817 & -1.8654 & 0.033511 \tabularnewline
8 & -0.196859 & -1.5249 & 0.066273 \tabularnewline
9 & 0.00611 & 0.0473 & 0.481205 \tabularnewline
10 & -0.132005 & -1.0225 & 0.155322 \tabularnewline
11 & 0.175423 & 1.3588 & 0.089644 \tabularnewline
12 & 0.20099 & 1.5569 & 0.062382 \tabularnewline
13 & -0.188354 & -1.459 & 0.074892 \tabularnewline
14 & -0.186555 & -1.4451 & 0.076823 \tabularnewline
15 & 0.111951 & 0.8672 & 0.194653 \tabularnewline
16 & 0.011209 & 0.0868 & 0.465549 \tabularnewline
17 & -0.118469 & -0.9177 & 0.181236 \tabularnewline
18 & -0.045989 & -0.3562 & 0.36146 \tabularnewline
19 & -0.030193 & -0.2339 & 0.407941 \tabularnewline
20 & 0.00904 & 0.07 & 0.472205 \tabularnewline
21 & -0.178348 & -1.3815 & 0.086127 \tabularnewline
22 & 0.034749 & 0.2692 & 0.394365 \tabularnewline
23 & 0.030238 & 0.2342 & 0.407804 \tabularnewline
24 & -0.017669 & -0.1369 & 0.445799 \tabularnewline
25 & 0.000377 & 0.0029 & 0.49884 \tabularnewline
26 & -0.045879 & -0.3554 & 0.361776 \tabularnewline
27 & 0.040587 & 0.3144 & 0.377158 \tabularnewline
28 & -0.001655 & -0.0128 & 0.494906 \tabularnewline
29 & -0.051143 & -0.3962 & 0.3467 \tabularnewline
30 & -0.068247 & -0.5286 & 0.299502 \tabularnewline
31 & -0.041197 & -0.3191 & 0.375376 \tabularnewline
32 & -0.022892 & -0.1773 & 0.429926 \tabularnewline
33 & -0.108796 & -0.8427 & 0.201362 \tabularnewline
34 & -0.006339 & -0.0491 & 0.480501 \tabularnewline
35 & -0.042492 & -0.3291 & 0.371597 \tabularnewline
36 & -0.021031 & -0.1629 & 0.43557 \tabularnewline
37 & 0.094853 & 0.7347 & 0.232683 \tabularnewline
38 & 0.050793 & 0.3934 & 0.347693 \tabularnewline
39 & 0.015978 & 0.1238 & 0.450956 \tabularnewline
40 & -0.02854 & -0.2211 & 0.412893 \tabularnewline
41 & 0.041624 & 0.3224 & 0.374128 \tabularnewline
42 & -0.108751 & -0.8424 & 0.201461 \tabularnewline
43 & -0.071354 & -0.5527 & 0.29126 \tabularnewline
44 & 0.010953 & 0.0848 & 0.466334 \tabularnewline
45 & -0.014414 & -0.1116 & 0.455738 \tabularnewline
46 & -0.079158 & -0.6132 & 0.271044 \tabularnewline
47 & -0.039098 & -0.3029 & 0.381524 \tabularnewline
48 & -0.019452 & -0.1507 & 0.440369 \tabularnewline
49 & 0.153773 & 1.1911 & 0.119149 \tabularnewline
50 & 0.089062 & 0.6899 & 0.246468 \tabularnewline
51 & 0.090286 & 0.6994 & 0.243517 \tabularnewline
52 & -0.038608 & -0.2991 & 0.382966 \tabularnewline
53 & 0.040736 & 0.3155 & 0.376725 \tabularnewline
54 & 0.038732 & 0.3 & 0.382601 \tabularnewline
55 & -0.033269 & -0.2577 & 0.398761 \tabularnewline
56 & -0.061711 & -0.478 & 0.31719 \tabularnewline
57 & -0.013635 & -0.1056 & 0.458119 \tabularnewline
58 & 0.006384 & 0.0495 & 0.480362 \tabularnewline
59 & 0.127652 & 0.9888 & 0.163368 \tabularnewline
60 & NA & NA & NA \tabularnewline
\hline
\end{tabular}
%Source: https://freestatistics.org/blog/index.php?pk=35204&T=2

[TABLE]
[ROW][C]Partial Autocorrelation Function[/C][/ROW]
[ROW][C]Time lag k[/C][C]PACF(k)[/C][C]T-STAT[/C][C]P-value[/C][/ROW]
[ROW][C]1[/C][C]0.679773[/C][C]5.2655[/C][C]1e-06[/C][/ROW]
[ROW][C]2[/C][C]0.276132[/C][C]2.1389[/C][C]0.018261[/C][/ROW]
[ROW][C]3[/C][C]0.530321[/C][C]4.1078[/C][C]6.1e-05[/C][/ROW]
[ROW][C]4[/C][C]-0.258983[/C][C]-2.0061[/C][C]0.024681[/C][/ROW]
[ROW][C]5[/C][C]0.175494[/C][C]1.3594[/C][C]0.089558[/C][/ROW]
[ROW][C]6[/C][C]0.259813[/C][C]2.0125[/C][C]0.024331[/C][/ROW]
[ROW][C]7[/C][C]-0.240817[/C][C]-1.8654[/C][C]0.033511[/C][/ROW]
[ROW][C]8[/C][C]-0.196859[/C][C]-1.5249[/C][C]0.066273[/C][/ROW]
[ROW][C]9[/C][C]0.00611[/C][C]0.0473[/C][C]0.481205[/C][/ROW]
[ROW][C]10[/C][C]-0.132005[/C][C]-1.0225[/C][C]0.155322[/C][/ROW]
[ROW][C]11[/C][C]0.175423[/C][C]1.3588[/C][C]0.089644[/C][/ROW]
[ROW][C]12[/C][C]0.20099[/C][C]1.5569[/C][C]0.062382[/C][/ROW]
[ROW][C]13[/C][C]-0.188354[/C][C]-1.459[/C][C]0.074892[/C][/ROW]
[ROW][C]14[/C][C]-0.186555[/C][C]-1.4451[/C][C]0.076823[/C][/ROW]
[ROW][C]15[/C][C]0.111951[/C][C]0.8672[/C][C]0.194653[/C][/ROW]
[ROW][C]16[/C][C]0.011209[/C][C]0.0868[/C][C]0.465549[/C][/ROW]
[ROW][C]17[/C][C]-0.118469[/C][C]-0.9177[/C][C]0.181236[/C][/ROW]
[ROW][C]18[/C][C]-0.045989[/C][C]-0.3562[/C][C]0.36146[/C][/ROW]
[ROW][C]19[/C][C]-0.030193[/C][C]-0.2339[/C][C]0.407941[/C][/ROW]
[ROW][C]20[/C][C]0.00904[/C][C]0.07[/C][C]0.472205[/C][/ROW]
[ROW][C]21[/C][C]-0.178348[/C][C]-1.3815[/C][C]0.086127[/C][/ROW]
[ROW][C]22[/C][C]0.034749[/C][C]0.2692[/C][C]0.394365[/C][/ROW]
[ROW][C]23[/C][C]0.030238[/C][C]0.2342[/C][C]0.407804[/C][/ROW]
[ROW][C]24[/C][C]-0.017669[/C][C]-0.1369[/C][C]0.445799[/C][/ROW]
[ROW][C]25[/C][C]0.000377[/C][C]0.0029[/C][C]0.49884[/C][/ROW]
[ROW][C]26[/C][C]-0.045879[/C][C]-0.3554[/C][C]0.361776[/C][/ROW]
[ROW][C]27[/C][C]0.040587[/C][C]0.3144[/C][C]0.377158[/C][/ROW]
[ROW][C]28[/C][C]-0.001655[/C][C]-0.0128[/C][C]0.494906[/C][/ROW]
[ROW][C]29[/C][C]-0.051143[/C][C]-0.3962[/C][C]0.3467[/C][/ROW]
[ROW][C]30[/C][C]-0.068247[/C][C]-0.5286[/C][C]0.299502[/C][/ROW]
[ROW][C]31[/C][C]-0.041197[/C][C]-0.3191[/C][C]0.375376[/C][/ROW]
[ROW][C]32[/C][C]-0.022892[/C][C]-0.1773[/C][C]0.429926[/C][/ROW]
[ROW][C]33[/C][C]-0.108796[/C][C]-0.8427[/C][C]0.201362[/C][/ROW]
[ROW][C]34[/C][C]-0.006339[/C][C]-0.0491[/C][C]0.480501[/C][/ROW]
[ROW][C]35[/C][C]-0.042492[/C][C]-0.3291[/C][C]0.371597[/C][/ROW]
[ROW][C]36[/C][C]-0.021031[/C][C]-0.1629[/C][C]0.43557[/C][/ROW]
[ROW][C]37[/C][C]0.094853[/C][C]0.7347[/C][C]0.232683[/C][/ROW]
[ROW][C]38[/C][C]0.050793[/C][C]0.3934[/C][C]0.347693[/C][/ROW]
[ROW][C]39[/C][C]0.015978[/C][C]0.1238[/C][C]0.450956[/C][/ROW]
[ROW][C]40[/C][C]-0.02854[/C][C]-0.2211[/C][C]0.412893[/C][/ROW]
[ROW][C]41[/C][C]0.041624[/C][C]0.3224[/C][C]0.374128[/C][/ROW]
[ROW][C]42[/C][C]-0.108751[/C][C]-0.8424[/C][C]0.201461[/C][/ROW]
[ROW][C]43[/C][C]-0.071354[/C][C]-0.5527[/C][C]0.29126[/C][/ROW]
[ROW][C]44[/C][C]0.010953[/C][C]0.0848[/C][C]0.466334[/C][/ROW]
[ROW][C]45[/C][C]-0.014414[/C][C]-0.1116[/C][C]0.455738[/C][/ROW]
[ROW][C]46[/C][C]-0.079158[/C][C]-0.6132[/C][C]0.271044[/C][/ROW]
[ROW][C]47[/C][C]-0.039098[/C][C]-0.3029[/C][C]0.381524[/C][/ROW]
[ROW][C]48[/C][C]-0.019452[/C][C]-0.1507[/C][C]0.440369[/C][/ROW]
[ROW][C]49[/C][C]0.153773[/C][C]1.1911[/C][C]0.119149[/C][/ROW]
[ROW][C]50[/C][C]0.089062[/C][C]0.6899[/C][C]0.246468[/C][/ROW]
[ROW][C]51[/C][C]0.090286[/C][C]0.6994[/C][C]0.243517[/C][/ROW]
[ROW][C]52[/C][C]-0.038608[/C][C]-0.2991[/C][C]0.382966[/C][/ROW]
[ROW][C]53[/C][C]0.040736[/C][C]0.3155[/C][C]0.376725[/C][/ROW]
[ROW][C]54[/C][C]0.038732[/C][C]0.3[/C][C]0.382601[/C][/ROW]
[ROW][C]55[/C][C]-0.033269[/C][C]-0.2577[/C][C]0.398761[/C][/ROW]
[ROW][C]56[/C][C]-0.061711[/C][C]-0.478[/C][C]0.31719[/C][/ROW]
[ROW][C]57[/C][C]-0.013635[/C][C]-0.1056[/C][C]0.458119[/C][/ROW]
[ROW][C]58[/C][C]0.006384[/C][C]0.0495[/C][C]0.480362[/C][/ROW]
[ROW][C]59[/C][C]0.127652[/C][C]0.9888[/C][C]0.163368[/C][/ROW]
[ROW][C]60[/C][C]NA[/C][C]NA[/C][C]NA[/C][/ROW]
[/TABLE]
Source: https://freestatistics.org/blog/index.php?pk=35204&T=2

Globally Unique Identifier (entire table): ba.freestatistics.org/blog/index.php?pk=35204&T=2

As an alternative you can also use a QR Code:  

The GUIDs for individual cells are displayed in the table below:

Partial Autocorrelation Function
Time lag kPACF(k)T-STATP-value
10.6797735.26551e-06
20.2761322.13890.018261
30.5303214.10786.1e-05
4-0.258983-2.00610.024681
50.1754941.35940.089558
60.2598132.01250.024331
7-0.240817-1.86540.033511
8-0.196859-1.52490.066273
90.006110.04730.481205
10-0.132005-1.02250.155322
110.1754231.35880.089644
120.200991.55690.062382
13-0.188354-1.4590.074892
14-0.186555-1.44510.076823
150.1119510.86720.194653
160.0112090.08680.465549
17-0.118469-0.91770.181236
18-0.045989-0.35620.36146
19-0.030193-0.23390.407941
200.009040.070.472205
21-0.178348-1.38150.086127
220.0347490.26920.394365
230.0302380.23420.407804
24-0.017669-0.13690.445799
250.0003770.00290.49884
26-0.045879-0.35540.361776
270.0405870.31440.377158
28-0.001655-0.01280.494906
29-0.051143-0.39620.3467
30-0.068247-0.52860.299502
31-0.041197-0.31910.375376
32-0.022892-0.17730.429926
33-0.108796-0.84270.201362
34-0.006339-0.04910.480501
35-0.042492-0.32910.371597
36-0.021031-0.16290.43557
370.0948530.73470.232683
380.0507930.39340.347693
390.0159780.12380.450956
40-0.02854-0.22110.412893
410.0416240.32240.374128
42-0.108751-0.84240.201461
43-0.071354-0.55270.29126
440.0109530.08480.466334
45-0.014414-0.11160.455738
46-0.079158-0.61320.271044
47-0.039098-0.30290.381524
48-0.019452-0.15070.440369
490.1537731.19110.119149
500.0890620.68990.246468
510.0902860.69940.243517
52-0.038608-0.29910.382966
530.0407360.31550.376725
540.0387320.30.382601
55-0.033269-0.25770.398761
56-0.061711-0.4780.31719
57-0.013635-0.10560.458119
580.0063840.04950.480362
590.1276520.98880.163368
60NANANA


Parameters (Session):
par1 = 60 ; par2 = 1 ; par3 = 0 ; par4 = 0 ; par5 = 12 ;
Parameters (R input):
par1 = 60 ; par2 = 1 ; par3 = 0 ; par4 = 0 ; par5 = 12 ;
R code (references can be found in the software module):
if (par1 == 'Default') {
par1 = 10*log10(length(x))
} else {
par1 <- as.numeric(par1)
}
par2 <- as.numeric(par2)
par3 <- as.numeric(par3)
par4 <- as.numeric(par4)
par5 <- as.numeric(par5)
if (par2 == 0) {
x <- log(x)
} else {
x <- (x ^ par2 - 1) / par2
}
if (par3 > 0) x <- diff(x,lag=1,difference=par3)
if (par4 > 0) x <- diff(x,lag=par5,difference=par4)
bitmap(file='pic1.png')
racf <- acf(x,par1,main='Autocorrelation',xlab='lags',ylab='ACF')
dev.off()
bitmap(file='pic2.png')
rpacf <- pacf(x,par1,main='Partial Autocorrelation',xlab='lags',ylab='PACF')
dev.off()
(myacf <- c(racf$acf))
(mypacf <- c(rpacf$acf))
lengthx <- length(x)
sqrtn <- sqrt(lengthx)
load(file='createtable')
a<-table.start()
a<-table.row.start(a)
a<-table.element(a,'Autocorrelation Function',4,TRUE)
a<-table.row.end(a)
a<-table.row.start(a)
a<-table.element(a,'Time lag k',header=TRUE)
a<-table.element(a,hyperlink('basics.htm','ACF(k)','click here for more information about the Autocorrelation Function'),header=TRUE)
a<-table.element(a,'T-STAT',header=TRUE)
a<-table.element(a,'P-value',header=TRUE)
a<-table.row.end(a)
for (i in 2:(par1+1)) {
a<-table.row.start(a)
a<-table.element(a,i-1,header=TRUE)
a<-table.element(a,round(myacf[i],6))
mytstat <- myacf[i]*sqrtn
a<-table.element(a,round(mytstat,4))
a<-table.element(a,round(1-pt(abs(mytstat),lengthx),6))
a<-table.row.end(a)
}
a<-table.end(a)
table.save(a,file='mytable.tab')
a<-table.start()
a<-table.row.start(a)
a<-table.element(a,'Partial Autocorrelation Function',4,TRUE)
a<-table.row.end(a)
a<-table.row.start(a)
a<-table.element(a,'Time lag k',header=TRUE)
a<-table.element(a,hyperlink('basics.htm','PACF(k)','click here for more information about the Partial Autocorrelation Function'),header=TRUE)
a<-table.element(a,'T-STAT',header=TRUE)
a<-table.element(a,'P-value',header=TRUE)
a<-table.row.end(a)
for (i in 1:par1) {
a<-table.row.start(a)
a<-table.element(a,i,header=TRUE)
a<-table.element(a,round(mypacf[i],6))
mytstat <- mypacf[i]*sqrtn
a<-table.element(a,round(mytstat,4))
a<-table.element(a,round(1-pt(abs(mytstat),lengthx),6))
a<-table.row.end(a)
}
a<-table.end(a)
table.save(a,file='mytable1.tab')