Free Statistics

of Irreproducible Research!

Author's title

Author*The author of this computation has been verified*
R Software Modulerwasp_autocorrelation.wasp
Title produced by software(Partial) Autocorrelation Function
Date of computationFri, 19 Dec 2008 09:01:23 -0700
Cite this page as followsStatistical Computations at FreeStatistics.org, Office for Research Development and Education, URL https://freestatistics.org/blog/index.php?v=date/2008/Dec/19/t12297025558jk58zyoboduppc.htm/, Retrieved Thu, 16 May 2024 03:30:01 +0000
Statistical Computations at FreeStatistics.org, Office for Research Development and Education, URL https://freestatistics.org/blog/index.php?pk=35202, Retrieved Thu, 16 May 2024 03:30:01 +0000
QR Codes:

Original text written by user:
IsPrivate?No (this computation is public)
User-defined keywords
Estimated Impact176
Family? (F = Feedback message, R = changed R code, M = changed R Module, P = changed Parameters, D = changed Data)
-     [(Partial) Autocorrelation Function] [(P)ACF: gezuiverd...] [2008-12-17 19:54:38] [5161246d1ccc1b670cc664d03050f084]
-   PD    [(Partial) Autocorrelation Function] [paper: (p)acf gez...] [2008-12-19 16:01:23] [366411ff82333cf2a466cacd3525c11d] [Current]
Feedback Forum

Post a new message
Dataseries X:
101.3
91.5
152.6
86.6
86.6
98.5
86.7
89.1
111
92.6
85.1
116.1
98.3
97.7
177.9
94.2
83.8
109.5
102.3
102.5
116.4
85.3
88.2
104.7
99.4
113.8
166.6
89.2
93.2
115
97.2
112.5
121.8
100.2
93.8
113.6
110.7
127.6
185.9
105.9
108
125.2
106.2
123.3
145.2
114.3
108.4
120.9
126.3
141.3
208.2
131.6
119.8
122.5
137.6
141
154.1
127
106.1
129.9


Summary of computational transaction
Raw Inputview raw input (R code)
Raw Outputview raw output of R engine
Computing time3 seconds
R Server'Sir Ronald Aylmer Fisher' @ 193.190.124.24

\begin{tabular}{lllllllll}
\hline
Summary of computational transaction \tabularnewline
Raw Input & view raw input (R code)  \tabularnewline
Raw Output & view raw output of R engine  \tabularnewline
Computing time & 3 seconds \tabularnewline
R Server & 'Sir Ronald Aylmer Fisher' @ 193.190.124.24 \tabularnewline
\hline
\end{tabular}
%Source: https://freestatistics.org/blog/index.php?pk=35202&T=0

[TABLE]
[ROW][C]Summary of computational transaction[/C][/ROW]
[ROW][C]Raw Input[/C][C]view raw input (R code) [/C][/ROW]
[ROW][C]Raw Output[/C][C]view raw output of R engine [/C][/ROW]
[ROW][C]Computing time[/C][C]3 seconds[/C][/ROW]
[ROW][C]R Server[/C][C]'Sir Ronald Aylmer Fisher' @ 193.190.124.24[/C][/ROW]
[/TABLE]
Source: https://freestatistics.org/blog/index.php?pk=35202&T=0

Globally Unique Identifier (entire table): ba.freestatistics.org/blog/index.php?pk=35202&T=0

As an alternative you can also use a QR Code:  

The GUIDs for individual cells are displayed in the table below:

Summary of computational transaction
Raw Inputview raw input (R code)
Raw Outputview raw output of R engine
Computing time3 seconds
R Server'Sir Ronald Aylmer Fisher' @ 193.190.124.24


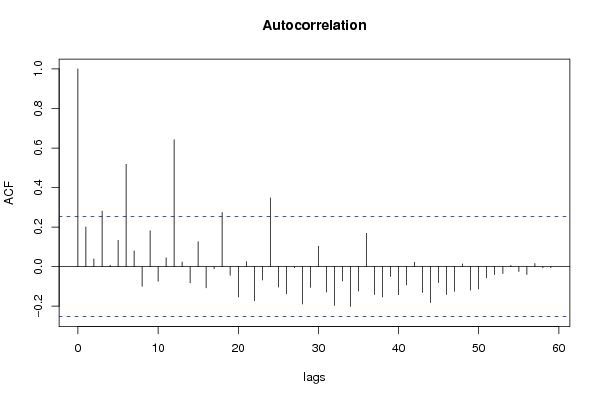
Autocorrelation Function
Time lag kACF(k)T-STATP-value
10.2003871.55220.062938
20.0383840.29730.383623
30.2810822.17720.016703
40.0071430.05530.478031
50.1329971.03020.153528
60.5173984.00778.6e-05
70.079220.61360.270887
8-0.09948-0.77060.221993
90.1820291.410.081852
10-0.073913-0.57250.284552
110.0445030.34470.365756
120.6421964.97443e-06
130.0233760.18110.428462
14-0.081264-0.62950.265716
150.1260840.97660.166334
16-0.10733-0.83140.204528
17-0.010374-0.08040.46811
180.2739882.12230.018975
19-0.04367-0.33830.36817
20-0.153522-1.18920.119527
210.0248430.19240.424025
22-0.173151-1.34120.092452
23-0.06724-0.52080.302199
240.347172.68920.00463
25-0.103472-0.80150.213005
26-0.136992-1.06110.14644
27-0.00613-0.04750.481144
28-0.1887-1.46170.074525
29-0.105215-0.8150.209149
300.1037290.80350.212434
31-0.128231-0.99330.162283
32-0.196046-1.51860.067062
33-0.072939-0.5650.287096
34-0.200822-1.55560.062536
35-0.123499-0.95660.171298
360.1692151.31070.097471
37-0.140433-1.08780.14052
38-0.153983-1.19270.118831
39-0.050192-0.38880.349407
40-0.141779-1.09820.13825
41-0.093532-0.72450.235788
420.0218640.16940.433043
43-0.130943-1.01430.15726
44-0.181877-1.40880.082026
45-0.080702-0.62510.267133
46-0.14039-1.08750.140593
47-0.125029-0.96850.168348
480.0136790.1060.457985
49-0.118497-0.91790.181179
50-0.113314-0.87770.191797
51-0.056869-0.44050.330578
52-0.039711-0.30760.379725
53-0.03491-0.27040.393887
540.005420.0420.483326
55-0.025123-0.19460.423181
56-0.0398-0.30830.379466
570.0152610.11820.453148
58-0.005738-0.04440.482347
59-0.005155-0.03990.484141
60NANANA

\begin{tabular}{lllllllll}
\hline
Autocorrelation Function \tabularnewline
Time lag k & ACF(k) & T-STAT & P-value \tabularnewline
1 & 0.200387 & 1.5522 & 0.062938 \tabularnewline
2 & 0.038384 & 0.2973 & 0.383623 \tabularnewline
3 & 0.281082 & 2.1772 & 0.016703 \tabularnewline
4 & 0.007143 & 0.0553 & 0.478031 \tabularnewline
5 & 0.132997 & 1.0302 & 0.153528 \tabularnewline
6 & 0.517398 & 4.0077 & 8.6e-05 \tabularnewline
7 & 0.07922 & 0.6136 & 0.270887 \tabularnewline
8 & -0.09948 & -0.7706 & 0.221993 \tabularnewline
9 & 0.182029 & 1.41 & 0.081852 \tabularnewline
10 & -0.073913 & -0.5725 & 0.284552 \tabularnewline
11 & 0.044503 & 0.3447 & 0.365756 \tabularnewline
12 & 0.642196 & 4.9744 & 3e-06 \tabularnewline
13 & 0.023376 & 0.1811 & 0.428462 \tabularnewline
14 & -0.081264 & -0.6295 & 0.265716 \tabularnewline
15 & 0.126084 & 0.9766 & 0.166334 \tabularnewline
16 & -0.10733 & -0.8314 & 0.204528 \tabularnewline
17 & -0.010374 & -0.0804 & 0.46811 \tabularnewline
18 & 0.273988 & 2.1223 & 0.018975 \tabularnewline
19 & -0.04367 & -0.3383 & 0.36817 \tabularnewline
20 & -0.153522 & -1.1892 & 0.119527 \tabularnewline
21 & 0.024843 & 0.1924 & 0.424025 \tabularnewline
22 & -0.173151 & -1.3412 & 0.092452 \tabularnewline
23 & -0.06724 & -0.5208 & 0.302199 \tabularnewline
24 & 0.34717 & 2.6892 & 0.00463 \tabularnewline
25 & -0.103472 & -0.8015 & 0.213005 \tabularnewline
26 & -0.136992 & -1.0611 & 0.14644 \tabularnewline
27 & -0.00613 & -0.0475 & 0.481144 \tabularnewline
28 & -0.1887 & -1.4617 & 0.074525 \tabularnewline
29 & -0.105215 & -0.815 & 0.209149 \tabularnewline
30 & 0.103729 & 0.8035 & 0.212434 \tabularnewline
31 & -0.128231 & -0.9933 & 0.162283 \tabularnewline
32 & -0.196046 & -1.5186 & 0.067062 \tabularnewline
33 & -0.072939 & -0.565 & 0.287096 \tabularnewline
34 & -0.200822 & -1.5556 & 0.062536 \tabularnewline
35 & -0.123499 & -0.9566 & 0.171298 \tabularnewline
36 & 0.169215 & 1.3107 & 0.097471 \tabularnewline
37 & -0.140433 & -1.0878 & 0.14052 \tabularnewline
38 & -0.153983 & -1.1927 & 0.118831 \tabularnewline
39 & -0.050192 & -0.3888 & 0.349407 \tabularnewline
40 & -0.141779 & -1.0982 & 0.13825 \tabularnewline
41 & -0.093532 & -0.7245 & 0.235788 \tabularnewline
42 & 0.021864 & 0.1694 & 0.433043 \tabularnewline
43 & -0.130943 & -1.0143 & 0.15726 \tabularnewline
44 & -0.181877 & -1.4088 & 0.082026 \tabularnewline
45 & -0.080702 & -0.6251 & 0.267133 \tabularnewline
46 & -0.14039 & -1.0875 & 0.140593 \tabularnewline
47 & -0.125029 & -0.9685 & 0.168348 \tabularnewline
48 & 0.013679 & 0.106 & 0.457985 \tabularnewline
49 & -0.118497 & -0.9179 & 0.181179 \tabularnewline
50 & -0.113314 & -0.8777 & 0.191797 \tabularnewline
51 & -0.056869 & -0.4405 & 0.330578 \tabularnewline
52 & -0.039711 & -0.3076 & 0.379725 \tabularnewline
53 & -0.03491 & -0.2704 & 0.393887 \tabularnewline
54 & 0.00542 & 0.042 & 0.483326 \tabularnewline
55 & -0.025123 & -0.1946 & 0.423181 \tabularnewline
56 & -0.0398 & -0.3083 & 0.379466 \tabularnewline
57 & 0.015261 & 0.1182 & 0.453148 \tabularnewline
58 & -0.005738 & -0.0444 & 0.482347 \tabularnewline
59 & -0.005155 & -0.0399 & 0.484141 \tabularnewline
60 & NA & NA & NA \tabularnewline
\hline
\end{tabular}
%Source: https://freestatistics.org/blog/index.php?pk=35202&T=1

[TABLE]
[ROW][C]Autocorrelation Function[/C][/ROW]
[ROW][C]Time lag k[/C][C]ACF(k)[/C][C]T-STAT[/C][C]P-value[/C][/ROW]
[ROW][C]1[/C][C]0.200387[/C][C]1.5522[/C][C]0.062938[/C][/ROW]
[ROW][C]2[/C][C]0.038384[/C][C]0.2973[/C][C]0.383623[/C][/ROW]
[ROW][C]3[/C][C]0.281082[/C][C]2.1772[/C][C]0.016703[/C][/ROW]
[ROW][C]4[/C][C]0.007143[/C][C]0.0553[/C][C]0.478031[/C][/ROW]
[ROW][C]5[/C][C]0.132997[/C][C]1.0302[/C][C]0.153528[/C][/ROW]
[ROW][C]6[/C][C]0.517398[/C][C]4.0077[/C][C]8.6e-05[/C][/ROW]
[ROW][C]7[/C][C]0.07922[/C][C]0.6136[/C][C]0.270887[/C][/ROW]
[ROW][C]8[/C][C]-0.09948[/C][C]-0.7706[/C][C]0.221993[/C][/ROW]
[ROW][C]9[/C][C]0.182029[/C][C]1.41[/C][C]0.081852[/C][/ROW]
[ROW][C]10[/C][C]-0.073913[/C][C]-0.5725[/C][C]0.284552[/C][/ROW]
[ROW][C]11[/C][C]0.044503[/C][C]0.3447[/C][C]0.365756[/C][/ROW]
[ROW][C]12[/C][C]0.642196[/C][C]4.9744[/C][C]3e-06[/C][/ROW]
[ROW][C]13[/C][C]0.023376[/C][C]0.1811[/C][C]0.428462[/C][/ROW]
[ROW][C]14[/C][C]-0.081264[/C][C]-0.6295[/C][C]0.265716[/C][/ROW]
[ROW][C]15[/C][C]0.126084[/C][C]0.9766[/C][C]0.166334[/C][/ROW]
[ROW][C]16[/C][C]-0.10733[/C][C]-0.8314[/C][C]0.204528[/C][/ROW]
[ROW][C]17[/C][C]-0.010374[/C][C]-0.0804[/C][C]0.46811[/C][/ROW]
[ROW][C]18[/C][C]0.273988[/C][C]2.1223[/C][C]0.018975[/C][/ROW]
[ROW][C]19[/C][C]-0.04367[/C][C]-0.3383[/C][C]0.36817[/C][/ROW]
[ROW][C]20[/C][C]-0.153522[/C][C]-1.1892[/C][C]0.119527[/C][/ROW]
[ROW][C]21[/C][C]0.024843[/C][C]0.1924[/C][C]0.424025[/C][/ROW]
[ROW][C]22[/C][C]-0.173151[/C][C]-1.3412[/C][C]0.092452[/C][/ROW]
[ROW][C]23[/C][C]-0.06724[/C][C]-0.5208[/C][C]0.302199[/C][/ROW]
[ROW][C]24[/C][C]0.34717[/C][C]2.6892[/C][C]0.00463[/C][/ROW]
[ROW][C]25[/C][C]-0.103472[/C][C]-0.8015[/C][C]0.213005[/C][/ROW]
[ROW][C]26[/C][C]-0.136992[/C][C]-1.0611[/C][C]0.14644[/C][/ROW]
[ROW][C]27[/C][C]-0.00613[/C][C]-0.0475[/C][C]0.481144[/C][/ROW]
[ROW][C]28[/C][C]-0.1887[/C][C]-1.4617[/C][C]0.074525[/C][/ROW]
[ROW][C]29[/C][C]-0.105215[/C][C]-0.815[/C][C]0.209149[/C][/ROW]
[ROW][C]30[/C][C]0.103729[/C][C]0.8035[/C][C]0.212434[/C][/ROW]
[ROW][C]31[/C][C]-0.128231[/C][C]-0.9933[/C][C]0.162283[/C][/ROW]
[ROW][C]32[/C][C]-0.196046[/C][C]-1.5186[/C][C]0.067062[/C][/ROW]
[ROW][C]33[/C][C]-0.072939[/C][C]-0.565[/C][C]0.287096[/C][/ROW]
[ROW][C]34[/C][C]-0.200822[/C][C]-1.5556[/C][C]0.062536[/C][/ROW]
[ROW][C]35[/C][C]-0.123499[/C][C]-0.9566[/C][C]0.171298[/C][/ROW]
[ROW][C]36[/C][C]0.169215[/C][C]1.3107[/C][C]0.097471[/C][/ROW]
[ROW][C]37[/C][C]-0.140433[/C][C]-1.0878[/C][C]0.14052[/C][/ROW]
[ROW][C]38[/C][C]-0.153983[/C][C]-1.1927[/C][C]0.118831[/C][/ROW]
[ROW][C]39[/C][C]-0.050192[/C][C]-0.3888[/C][C]0.349407[/C][/ROW]
[ROW][C]40[/C][C]-0.141779[/C][C]-1.0982[/C][C]0.13825[/C][/ROW]
[ROW][C]41[/C][C]-0.093532[/C][C]-0.7245[/C][C]0.235788[/C][/ROW]
[ROW][C]42[/C][C]0.021864[/C][C]0.1694[/C][C]0.433043[/C][/ROW]
[ROW][C]43[/C][C]-0.130943[/C][C]-1.0143[/C][C]0.15726[/C][/ROW]
[ROW][C]44[/C][C]-0.181877[/C][C]-1.4088[/C][C]0.082026[/C][/ROW]
[ROW][C]45[/C][C]-0.080702[/C][C]-0.6251[/C][C]0.267133[/C][/ROW]
[ROW][C]46[/C][C]-0.14039[/C][C]-1.0875[/C][C]0.140593[/C][/ROW]
[ROW][C]47[/C][C]-0.125029[/C][C]-0.9685[/C][C]0.168348[/C][/ROW]
[ROW][C]48[/C][C]0.013679[/C][C]0.106[/C][C]0.457985[/C][/ROW]
[ROW][C]49[/C][C]-0.118497[/C][C]-0.9179[/C][C]0.181179[/C][/ROW]
[ROW][C]50[/C][C]-0.113314[/C][C]-0.8777[/C][C]0.191797[/C][/ROW]
[ROW][C]51[/C][C]-0.056869[/C][C]-0.4405[/C][C]0.330578[/C][/ROW]
[ROW][C]52[/C][C]-0.039711[/C][C]-0.3076[/C][C]0.379725[/C][/ROW]
[ROW][C]53[/C][C]-0.03491[/C][C]-0.2704[/C][C]0.393887[/C][/ROW]
[ROW][C]54[/C][C]0.00542[/C][C]0.042[/C][C]0.483326[/C][/ROW]
[ROW][C]55[/C][C]-0.025123[/C][C]-0.1946[/C][C]0.423181[/C][/ROW]
[ROW][C]56[/C][C]-0.0398[/C][C]-0.3083[/C][C]0.379466[/C][/ROW]
[ROW][C]57[/C][C]0.015261[/C][C]0.1182[/C][C]0.453148[/C][/ROW]
[ROW][C]58[/C][C]-0.005738[/C][C]-0.0444[/C][C]0.482347[/C][/ROW]
[ROW][C]59[/C][C]-0.005155[/C][C]-0.0399[/C][C]0.484141[/C][/ROW]
[ROW][C]60[/C][C]NA[/C][C]NA[/C][C]NA[/C][/ROW]
[/TABLE]
Source: https://freestatistics.org/blog/index.php?pk=35202&T=1

Globally Unique Identifier (entire table): ba.freestatistics.org/blog/index.php?pk=35202&T=1

As an alternative you can also use a QR Code:  

The GUIDs for individual cells are displayed in the table below:

Autocorrelation Function
Time lag kACF(k)T-STATP-value
10.2003871.55220.062938
20.0383840.29730.383623
30.2810822.17720.016703
40.0071430.05530.478031
50.1329971.03020.153528
60.5173984.00778.6e-05
70.079220.61360.270887
8-0.09948-0.77060.221993
90.1820291.410.081852
10-0.073913-0.57250.284552
110.0445030.34470.365756
120.6421964.97443e-06
130.0233760.18110.428462
14-0.081264-0.62950.265716
150.1260840.97660.166334
16-0.10733-0.83140.204528
17-0.010374-0.08040.46811
180.2739882.12230.018975
19-0.04367-0.33830.36817
20-0.153522-1.18920.119527
210.0248430.19240.424025
22-0.173151-1.34120.092452
23-0.06724-0.52080.302199
240.347172.68920.00463
25-0.103472-0.80150.213005
26-0.136992-1.06110.14644
27-0.00613-0.04750.481144
28-0.1887-1.46170.074525
29-0.105215-0.8150.209149
300.1037290.80350.212434
31-0.128231-0.99330.162283
32-0.196046-1.51860.067062
33-0.072939-0.5650.287096
34-0.200822-1.55560.062536
35-0.123499-0.95660.171298
360.1692151.31070.097471
37-0.140433-1.08780.14052
38-0.153983-1.19270.118831
39-0.050192-0.38880.349407
40-0.141779-1.09820.13825
41-0.093532-0.72450.235788
420.0218640.16940.433043
43-0.130943-1.01430.15726
44-0.181877-1.40880.082026
45-0.080702-0.62510.267133
46-0.14039-1.08750.140593
47-0.125029-0.96850.168348
480.0136790.1060.457985
49-0.118497-0.91790.181179
50-0.113314-0.87770.191797
51-0.056869-0.44050.330578
52-0.039711-0.30760.379725
53-0.03491-0.27040.393887
540.005420.0420.483326
55-0.025123-0.19460.423181
56-0.0398-0.30830.379466
570.0152610.11820.453148
58-0.005738-0.04440.482347
59-0.005155-0.03990.484141
60NANANA


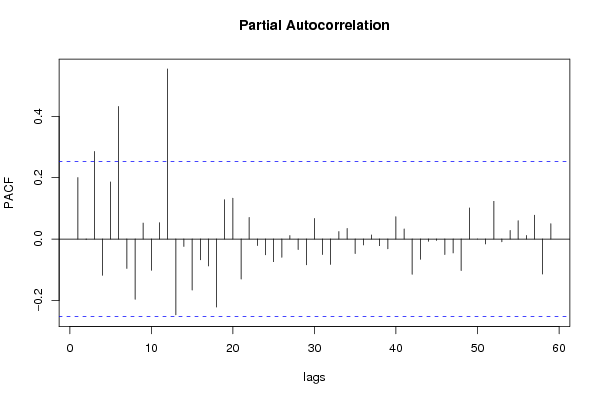
Partial Autocorrelation Function
Time lag kPACF(k)T-STATP-value
10.2003871.55220.062938
2-0.001845-0.01430.494324
30.2851982.20910.015497
4-0.118303-0.91640.181571
50.1860311.4410.077393
60.4321543.34750.000706
7-0.095658-0.7410.230803
8-0.196167-1.51950.066945
90.0520860.40350.344024
10-0.101664-0.78750.21705
110.052980.41040.341494
120.5545474.29553.2e-05
13-0.246682-1.91080.030406
14-0.02399-0.18580.426605
15-0.166381-1.28880.10121
16-0.067529-0.52310.301422
17-0.087548-0.67810.250143
18-0.221786-1.71790.045482
190.1283510.99420.162059
200.1332871.03240.153006
21-0.130523-1.0110.158032
220.0704190.54550.293729
23-0.021396-0.16570.434463
24-0.051311-0.39750.346221
25-0.073725-0.57110.285042
26-0.059501-0.46090.323271
270.01120.08680.465578
28-0.034016-0.26350.396539
29-0.084126-0.65160.258561
300.0672330.52080.302217
31-0.050346-0.390.348966
32-0.082753-0.6410.26198
330.0242330.18770.425869
340.0341590.26460.396113
35-0.047368-0.36690.357488
36-0.019067-0.14770.441542
370.0134740.10440.458613
38-0.021474-0.16630.434226
39-0.031868-0.24680.402935
400.0727520.56350.287586
410.0328650.25460.399963
42-0.114854-0.88970.188602
43-0.06572-0.50910.306287
44-0.006995-0.05420.478485
45-0.004351-0.03370.486613
46-0.050584-0.39180.348288
47-0.045232-0.35040.363646
48-0.102692-0.79540.214745
490.1011320.78340.218248
500.0001229e-040.499624
51-0.015845-0.12270.451363
520.122910.95210.172443
53-0.00887-0.06870.472727
540.0276450.21410.415584
550.0594630.46060.323375
560.0113490.08790.465122
570.0778830.60330.274298
58-0.114239-0.88490.189874
590.0500010.38730.349949
60NANANA

\begin{tabular}{lllllllll}
\hline
Partial Autocorrelation Function \tabularnewline
Time lag k & PACF(k) & T-STAT & P-value \tabularnewline
1 & 0.200387 & 1.5522 & 0.062938 \tabularnewline
2 & -0.001845 & -0.0143 & 0.494324 \tabularnewline
3 & 0.285198 & 2.2091 & 0.015497 \tabularnewline
4 & -0.118303 & -0.9164 & 0.181571 \tabularnewline
5 & 0.186031 & 1.441 & 0.077393 \tabularnewline
6 & 0.432154 & 3.3475 & 0.000706 \tabularnewline
7 & -0.095658 & -0.741 & 0.230803 \tabularnewline
8 & -0.196167 & -1.5195 & 0.066945 \tabularnewline
9 & 0.052086 & 0.4035 & 0.344024 \tabularnewline
10 & -0.101664 & -0.7875 & 0.21705 \tabularnewline
11 & 0.05298 & 0.4104 & 0.341494 \tabularnewline
12 & 0.554547 & 4.2955 & 3.2e-05 \tabularnewline
13 & -0.246682 & -1.9108 & 0.030406 \tabularnewline
14 & -0.02399 & -0.1858 & 0.426605 \tabularnewline
15 & -0.166381 & -1.2888 & 0.10121 \tabularnewline
16 & -0.067529 & -0.5231 & 0.301422 \tabularnewline
17 & -0.087548 & -0.6781 & 0.250143 \tabularnewline
18 & -0.221786 & -1.7179 & 0.045482 \tabularnewline
19 & 0.128351 & 0.9942 & 0.162059 \tabularnewline
20 & 0.133287 & 1.0324 & 0.153006 \tabularnewline
21 & -0.130523 & -1.011 & 0.158032 \tabularnewline
22 & 0.070419 & 0.5455 & 0.293729 \tabularnewline
23 & -0.021396 & -0.1657 & 0.434463 \tabularnewline
24 & -0.051311 & -0.3975 & 0.346221 \tabularnewline
25 & -0.073725 & -0.5711 & 0.285042 \tabularnewline
26 & -0.059501 & -0.4609 & 0.323271 \tabularnewline
27 & 0.0112 & 0.0868 & 0.465578 \tabularnewline
28 & -0.034016 & -0.2635 & 0.396539 \tabularnewline
29 & -0.084126 & -0.6516 & 0.258561 \tabularnewline
30 & 0.067233 & 0.5208 & 0.302217 \tabularnewline
31 & -0.050346 & -0.39 & 0.348966 \tabularnewline
32 & -0.082753 & -0.641 & 0.26198 \tabularnewline
33 & 0.024233 & 0.1877 & 0.425869 \tabularnewline
34 & 0.034159 & 0.2646 & 0.396113 \tabularnewline
35 & -0.047368 & -0.3669 & 0.357488 \tabularnewline
36 & -0.019067 & -0.1477 & 0.441542 \tabularnewline
37 & 0.013474 & 0.1044 & 0.458613 \tabularnewline
38 & -0.021474 & -0.1663 & 0.434226 \tabularnewline
39 & -0.031868 & -0.2468 & 0.402935 \tabularnewline
40 & 0.072752 & 0.5635 & 0.287586 \tabularnewline
41 & 0.032865 & 0.2546 & 0.399963 \tabularnewline
42 & -0.114854 & -0.8897 & 0.188602 \tabularnewline
43 & -0.06572 & -0.5091 & 0.306287 \tabularnewline
44 & -0.006995 & -0.0542 & 0.478485 \tabularnewline
45 & -0.004351 & -0.0337 & 0.486613 \tabularnewline
46 & -0.050584 & -0.3918 & 0.348288 \tabularnewline
47 & -0.045232 & -0.3504 & 0.363646 \tabularnewline
48 & -0.102692 & -0.7954 & 0.214745 \tabularnewline
49 & 0.101132 & 0.7834 & 0.218248 \tabularnewline
50 & 0.000122 & 9e-04 & 0.499624 \tabularnewline
51 & -0.015845 & -0.1227 & 0.451363 \tabularnewline
52 & 0.12291 & 0.9521 & 0.172443 \tabularnewline
53 & -0.00887 & -0.0687 & 0.472727 \tabularnewline
54 & 0.027645 & 0.2141 & 0.415584 \tabularnewline
55 & 0.059463 & 0.4606 & 0.323375 \tabularnewline
56 & 0.011349 & 0.0879 & 0.465122 \tabularnewline
57 & 0.077883 & 0.6033 & 0.274298 \tabularnewline
58 & -0.114239 & -0.8849 & 0.189874 \tabularnewline
59 & 0.050001 & 0.3873 & 0.349949 \tabularnewline
60 & NA & NA & NA \tabularnewline
\hline
\end{tabular}
%Source: https://freestatistics.org/blog/index.php?pk=35202&T=2

[TABLE]
[ROW][C]Partial Autocorrelation Function[/C][/ROW]
[ROW][C]Time lag k[/C][C]PACF(k)[/C][C]T-STAT[/C][C]P-value[/C][/ROW]
[ROW][C]1[/C][C]0.200387[/C][C]1.5522[/C][C]0.062938[/C][/ROW]
[ROW][C]2[/C][C]-0.001845[/C][C]-0.0143[/C][C]0.494324[/C][/ROW]
[ROW][C]3[/C][C]0.285198[/C][C]2.2091[/C][C]0.015497[/C][/ROW]
[ROW][C]4[/C][C]-0.118303[/C][C]-0.9164[/C][C]0.181571[/C][/ROW]
[ROW][C]5[/C][C]0.186031[/C][C]1.441[/C][C]0.077393[/C][/ROW]
[ROW][C]6[/C][C]0.432154[/C][C]3.3475[/C][C]0.000706[/C][/ROW]
[ROW][C]7[/C][C]-0.095658[/C][C]-0.741[/C][C]0.230803[/C][/ROW]
[ROW][C]8[/C][C]-0.196167[/C][C]-1.5195[/C][C]0.066945[/C][/ROW]
[ROW][C]9[/C][C]0.052086[/C][C]0.4035[/C][C]0.344024[/C][/ROW]
[ROW][C]10[/C][C]-0.101664[/C][C]-0.7875[/C][C]0.21705[/C][/ROW]
[ROW][C]11[/C][C]0.05298[/C][C]0.4104[/C][C]0.341494[/C][/ROW]
[ROW][C]12[/C][C]0.554547[/C][C]4.2955[/C][C]3.2e-05[/C][/ROW]
[ROW][C]13[/C][C]-0.246682[/C][C]-1.9108[/C][C]0.030406[/C][/ROW]
[ROW][C]14[/C][C]-0.02399[/C][C]-0.1858[/C][C]0.426605[/C][/ROW]
[ROW][C]15[/C][C]-0.166381[/C][C]-1.2888[/C][C]0.10121[/C][/ROW]
[ROW][C]16[/C][C]-0.067529[/C][C]-0.5231[/C][C]0.301422[/C][/ROW]
[ROW][C]17[/C][C]-0.087548[/C][C]-0.6781[/C][C]0.250143[/C][/ROW]
[ROW][C]18[/C][C]-0.221786[/C][C]-1.7179[/C][C]0.045482[/C][/ROW]
[ROW][C]19[/C][C]0.128351[/C][C]0.9942[/C][C]0.162059[/C][/ROW]
[ROW][C]20[/C][C]0.133287[/C][C]1.0324[/C][C]0.153006[/C][/ROW]
[ROW][C]21[/C][C]-0.130523[/C][C]-1.011[/C][C]0.158032[/C][/ROW]
[ROW][C]22[/C][C]0.070419[/C][C]0.5455[/C][C]0.293729[/C][/ROW]
[ROW][C]23[/C][C]-0.021396[/C][C]-0.1657[/C][C]0.434463[/C][/ROW]
[ROW][C]24[/C][C]-0.051311[/C][C]-0.3975[/C][C]0.346221[/C][/ROW]
[ROW][C]25[/C][C]-0.073725[/C][C]-0.5711[/C][C]0.285042[/C][/ROW]
[ROW][C]26[/C][C]-0.059501[/C][C]-0.4609[/C][C]0.323271[/C][/ROW]
[ROW][C]27[/C][C]0.0112[/C][C]0.0868[/C][C]0.465578[/C][/ROW]
[ROW][C]28[/C][C]-0.034016[/C][C]-0.2635[/C][C]0.396539[/C][/ROW]
[ROW][C]29[/C][C]-0.084126[/C][C]-0.6516[/C][C]0.258561[/C][/ROW]
[ROW][C]30[/C][C]0.067233[/C][C]0.5208[/C][C]0.302217[/C][/ROW]
[ROW][C]31[/C][C]-0.050346[/C][C]-0.39[/C][C]0.348966[/C][/ROW]
[ROW][C]32[/C][C]-0.082753[/C][C]-0.641[/C][C]0.26198[/C][/ROW]
[ROW][C]33[/C][C]0.024233[/C][C]0.1877[/C][C]0.425869[/C][/ROW]
[ROW][C]34[/C][C]0.034159[/C][C]0.2646[/C][C]0.396113[/C][/ROW]
[ROW][C]35[/C][C]-0.047368[/C][C]-0.3669[/C][C]0.357488[/C][/ROW]
[ROW][C]36[/C][C]-0.019067[/C][C]-0.1477[/C][C]0.441542[/C][/ROW]
[ROW][C]37[/C][C]0.013474[/C][C]0.1044[/C][C]0.458613[/C][/ROW]
[ROW][C]38[/C][C]-0.021474[/C][C]-0.1663[/C][C]0.434226[/C][/ROW]
[ROW][C]39[/C][C]-0.031868[/C][C]-0.2468[/C][C]0.402935[/C][/ROW]
[ROW][C]40[/C][C]0.072752[/C][C]0.5635[/C][C]0.287586[/C][/ROW]
[ROW][C]41[/C][C]0.032865[/C][C]0.2546[/C][C]0.399963[/C][/ROW]
[ROW][C]42[/C][C]-0.114854[/C][C]-0.8897[/C][C]0.188602[/C][/ROW]
[ROW][C]43[/C][C]-0.06572[/C][C]-0.5091[/C][C]0.306287[/C][/ROW]
[ROW][C]44[/C][C]-0.006995[/C][C]-0.0542[/C][C]0.478485[/C][/ROW]
[ROW][C]45[/C][C]-0.004351[/C][C]-0.0337[/C][C]0.486613[/C][/ROW]
[ROW][C]46[/C][C]-0.050584[/C][C]-0.3918[/C][C]0.348288[/C][/ROW]
[ROW][C]47[/C][C]-0.045232[/C][C]-0.3504[/C][C]0.363646[/C][/ROW]
[ROW][C]48[/C][C]-0.102692[/C][C]-0.7954[/C][C]0.214745[/C][/ROW]
[ROW][C]49[/C][C]0.101132[/C][C]0.7834[/C][C]0.218248[/C][/ROW]
[ROW][C]50[/C][C]0.000122[/C][C]9e-04[/C][C]0.499624[/C][/ROW]
[ROW][C]51[/C][C]-0.015845[/C][C]-0.1227[/C][C]0.451363[/C][/ROW]
[ROW][C]52[/C][C]0.12291[/C][C]0.9521[/C][C]0.172443[/C][/ROW]
[ROW][C]53[/C][C]-0.00887[/C][C]-0.0687[/C][C]0.472727[/C][/ROW]
[ROW][C]54[/C][C]0.027645[/C][C]0.2141[/C][C]0.415584[/C][/ROW]
[ROW][C]55[/C][C]0.059463[/C][C]0.4606[/C][C]0.323375[/C][/ROW]
[ROW][C]56[/C][C]0.011349[/C][C]0.0879[/C][C]0.465122[/C][/ROW]
[ROW][C]57[/C][C]0.077883[/C][C]0.6033[/C][C]0.274298[/C][/ROW]
[ROW][C]58[/C][C]-0.114239[/C][C]-0.8849[/C][C]0.189874[/C][/ROW]
[ROW][C]59[/C][C]0.050001[/C][C]0.3873[/C][C]0.349949[/C][/ROW]
[ROW][C]60[/C][C]NA[/C][C]NA[/C][C]NA[/C][/ROW]
[/TABLE]
Source: https://freestatistics.org/blog/index.php?pk=35202&T=2

Globally Unique Identifier (entire table): ba.freestatistics.org/blog/index.php?pk=35202&T=2

As an alternative you can also use a QR Code:  

The GUIDs for individual cells are displayed in the table below:

Partial Autocorrelation Function
Time lag kPACF(k)T-STATP-value
10.2003871.55220.062938
2-0.001845-0.01430.494324
30.2851982.20910.015497
4-0.118303-0.91640.181571
50.1860311.4410.077393
60.4321543.34750.000706
7-0.095658-0.7410.230803
8-0.196167-1.51950.066945
90.0520860.40350.344024
10-0.101664-0.78750.21705
110.052980.41040.341494
120.5545474.29553.2e-05
13-0.246682-1.91080.030406
14-0.02399-0.18580.426605
15-0.166381-1.28880.10121
16-0.067529-0.52310.301422
17-0.087548-0.67810.250143
18-0.221786-1.71790.045482
190.1283510.99420.162059
200.1332871.03240.153006
21-0.130523-1.0110.158032
220.0704190.54550.293729
23-0.021396-0.16570.434463
24-0.051311-0.39750.346221
25-0.073725-0.57110.285042
26-0.059501-0.46090.323271
270.01120.08680.465578
28-0.034016-0.26350.396539
29-0.084126-0.65160.258561
300.0672330.52080.302217
31-0.050346-0.390.348966
32-0.082753-0.6410.26198
330.0242330.18770.425869
340.0341590.26460.396113
35-0.047368-0.36690.357488
36-0.019067-0.14770.441542
370.0134740.10440.458613
38-0.021474-0.16630.434226
39-0.031868-0.24680.402935
400.0727520.56350.287586
410.0328650.25460.399963
42-0.114854-0.88970.188602
43-0.06572-0.50910.306287
44-0.006995-0.05420.478485
45-0.004351-0.03370.486613
46-0.050584-0.39180.348288
47-0.045232-0.35040.363646
48-0.102692-0.79540.214745
490.1011320.78340.218248
500.0001229e-040.499624
51-0.015845-0.12270.451363
520.122910.95210.172443
53-0.00887-0.06870.472727
540.0276450.21410.415584
550.0594630.46060.323375
560.0113490.08790.465122
570.0778830.60330.274298
58-0.114239-0.88490.189874
590.0500010.38730.349949
60NANANA


Parameters (Session):
par1 = 60 ; par2 = 1 ; par3 = 0 ; par4 = 0 ; par5 = 12 ;
Parameters (R input):
par1 = 60 ; par2 = 1 ; par3 = 0 ; par4 = 0 ; par5 = 12 ;
R code (references can be found in the software module):
if (par1 == 'Default') {
par1 = 10*log10(length(x))
} else {
par1 <- as.numeric(par1)
}
par2 <- as.numeric(par2)
par3 <- as.numeric(par3)
par4 <- as.numeric(par4)
par5 <- as.numeric(par5)
if (par2 == 0) {
x <- log(x)
} else {
x <- (x ^ par2 - 1) / par2
}
if (par3 > 0) x <- diff(x,lag=1,difference=par3)
if (par4 > 0) x <- diff(x,lag=par5,difference=par4)
bitmap(file='pic1.png')
racf <- acf(x,par1,main='Autocorrelation',xlab='lags',ylab='ACF')
dev.off()
bitmap(file='pic2.png')
rpacf <- pacf(x,par1,main='Partial Autocorrelation',xlab='lags',ylab='PACF')
dev.off()
(myacf <- c(racf$acf))
(mypacf <- c(rpacf$acf))
lengthx <- length(x)
sqrtn <- sqrt(lengthx)
load(file='createtable')
a<-table.start()
a<-table.row.start(a)
a<-table.element(a,'Autocorrelation Function',4,TRUE)
a<-table.row.end(a)
a<-table.row.start(a)
a<-table.element(a,'Time lag k',header=TRUE)
a<-table.element(a,hyperlink('basics.htm','ACF(k)','click here for more information about the Autocorrelation Function'),header=TRUE)
a<-table.element(a,'T-STAT',header=TRUE)
a<-table.element(a,'P-value',header=TRUE)
a<-table.row.end(a)
for (i in 2:(par1+1)) {
a<-table.row.start(a)
a<-table.element(a,i-1,header=TRUE)
a<-table.element(a,round(myacf[i],6))
mytstat <- myacf[i]*sqrtn
a<-table.element(a,round(mytstat,4))
a<-table.element(a,round(1-pt(abs(mytstat),lengthx),6))
a<-table.row.end(a)
}
a<-table.end(a)
table.save(a,file='mytable.tab')
a<-table.start()
a<-table.row.start(a)
a<-table.element(a,'Partial Autocorrelation Function',4,TRUE)
a<-table.row.end(a)
a<-table.row.start(a)
a<-table.element(a,'Time lag k',header=TRUE)
a<-table.element(a,hyperlink('basics.htm','PACF(k)','click here for more information about the Partial Autocorrelation Function'),header=TRUE)
a<-table.element(a,'T-STAT',header=TRUE)
a<-table.element(a,'P-value',header=TRUE)
a<-table.row.end(a)
for (i in 1:par1) {
a<-table.row.start(a)
a<-table.element(a,i,header=TRUE)
a<-table.element(a,round(mypacf[i],6))
mytstat <- mypacf[i]*sqrtn
a<-table.element(a,round(mytstat,4))
a<-table.element(a,round(1-pt(abs(mytstat),lengthx),6))
a<-table.row.end(a)
}
a<-table.end(a)
table.save(a,file='mytable1.tab')