Free Statistics

of Irreproducible Research!

Author's title

Author*Unverified author*
R Software Modulerwasp_cross.wasp
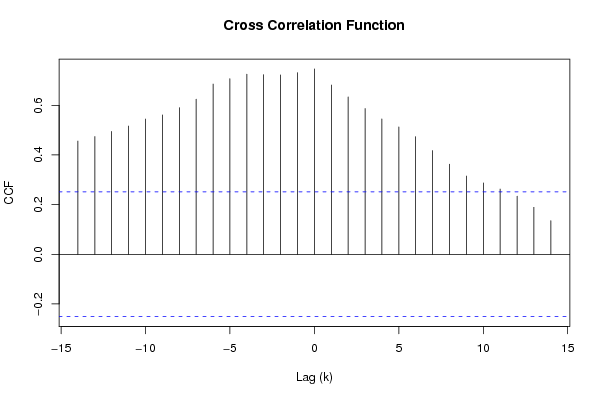
Title produced by softwareCross Correlation Function
Date of computationFri, 19 Dec 2008 08:57:49 -0700
Cite this page as followsStatistical Computations at FreeStatistics.org, Office for Research Development and Education, URL https://freestatistics.org/blog/index.php?v=date/2008/Dec/19/t1229702291lyywojo798ggz70.htm/, Retrieved Thu, 16 May 2024 00:13:12 +0000
Statistical Computations at FreeStatistics.org, Office for Research Development and Education, URL https://freestatistics.org/blog/index.php?pk=35198, Retrieved Thu, 16 May 2024 00:13:12 +0000
QR Codes:

Original text written by user:
IsPrivate?No (this computation is public)
User-defined keywords
Estimated Impact158
Family? (F = Feedback message, R = changed R code, M = changed R Module, P = changed Parameters, D = changed Data)
-       [Cross Correlation Function] [] [2008-12-19 15:57:49] [e02910eed3830f1815f587e12f46cbdb] [Current]
Feedback Forum

Post a new message
Dataseries X:
6.3
6.1
6.1
6.3
6.3
6
6.2
6.4
6.8
7.5
7.5
7.6
7.6
7.4
7.3
7.1
6.9
6.8
7.5
7.6
7.8
8
8.1
8.2
8.3
8.2
8
7.9
7.6
7.6
8.2
8.3
8.4
8.4
8.4
8.6
8.9
8.8
8.3
7.5
7.2
7.5
8.8
9.3
9.3
8.7
8.2
8.3
8.5
8.6
8.6
8.2
8.1
8
8.6
8.7
8.8
8.5
8.4
8.5
8.7
Dataseries Y:
101.7
101.9
102
102.2
102.4
102.6
102.6
102.5
102.5
102.6
102.7
102.9
103.1
103.2
103.2
103
102.8
102.6
102.4
102.2
101.9
101.6
101.3
101.2
111.7
111.4
111.1
111.1
111.3
111.9
112.4
112.9
113
113
112.7
112.4
112.3
112.5
112.8
113.2
114
114.9
115.6
115.5
115
114.9
115.2
115.4
115
114.6
114.5
114.4
113.9
113.2
112.7
112.6
112.5
112.3
112
111.7
119.2


Summary of computational transaction
Raw Inputview raw input (R code)
Raw Outputview raw output of R engine
Computing time1 seconds
R Server'George Udny Yule' @ 72.249.76.132

\begin{tabular}{lllllllll}
\hline
Summary of computational transaction \tabularnewline
Raw Input & view raw input (R code)  \tabularnewline
Raw Output & view raw output of R engine  \tabularnewline
Computing time & 1 seconds \tabularnewline
R Server & 'George Udny Yule' @ 72.249.76.132 \tabularnewline
\hline
\end{tabular}
%Source: https://freestatistics.org/blog/index.php?pk=35198&T=0

[TABLE]
[ROW][C]Summary of computational transaction[/C][/ROW]
[ROW][C]Raw Input[/C][C]view raw input (R code) [/C][/ROW]
[ROW][C]Raw Output[/C][C]view raw output of R engine [/C][/ROW]
[ROW][C]Computing time[/C][C]1 seconds[/C][/ROW]
[ROW][C]R Server[/C][C]'George Udny Yule' @ 72.249.76.132[/C][/ROW]
[/TABLE]
Source: https://freestatistics.org/blog/index.php?pk=35198&T=0

Globally Unique Identifier (entire table): ba.freestatistics.org/blog/index.php?pk=35198&T=0

As an alternative you can also use a QR Code:  

The GUIDs for individual cells are displayed in the table below:

Summary of computational transaction
Raw Inputview raw input (R code)
Raw Outputview raw output of R engine
Computing time1 seconds
R Server'George Udny Yule' @ 72.249.76.132


Cross Correlation Function
ParameterValue
Box-Cox transformation parameter (lambda) of X series1
Degree of non-seasonal differencing (d) of X series0
Degree of seasonal differencing (D) of X series0
Seasonal Period (s)12
Box-Cox transformation parameter (lambda) of Y series1
Degree of non-seasonal differencing (d) of Y series0
Degree of seasonal differencing (D) of Y series0
krho(Y[t],X[t+k])
-140.456109344678839
-130.473957885903127
-120.494519461343808
-110.516248933418593
-100.544241638770078
-90.560897019126289
-80.590157529673498
-70.62437327520218
-60.685304225595644
-50.706955034032832
-40.724800130134307
-30.722794428578824
-20.72213002817244
-10.730955218558505
00.746115415613238
10.681510241738146
20.633377922600425
30.586724709524382
40.544876294400249
50.512898730326698
60.473355102365442
70.417572313831063
80.362840287755096
90.31507028070003
100.287172890413079
110.262827421747842
120.233924629786202
130.189002590924429
140.135313288686974

\begin{tabular}{lllllllll}
\hline
Cross Correlation Function \tabularnewline
Parameter & Value \tabularnewline
Box-Cox transformation parameter (lambda) of X series & 1 \tabularnewline
Degree of non-seasonal differencing (d) of X series & 0 \tabularnewline
Degree of seasonal differencing (D) of X series & 0 \tabularnewline
Seasonal Period (s) & 12 \tabularnewline
Box-Cox transformation parameter (lambda) of Y series & 1 \tabularnewline
Degree of non-seasonal differencing (d) of Y series & 0 \tabularnewline
Degree of seasonal differencing (D) of Y series & 0 \tabularnewline
k & rho(Y[t],X[t+k]) \tabularnewline
-14 & 0.456109344678839 \tabularnewline
-13 & 0.473957885903127 \tabularnewline
-12 & 0.494519461343808 \tabularnewline
-11 & 0.516248933418593 \tabularnewline
-10 & 0.544241638770078 \tabularnewline
-9 & 0.560897019126289 \tabularnewline
-8 & 0.590157529673498 \tabularnewline
-7 & 0.62437327520218 \tabularnewline
-6 & 0.685304225595644 \tabularnewline
-5 & 0.706955034032832 \tabularnewline
-4 & 0.724800130134307 \tabularnewline
-3 & 0.722794428578824 \tabularnewline
-2 & 0.72213002817244 \tabularnewline
-1 & 0.730955218558505 \tabularnewline
0 & 0.746115415613238 \tabularnewline
1 & 0.681510241738146 \tabularnewline
2 & 0.633377922600425 \tabularnewline
3 & 0.586724709524382 \tabularnewline
4 & 0.544876294400249 \tabularnewline
5 & 0.512898730326698 \tabularnewline
6 & 0.473355102365442 \tabularnewline
7 & 0.417572313831063 \tabularnewline
8 & 0.362840287755096 \tabularnewline
9 & 0.31507028070003 \tabularnewline
10 & 0.287172890413079 \tabularnewline
11 & 0.262827421747842 \tabularnewline
12 & 0.233924629786202 \tabularnewline
13 & 0.189002590924429 \tabularnewline
14 & 0.135313288686974 \tabularnewline
\hline
\end{tabular}
%Source: https://freestatistics.org/blog/index.php?pk=35198&T=1

[TABLE]
[ROW][C]Cross Correlation Function[/C][/ROW]
[ROW][C]Parameter[/C][C]Value[/C][/ROW]
[ROW][C]Box-Cox transformation parameter (lambda) of X series[/C][C]1[/C][/ROW]
[ROW][C]Degree of non-seasonal differencing (d) of X series[/C][C]0[/C][/ROW]
[ROW][C]Degree of seasonal differencing (D) of X series[/C][C]0[/C][/ROW]
[ROW][C]Seasonal Period (s)[/C][C]12[/C][/ROW]
[ROW][C]Box-Cox transformation parameter (lambda) of Y series[/C][C]1[/C][/ROW]
[ROW][C]Degree of non-seasonal differencing (d) of Y series[/C][C]0[/C][/ROW]
[ROW][C]Degree of seasonal differencing (D) of Y series[/C][C]0[/C][/ROW]
[ROW][C]k[/C][C]rho(Y[t],X[t+k])[/C][/ROW]
[ROW][C]-14[/C][C]0.456109344678839[/C][/ROW]
[ROW][C]-13[/C][C]0.473957885903127[/C][/ROW]
[ROW][C]-12[/C][C]0.494519461343808[/C][/ROW]
[ROW][C]-11[/C][C]0.516248933418593[/C][/ROW]
[ROW][C]-10[/C][C]0.544241638770078[/C][/ROW]
[ROW][C]-9[/C][C]0.560897019126289[/C][/ROW]
[ROW][C]-8[/C][C]0.590157529673498[/C][/ROW]
[ROW][C]-7[/C][C]0.62437327520218[/C][/ROW]
[ROW][C]-6[/C][C]0.685304225595644[/C][/ROW]
[ROW][C]-5[/C][C]0.706955034032832[/C][/ROW]
[ROW][C]-4[/C][C]0.724800130134307[/C][/ROW]
[ROW][C]-3[/C][C]0.722794428578824[/C][/ROW]
[ROW][C]-2[/C][C]0.72213002817244[/C][/ROW]
[ROW][C]-1[/C][C]0.730955218558505[/C][/ROW]
[ROW][C]0[/C][C]0.746115415613238[/C][/ROW]
[ROW][C]1[/C][C]0.681510241738146[/C][/ROW]
[ROW][C]2[/C][C]0.633377922600425[/C][/ROW]
[ROW][C]3[/C][C]0.586724709524382[/C][/ROW]
[ROW][C]4[/C][C]0.544876294400249[/C][/ROW]
[ROW][C]5[/C][C]0.512898730326698[/C][/ROW]
[ROW][C]6[/C][C]0.473355102365442[/C][/ROW]
[ROW][C]7[/C][C]0.417572313831063[/C][/ROW]
[ROW][C]8[/C][C]0.362840287755096[/C][/ROW]
[ROW][C]9[/C][C]0.31507028070003[/C][/ROW]
[ROW][C]10[/C][C]0.287172890413079[/C][/ROW]
[ROW][C]11[/C][C]0.262827421747842[/C][/ROW]
[ROW][C]12[/C][C]0.233924629786202[/C][/ROW]
[ROW][C]13[/C][C]0.189002590924429[/C][/ROW]
[ROW][C]14[/C][C]0.135313288686974[/C][/ROW]
[/TABLE]
Source: https://freestatistics.org/blog/index.php?pk=35198&T=1

Globally Unique Identifier (entire table): ba.freestatistics.org/blog/index.php?pk=35198&T=1

As an alternative you can also use a QR Code:  

The GUIDs for individual cells are displayed in the table below:

Cross Correlation Function
ParameterValue
Box-Cox transformation parameter (lambda) of X series1
Degree of non-seasonal differencing (d) of X series0
Degree of seasonal differencing (D) of X series0
Seasonal Period (s)12
Box-Cox transformation parameter (lambda) of Y series1
Degree of non-seasonal differencing (d) of Y series0
Degree of seasonal differencing (D) of Y series0
krho(Y[t],X[t+k])
-140.456109344678839
-130.473957885903127
-120.494519461343808
-110.516248933418593
-100.544241638770078
-90.560897019126289
-80.590157529673498
-70.62437327520218
-60.685304225595644
-50.706955034032832
-40.724800130134307
-30.722794428578824
-20.72213002817244
-10.730955218558505
00.746115415613238
10.681510241738146
20.633377922600425
30.586724709524382
40.544876294400249
50.512898730326698
60.473355102365442
70.417572313831063
80.362840287755096
90.31507028070003
100.287172890413079
110.262827421747842
120.233924629786202
130.189002590924429
140.135313288686974


Parameters (Session):
par1 = 1 ; par2 = 0 ; par3 = 0 ; par4 = 12 ; par5 = 1 ; par6 = 0 ; par7 = 0 ;
Parameters (R input):
par1 = 1 ; par2 = 0 ; par3 = 0 ; par4 = 12 ; par5 = 1 ; par6 = 0 ; par7 = 0 ;
R code (references can be found in the software module):
par1 <- as.numeric(par1)
par2 <- as.numeric(par2)
par3 <- as.numeric(par3)
par4 <- as.numeric(par4)
par5 <- as.numeric(par5)
par6 <- as.numeric(par6)
par7 <- as.numeric(par7)
if (par1 == 0) {
x <- log(x)
} else {
x <- (x ^ par1 - 1) / par1
}
if (par5 == 0) {
y <- log(y)
} else {
y <- (y ^ par5 - 1) / par5
}
if (par2 > 0) x <- diff(x,lag=1,difference=par2)
if (par6 > 0) y <- diff(y,lag=1,difference=par6)
if (par3 > 0) x <- diff(x,lag=par4,difference=par3)
if (par7 > 0) y <- diff(y,lag=par4,difference=par7)
x
y
bitmap(file='test1.png')
(r <- ccf(x,y,main='Cross Correlation Function',ylab='CCF',xlab='Lag (k)'))
dev.off()
load(file='createtable')
a<-table.start()
a<-table.row.start(a)
a<-table.element(a,'Cross Correlation Function',2,TRUE)
a<-table.row.end(a)
a<-table.row.start(a)
a<-table.element(a,'Parameter',header=TRUE)
a<-table.element(a,'Value',header=TRUE)
a<-table.row.end(a)
a<-table.row.start(a)
a<-table.element(a,'Box-Cox transformation parameter (lambda) of X series',header=TRUE)
a<-table.element(a,par1)
a<-table.row.end(a)
a<-table.row.start(a)
a<-table.element(a,'Degree of non-seasonal differencing (d) of X series',header=TRUE)
a<-table.element(a,par2)
a<-table.row.end(a)
a<-table.row.start(a)
a<-table.element(a,'Degree of seasonal differencing (D) of X series',header=TRUE)
a<-table.element(a,par3)
a<-table.row.end(a)
a<-table.row.start(a)
a<-table.element(a,'Seasonal Period (s)',header=TRUE)
a<-table.element(a,par4)
a<-table.row.end(a)
a<-table.row.start(a)
a<-table.element(a,'Box-Cox transformation parameter (lambda) of Y series',header=TRUE)
a<-table.element(a,par5)
a<-table.row.end(a)
a<-table.row.start(a)
a<-table.element(a,'Degree of non-seasonal differencing (d) of Y series',header=TRUE)
a<-table.element(a,par6)
a<-table.row.end(a)
a<-table.row.start(a)
a<-table.element(a,'Degree of seasonal differencing (D) of Y series',header=TRUE)
a<-table.element(a,par7)
a<-table.row.end(a)
a<-table.row.start(a)
a<-table.element(a,'k',header=TRUE)
a<-table.element(a,'rho(Y[t],X[t+k])',header=TRUE)
a<-table.row.end(a)
mylength <- length(r$acf)
myhalf <- floor((mylength-1)/2)
for (i in 1:mylength) {
a<-table.row.start(a)
a<-table.element(a,i-myhalf-1,header=TRUE)
a<-table.element(a,r$acf[i])
a<-table.row.end(a)
}
a<-table.end(a)
table.save(a,file='mytable.tab')