Free Statistics

of Irreproducible Research!

Author's title

Author*The author of this computation has been verified*
R Software Modulerwasp_autocorrelation.wasp
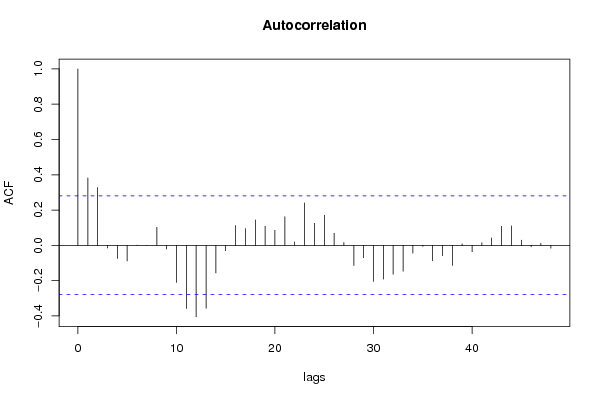
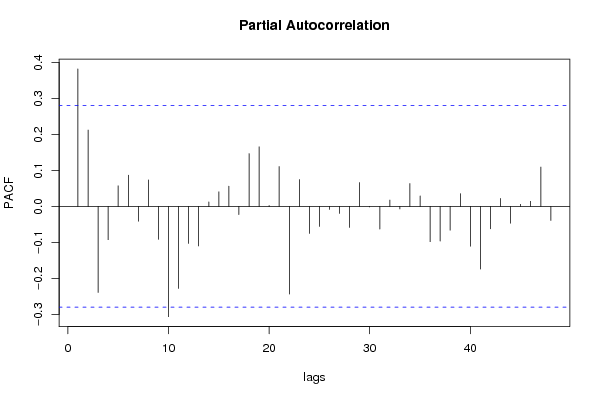
Title produced by software(Partial) Autocorrelation Function
Date of computationFri, 19 Dec 2008 08:15:09 -0700
Cite this page as followsStatistical Computations at FreeStatistics.org, Office for Research Development and Education, URL https://freestatistics.org/blog/index.php?v=date/2008/Dec/19/t1229699752dhe01k7cxmfl5uq.htm/, Retrieved Wed, 15 May 2024 00:22:01 +0000
Statistical Computations at FreeStatistics.org, Office for Research Development and Education, URL https://freestatistics.org/blog/index.php?pk=35173, Retrieved Wed, 15 May 2024 00:22:01 +0000
QR Codes:

Original text written by user:
IsPrivate?No (this computation is public)
User-defined keywords
Estimated Impact184
Family? (F = Feedback message, R = changed R code, M = changed R Module, P = changed Parameters, D = changed Data)
-     [(Partial) Autocorrelation Function] [ACF PAPER] [2008-12-19 15:11:04] [82d201ca7b4e7cd2c6f885d29b5b6937]
-   P     [(Partial) Autocorrelation Function] [ACF paper] [2008-12-19 15:15:09] [00a0a665d7a07edd2e460056b0c0c354] [Current]
Feedback Forum

Post a new message
Dataseries X:
17704
15548
28029
29383
36438
32034
22679
24319
18004
17537
20366
22782
19169
13807
29743
25591
29096
26482
22405
27044
17970
18730
19684
19785
18479
10698
31956
29506
34506
27165
26736
23691
18157
17328
18205
20995
17382
9367
31124
26551
30651
25859
25100
25778
20418
18688
20424
24776
19814
12738
31566
30111
30019
31934
25826
26835
20205
17789
20520
22518
15572


Summary of computational transaction
Raw Inputview raw input (R code)
Raw Outputview raw output of R engine
Computing time1 seconds
R Server'Gwilym Jenkins' @ 72.249.127.135

\begin{tabular}{lllllllll}
\hline
Summary of computational transaction \tabularnewline
Raw Input & view raw input (R code)  \tabularnewline
Raw Output & view raw output of R engine  \tabularnewline
Computing time & 1 seconds \tabularnewline
R Server & 'Gwilym Jenkins' @ 72.249.127.135 \tabularnewline
\hline
\end{tabular}
%Source: https://freestatistics.org/blog/index.php?pk=35173&T=0

[TABLE]
[ROW][C]Summary of computational transaction[/C][/ROW]
[ROW][C]Raw Input[/C][C]view raw input (R code) [/C][/ROW]
[ROW][C]Raw Output[/C][C]view raw output of R engine [/C][/ROW]
[ROW][C]Computing time[/C][C]1 seconds[/C][/ROW]
[ROW][C]R Server[/C][C]'Gwilym Jenkins' @ 72.249.127.135[/C][/ROW]
[/TABLE]
Source: https://freestatistics.org/blog/index.php?pk=35173&T=0

Globally Unique Identifier (entire table): ba.freestatistics.org/blog/index.php?pk=35173&T=0

As an alternative you can also use a QR Code:  

The GUIDs for individual cells are displayed in the table below:

Summary of computational transaction
Raw Inputview raw input (R code)
Raw Outputview raw output of R engine
Computing time1 seconds
R Server'Gwilym Jenkins' @ 72.249.127.135


Autocorrelation Function
Time lag kACF(k)T-STATP-value
10.382192.67530.00506
20.3274052.29180.013126
3-0.015264-0.10680.457673
4-0.074624-0.52240.301884
5-0.088615-0.62030.268966
60.0010440.00730.4971
7-0.000238-0.00170.499339
80.101890.71320.239543
9-0.021047-0.14730.441739
10-0.210565-1.4740.073445
11-0.358957-2.51270.007661
12-0.404546-2.83180.003349
13-0.35705-2.49930.007921
14-0.156493-1.09550.139337
15-0.03026-0.21180.416563
160.1117160.7820.218986
170.0951120.66580.254336
180.1439591.00770.159271
190.1077350.75410.227185
200.0853450.59740.276491
210.162431.1370.130532
220.0191340.13390.447
230.2400811.68060.049606
240.1247540.87330.193385
250.1707081.1950.118928
260.0680860.47660.317881
270.0156850.10980.456509
28-0.11418-0.79930.213999
29-0.070088-0.49060.312943
30-0.204662-1.43260.079156
31-0.191635-1.34140.09298
32-0.164104-1.14870.128122
33-0.146797-1.02760.154596
34-0.043975-0.30780.379759
35-0.005381-0.03770.485054
36-0.087051-0.60940.272553
37-0.059215-0.41450.340158
38-0.113974-0.79780.214413
390.0081320.05690.477418
40-0.035922-0.25150.401259
410.0148450.10390.458831
420.0414650.29030.386423
430.1075630.75290.227545
440.1099680.76980.222563
450.0289240.20250.420194
46-0.008275-0.05790.477022
470.0111270.07790.469118
48-0.01638-0.11470.45459
49NANANA
50NANANA
51NANANA
52NANANA
53NANANA
54NANANA
55NANANA
56NANANA
57NANANA
58NANANA
59NANANA
60NANANA

\begin{tabular}{lllllllll}
\hline
Autocorrelation Function \tabularnewline
Time lag k & ACF(k) & T-STAT & P-value \tabularnewline
1 & 0.38219 & 2.6753 & 0.00506 \tabularnewline
2 & 0.327405 & 2.2918 & 0.013126 \tabularnewline
3 & -0.015264 & -0.1068 & 0.457673 \tabularnewline
4 & -0.074624 & -0.5224 & 0.301884 \tabularnewline
5 & -0.088615 & -0.6203 & 0.268966 \tabularnewline
6 & 0.001044 & 0.0073 & 0.4971 \tabularnewline
7 & -0.000238 & -0.0017 & 0.499339 \tabularnewline
8 & 0.10189 & 0.7132 & 0.239543 \tabularnewline
9 & -0.021047 & -0.1473 & 0.441739 \tabularnewline
10 & -0.210565 & -1.474 & 0.073445 \tabularnewline
11 & -0.358957 & -2.5127 & 0.007661 \tabularnewline
12 & -0.404546 & -2.8318 & 0.003349 \tabularnewline
13 & -0.35705 & -2.4993 & 0.007921 \tabularnewline
14 & -0.156493 & -1.0955 & 0.139337 \tabularnewline
15 & -0.03026 & -0.2118 & 0.416563 \tabularnewline
16 & 0.111716 & 0.782 & 0.218986 \tabularnewline
17 & 0.095112 & 0.6658 & 0.254336 \tabularnewline
18 & 0.143959 & 1.0077 & 0.159271 \tabularnewline
19 & 0.107735 & 0.7541 & 0.227185 \tabularnewline
20 & 0.085345 & 0.5974 & 0.276491 \tabularnewline
21 & 0.16243 & 1.137 & 0.130532 \tabularnewline
22 & 0.019134 & 0.1339 & 0.447 \tabularnewline
23 & 0.240081 & 1.6806 & 0.049606 \tabularnewline
24 & 0.124754 & 0.8733 & 0.193385 \tabularnewline
25 & 0.170708 & 1.195 & 0.118928 \tabularnewline
26 & 0.068086 & 0.4766 & 0.317881 \tabularnewline
27 & 0.015685 & 0.1098 & 0.456509 \tabularnewline
28 & -0.11418 & -0.7993 & 0.213999 \tabularnewline
29 & -0.070088 & -0.4906 & 0.312943 \tabularnewline
30 & -0.204662 & -1.4326 & 0.079156 \tabularnewline
31 & -0.191635 & -1.3414 & 0.09298 \tabularnewline
32 & -0.164104 & -1.1487 & 0.128122 \tabularnewline
33 & -0.146797 & -1.0276 & 0.154596 \tabularnewline
34 & -0.043975 & -0.3078 & 0.379759 \tabularnewline
35 & -0.005381 & -0.0377 & 0.485054 \tabularnewline
36 & -0.087051 & -0.6094 & 0.272553 \tabularnewline
37 & -0.059215 & -0.4145 & 0.340158 \tabularnewline
38 & -0.113974 & -0.7978 & 0.214413 \tabularnewline
39 & 0.008132 & 0.0569 & 0.477418 \tabularnewline
40 & -0.035922 & -0.2515 & 0.401259 \tabularnewline
41 & 0.014845 & 0.1039 & 0.458831 \tabularnewline
42 & 0.041465 & 0.2903 & 0.386423 \tabularnewline
43 & 0.107563 & 0.7529 & 0.227545 \tabularnewline
44 & 0.109968 & 0.7698 & 0.222563 \tabularnewline
45 & 0.028924 & 0.2025 & 0.420194 \tabularnewline
46 & -0.008275 & -0.0579 & 0.477022 \tabularnewline
47 & 0.011127 & 0.0779 & 0.469118 \tabularnewline
48 & -0.01638 & -0.1147 & 0.45459 \tabularnewline
49 & NA & NA & NA \tabularnewline
50 & NA & NA & NA \tabularnewline
51 & NA & NA & NA \tabularnewline
52 & NA & NA & NA \tabularnewline
53 & NA & NA & NA \tabularnewline
54 & NA & NA & NA \tabularnewline
55 & NA & NA & NA \tabularnewline
56 & NA & NA & NA \tabularnewline
57 & NA & NA & NA \tabularnewline
58 & NA & NA & NA \tabularnewline
59 & NA & NA & NA \tabularnewline
60 & NA & NA & NA \tabularnewline
\hline
\end{tabular}
%Source: https://freestatistics.org/blog/index.php?pk=35173&T=1

[TABLE]
[ROW][C]Autocorrelation Function[/C][/ROW]
[ROW][C]Time lag k[/C][C]ACF(k)[/C][C]T-STAT[/C][C]P-value[/C][/ROW]
[ROW][C]1[/C][C]0.38219[/C][C]2.6753[/C][C]0.00506[/C][/ROW]
[ROW][C]2[/C][C]0.327405[/C][C]2.2918[/C][C]0.013126[/C][/ROW]
[ROW][C]3[/C][C]-0.015264[/C][C]-0.1068[/C][C]0.457673[/C][/ROW]
[ROW][C]4[/C][C]-0.074624[/C][C]-0.5224[/C][C]0.301884[/C][/ROW]
[ROW][C]5[/C][C]-0.088615[/C][C]-0.6203[/C][C]0.268966[/C][/ROW]
[ROW][C]6[/C][C]0.001044[/C][C]0.0073[/C][C]0.4971[/C][/ROW]
[ROW][C]7[/C][C]-0.000238[/C][C]-0.0017[/C][C]0.499339[/C][/ROW]
[ROW][C]8[/C][C]0.10189[/C][C]0.7132[/C][C]0.239543[/C][/ROW]
[ROW][C]9[/C][C]-0.021047[/C][C]-0.1473[/C][C]0.441739[/C][/ROW]
[ROW][C]10[/C][C]-0.210565[/C][C]-1.474[/C][C]0.073445[/C][/ROW]
[ROW][C]11[/C][C]-0.358957[/C][C]-2.5127[/C][C]0.007661[/C][/ROW]
[ROW][C]12[/C][C]-0.404546[/C][C]-2.8318[/C][C]0.003349[/C][/ROW]
[ROW][C]13[/C][C]-0.35705[/C][C]-2.4993[/C][C]0.007921[/C][/ROW]
[ROW][C]14[/C][C]-0.156493[/C][C]-1.0955[/C][C]0.139337[/C][/ROW]
[ROW][C]15[/C][C]-0.03026[/C][C]-0.2118[/C][C]0.416563[/C][/ROW]
[ROW][C]16[/C][C]0.111716[/C][C]0.782[/C][C]0.218986[/C][/ROW]
[ROW][C]17[/C][C]0.095112[/C][C]0.6658[/C][C]0.254336[/C][/ROW]
[ROW][C]18[/C][C]0.143959[/C][C]1.0077[/C][C]0.159271[/C][/ROW]
[ROW][C]19[/C][C]0.107735[/C][C]0.7541[/C][C]0.227185[/C][/ROW]
[ROW][C]20[/C][C]0.085345[/C][C]0.5974[/C][C]0.276491[/C][/ROW]
[ROW][C]21[/C][C]0.16243[/C][C]1.137[/C][C]0.130532[/C][/ROW]
[ROW][C]22[/C][C]0.019134[/C][C]0.1339[/C][C]0.447[/C][/ROW]
[ROW][C]23[/C][C]0.240081[/C][C]1.6806[/C][C]0.049606[/C][/ROW]
[ROW][C]24[/C][C]0.124754[/C][C]0.8733[/C][C]0.193385[/C][/ROW]
[ROW][C]25[/C][C]0.170708[/C][C]1.195[/C][C]0.118928[/C][/ROW]
[ROW][C]26[/C][C]0.068086[/C][C]0.4766[/C][C]0.317881[/C][/ROW]
[ROW][C]27[/C][C]0.015685[/C][C]0.1098[/C][C]0.456509[/C][/ROW]
[ROW][C]28[/C][C]-0.11418[/C][C]-0.7993[/C][C]0.213999[/C][/ROW]
[ROW][C]29[/C][C]-0.070088[/C][C]-0.4906[/C][C]0.312943[/C][/ROW]
[ROW][C]30[/C][C]-0.204662[/C][C]-1.4326[/C][C]0.079156[/C][/ROW]
[ROW][C]31[/C][C]-0.191635[/C][C]-1.3414[/C][C]0.09298[/C][/ROW]
[ROW][C]32[/C][C]-0.164104[/C][C]-1.1487[/C][C]0.128122[/C][/ROW]
[ROW][C]33[/C][C]-0.146797[/C][C]-1.0276[/C][C]0.154596[/C][/ROW]
[ROW][C]34[/C][C]-0.043975[/C][C]-0.3078[/C][C]0.379759[/C][/ROW]
[ROW][C]35[/C][C]-0.005381[/C][C]-0.0377[/C][C]0.485054[/C][/ROW]
[ROW][C]36[/C][C]-0.087051[/C][C]-0.6094[/C][C]0.272553[/C][/ROW]
[ROW][C]37[/C][C]-0.059215[/C][C]-0.4145[/C][C]0.340158[/C][/ROW]
[ROW][C]38[/C][C]-0.113974[/C][C]-0.7978[/C][C]0.214413[/C][/ROW]
[ROW][C]39[/C][C]0.008132[/C][C]0.0569[/C][C]0.477418[/C][/ROW]
[ROW][C]40[/C][C]-0.035922[/C][C]-0.2515[/C][C]0.401259[/C][/ROW]
[ROW][C]41[/C][C]0.014845[/C][C]0.1039[/C][C]0.458831[/C][/ROW]
[ROW][C]42[/C][C]0.041465[/C][C]0.2903[/C][C]0.386423[/C][/ROW]
[ROW][C]43[/C][C]0.107563[/C][C]0.7529[/C][C]0.227545[/C][/ROW]
[ROW][C]44[/C][C]0.109968[/C][C]0.7698[/C][C]0.222563[/C][/ROW]
[ROW][C]45[/C][C]0.028924[/C][C]0.2025[/C][C]0.420194[/C][/ROW]
[ROW][C]46[/C][C]-0.008275[/C][C]-0.0579[/C][C]0.477022[/C][/ROW]
[ROW][C]47[/C][C]0.011127[/C][C]0.0779[/C][C]0.469118[/C][/ROW]
[ROW][C]48[/C][C]-0.01638[/C][C]-0.1147[/C][C]0.45459[/C][/ROW]
[ROW][C]49[/C][C]NA[/C][C]NA[/C][C]NA[/C][/ROW]
[ROW][C]50[/C][C]NA[/C][C]NA[/C][C]NA[/C][/ROW]
[ROW][C]51[/C][C]NA[/C][C]NA[/C][C]NA[/C][/ROW]
[ROW][C]52[/C][C]NA[/C][C]NA[/C][C]NA[/C][/ROW]
[ROW][C]53[/C][C]NA[/C][C]NA[/C][C]NA[/C][/ROW]
[ROW][C]54[/C][C]NA[/C][C]NA[/C][C]NA[/C][/ROW]
[ROW][C]55[/C][C]NA[/C][C]NA[/C][C]NA[/C][/ROW]
[ROW][C]56[/C][C]NA[/C][C]NA[/C][C]NA[/C][/ROW]
[ROW][C]57[/C][C]NA[/C][C]NA[/C][C]NA[/C][/ROW]
[ROW][C]58[/C][C]NA[/C][C]NA[/C][C]NA[/C][/ROW]
[ROW][C]59[/C][C]NA[/C][C]NA[/C][C]NA[/C][/ROW]
[ROW][C]60[/C][C]NA[/C][C]NA[/C][C]NA[/C][/ROW]
[/TABLE]
Source: https://freestatistics.org/blog/index.php?pk=35173&T=1

Globally Unique Identifier (entire table): ba.freestatistics.org/blog/index.php?pk=35173&T=1

As an alternative you can also use a QR Code:  

The GUIDs for individual cells are displayed in the table below:

Autocorrelation Function
Time lag kACF(k)T-STATP-value
10.382192.67530.00506
20.3274052.29180.013126
3-0.015264-0.10680.457673
4-0.074624-0.52240.301884
5-0.088615-0.62030.268966
60.0010440.00730.4971
7-0.000238-0.00170.499339
80.101890.71320.239543
9-0.021047-0.14730.441739
10-0.210565-1.4740.073445
11-0.358957-2.51270.007661
12-0.404546-2.83180.003349
13-0.35705-2.49930.007921
14-0.156493-1.09550.139337
15-0.03026-0.21180.416563
160.1117160.7820.218986
170.0951120.66580.254336
180.1439591.00770.159271
190.1077350.75410.227185
200.0853450.59740.276491
210.162431.1370.130532
220.0191340.13390.447
230.2400811.68060.049606
240.1247540.87330.193385
250.1707081.1950.118928
260.0680860.47660.317881
270.0156850.10980.456509
28-0.11418-0.79930.213999
29-0.070088-0.49060.312943
30-0.204662-1.43260.079156
31-0.191635-1.34140.09298
32-0.164104-1.14870.128122
33-0.146797-1.02760.154596
34-0.043975-0.30780.379759
35-0.005381-0.03770.485054
36-0.087051-0.60940.272553
37-0.059215-0.41450.340158
38-0.113974-0.79780.214413
390.0081320.05690.477418
40-0.035922-0.25150.401259
410.0148450.10390.458831
420.0414650.29030.386423
430.1075630.75290.227545
440.1099680.76980.222563
450.0289240.20250.420194
46-0.008275-0.05790.477022
470.0111270.07790.469118
48-0.01638-0.11470.45459
49NANANA
50NANANA
51NANANA
52NANANA
53NANANA
54NANANA
55NANANA
56NANANA
57NANANA
58NANANA
59NANANA
60NANANA


Partial Autocorrelation Function
Time lag kPACF(k)T-STATP-value
10.382192.67530.00506
20.2123541.48650.07178
3-0.239118-1.67380.050269
4-0.092297-0.64610.26062
50.0572840.4010.345087
60.0867080.6070.273342
7-0.041059-0.28740.387503
80.0736560.51560.304229
9-0.091338-0.63940.26278
10-0.306408-2.14490.018474
11-0.227994-1.5960.058464
12-0.103024-0.72120.237116
13-0.109874-0.76910.222758
140.0124840.08740.465361
150.040760.28530.3883
160.0563910.39470.347374
17-0.022557-0.15790.437593
180.1467981.02760.154595
190.1658151.16070.125692
200.0023250.01630.49354
210.1110060.7770.220434
22-0.243523-1.70470.047296
230.0746840.52280.301739
24-0.075182-0.52630.300537
25-0.0556-0.38920.349408
26-0.008497-0.05950.476406
27-0.019316-0.13520.446499
28-0.05844-0.40910.342132
290.0664210.46490.322014
30-0.001395-0.00980.496124
31-0.063063-0.44140.330418
320.0177780.12440.450736
33-0.007031-0.04920.480474
340.0636610.44560.328915
350.0290720.20350.419791
36-0.097883-0.68520.248229
37-0.096204-0.67340.251919
38-0.06609-0.46260.322838
390.0354640.24820.402491
40-0.110683-0.77480.221096
41-0.174066-1.21850.114442
42-0.062215-0.43550.332553
430.022320.15620.438243
44-0.046441-0.32510.373249
450.0057490.04020.484033
460.0142560.09980.460459
470.1094590.76620.223612
48-0.039059-0.27340.392843
49NANANA
50NANANA
51NANANA
52NANANA
53NANANA
54NANANA
55NANANA
56NANANA
57NANANA
58NANANA
59NANANA
60NANANA

\begin{tabular}{lllllllll}
\hline
Partial Autocorrelation Function \tabularnewline
Time lag k & PACF(k) & T-STAT & P-value \tabularnewline
1 & 0.38219 & 2.6753 & 0.00506 \tabularnewline
2 & 0.212354 & 1.4865 & 0.07178 \tabularnewline
3 & -0.239118 & -1.6738 & 0.050269 \tabularnewline
4 & -0.092297 & -0.6461 & 0.26062 \tabularnewline
5 & 0.057284 & 0.401 & 0.345087 \tabularnewline
6 & 0.086708 & 0.607 & 0.273342 \tabularnewline
7 & -0.041059 & -0.2874 & 0.387503 \tabularnewline
8 & 0.073656 & 0.5156 & 0.304229 \tabularnewline
9 & -0.091338 & -0.6394 & 0.26278 \tabularnewline
10 & -0.306408 & -2.1449 & 0.018474 \tabularnewline
11 & -0.227994 & -1.596 & 0.058464 \tabularnewline
12 & -0.103024 & -0.7212 & 0.237116 \tabularnewline
13 & -0.109874 & -0.7691 & 0.222758 \tabularnewline
14 & 0.012484 & 0.0874 & 0.465361 \tabularnewline
15 & 0.04076 & 0.2853 & 0.3883 \tabularnewline
16 & 0.056391 & 0.3947 & 0.347374 \tabularnewline
17 & -0.022557 & -0.1579 & 0.437593 \tabularnewline
18 & 0.146798 & 1.0276 & 0.154595 \tabularnewline
19 & 0.165815 & 1.1607 & 0.125692 \tabularnewline
20 & 0.002325 & 0.0163 & 0.49354 \tabularnewline
21 & 0.111006 & 0.777 & 0.220434 \tabularnewline
22 & -0.243523 & -1.7047 & 0.047296 \tabularnewline
23 & 0.074684 & 0.5228 & 0.301739 \tabularnewline
24 & -0.075182 & -0.5263 & 0.300537 \tabularnewline
25 & -0.0556 & -0.3892 & 0.349408 \tabularnewline
26 & -0.008497 & -0.0595 & 0.476406 \tabularnewline
27 & -0.019316 & -0.1352 & 0.446499 \tabularnewline
28 & -0.05844 & -0.4091 & 0.342132 \tabularnewline
29 & 0.066421 & 0.4649 & 0.322014 \tabularnewline
30 & -0.001395 & -0.0098 & 0.496124 \tabularnewline
31 & -0.063063 & -0.4414 & 0.330418 \tabularnewline
32 & 0.017778 & 0.1244 & 0.450736 \tabularnewline
33 & -0.007031 & -0.0492 & 0.480474 \tabularnewline
34 & 0.063661 & 0.4456 & 0.328915 \tabularnewline
35 & 0.029072 & 0.2035 & 0.419791 \tabularnewline
36 & -0.097883 & -0.6852 & 0.248229 \tabularnewline
37 & -0.096204 & -0.6734 & 0.251919 \tabularnewline
38 & -0.06609 & -0.4626 & 0.322838 \tabularnewline
39 & 0.035464 & 0.2482 & 0.402491 \tabularnewline
40 & -0.110683 & -0.7748 & 0.221096 \tabularnewline
41 & -0.174066 & -1.2185 & 0.114442 \tabularnewline
42 & -0.062215 & -0.4355 & 0.332553 \tabularnewline
43 & 0.02232 & 0.1562 & 0.438243 \tabularnewline
44 & -0.046441 & -0.3251 & 0.373249 \tabularnewline
45 & 0.005749 & 0.0402 & 0.484033 \tabularnewline
46 & 0.014256 & 0.0998 & 0.460459 \tabularnewline
47 & 0.109459 & 0.7662 & 0.223612 \tabularnewline
48 & -0.039059 & -0.2734 & 0.392843 \tabularnewline
49 & NA & NA & NA \tabularnewline
50 & NA & NA & NA \tabularnewline
51 & NA & NA & NA \tabularnewline
52 & NA & NA & NA \tabularnewline
53 & NA & NA & NA \tabularnewline
54 & NA & NA & NA \tabularnewline
55 & NA & NA & NA \tabularnewline
56 & NA & NA & NA \tabularnewline
57 & NA & NA & NA \tabularnewline
58 & NA & NA & NA \tabularnewline
59 & NA & NA & NA \tabularnewline
60 & NA & NA & NA \tabularnewline
\hline
\end{tabular}
%Source: https://freestatistics.org/blog/index.php?pk=35173&T=2

[TABLE]
[ROW][C]Partial Autocorrelation Function[/C][/ROW]
[ROW][C]Time lag k[/C][C]PACF(k)[/C][C]T-STAT[/C][C]P-value[/C][/ROW]
[ROW][C]1[/C][C]0.38219[/C][C]2.6753[/C][C]0.00506[/C][/ROW]
[ROW][C]2[/C][C]0.212354[/C][C]1.4865[/C][C]0.07178[/C][/ROW]
[ROW][C]3[/C][C]-0.239118[/C][C]-1.6738[/C][C]0.050269[/C][/ROW]
[ROW][C]4[/C][C]-0.092297[/C][C]-0.6461[/C][C]0.26062[/C][/ROW]
[ROW][C]5[/C][C]0.057284[/C][C]0.401[/C][C]0.345087[/C][/ROW]
[ROW][C]6[/C][C]0.086708[/C][C]0.607[/C][C]0.273342[/C][/ROW]
[ROW][C]7[/C][C]-0.041059[/C][C]-0.2874[/C][C]0.387503[/C][/ROW]
[ROW][C]8[/C][C]0.073656[/C][C]0.5156[/C][C]0.304229[/C][/ROW]
[ROW][C]9[/C][C]-0.091338[/C][C]-0.6394[/C][C]0.26278[/C][/ROW]
[ROW][C]10[/C][C]-0.306408[/C][C]-2.1449[/C][C]0.018474[/C][/ROW]
[ROW][C]11[/C][C]-0.227994[/C][C]-1.596[/C][C]0.058464[/C][/ROW]
[ROW][C]12[/C][C]-0.103024[/C][C]-0.7212[/C][C]0.237116[/C][/ROW]
[ROW][C]13[/C][C]-0.109874[/C][C]-0.7691[/C][C]0.222758[/C][/ROW]
[ROW][C]14[/C][C]0.012484[/C][C]0.0874[/C][C]0.465361[/C][/ROW]
[ROW][C]15[/C][C]0.04076[/C][C]0.2853[/C][C]0.3883[/C][/ROW]
[ROW][C]16[/C][C]0.056391[/C][C]0.3947[/C][C]0.347374[/C][/ROW]
[ROW][C]17[/C][C]-0.022557[/C][C]-0.1579[/C][C]0.437593[/C][/ROW]
[ROW][C]18[/C][C]0.146798[/C][C]1.0276[/C][C]0.154595[/C][/ROW]
[ROW][C]19[/C][C]0.165815[/C][C]1.1607[/C][C]0.125692[/C][/ROW]
[ROW][C]20[/C][C]0.002325[/C][C]0.0163[/C][C]0.49354[/C][/ROW]
[ROW][C]21[/C][C]0.111006[/C][C]0.777[/C][C]0.220434[/C][/ROW]
[ROW][C]22[/C][C]-0.243523[/C][C]-1.7047[/C][C]0.047296[/C][/ROW]
[ROW][C]23[/C][C]0.074684[/C][C]0.5228[/C][C]0.301739[/C][/ROW]
[ROW][C]24[/C][C]-0.075182[/C][C]-0.5263[/C][C]0.300537[/C][/ROW]
[ROW][C]25[/C][C]-0.0556[/C][C]-0.3892[/C][C]0.349408[/C][/ROW]
[ROW][C]26[/C][C]-0.008497[/C][C]-0.0595[/C][C]0.476406[/C][/ROW]
[ROW][C]27[/C][C]-0.019316[/C][C]-0.1352[/C][C]0.446499[/C][/ROW]
[ROW][C]28[/C][C]-0.05844[/C][C]-0.4091[/C][C]0.342132[/C][/ROW]
[ROW][C]29[/C][C]0.066421[/C][C]0.4649[/C][C]0.322014[/C][/ROW]
[ROW][C]30[/C][C]-0.001395[/C][C]-0.0098[/C][C]0.496124[/C][/ROW]
[ROW][C]31[/C][C]-0.063063[/C][C]-0.4414[/C][C]0.330418[/C][/ROW]
[ROW][C]32[/C][C]0.017778[/C][C]0.1244[/C][C]0.450736[/C][/ROW]
[ROW][C]33[/C][C]-0.007031[/C][C]-0.0492[/C][C]0.480474[/C][/ROW]
[ROW][C]34[/C][C]0.063661[/C][C]0.4456[/C][C]0.328915[/C][/ROW]
[ROW][C]35[/C][C]0.029072[/C][C]0.2035[/C][C]0.419791[/C][/ROW]
[ROW][C]36[/C][C]-0.097883[/C][C]-0.6852[/C][C]0.248229[/C][/ROW]
[ROW][C]37[/C][C]-0.096204[/C][C]-0.6734[/C][C]0.251919[/C][/ROW]
[ROW][C]38[/C][C]-0.06609[/C][C]-0.4626[/C][C]0.322838[/C][/ROW]
[ROW][C]39[/C][C]0.035464[/C][C]0.2482[/C][C]0.402491[/C][/ROW]
[ROW][C]40[/C][C]-0.110683[/C][C]-0.7748[/C][C]0.221096[/C][/ROW]
[ROW][C]41[/C][C]-0.174066[/C][C]-1.2185[/C][C]0.114442[/C][/ROW]
[ROW][C]42[/C][C]-0.062215[/C][C]-0.4355[/C][C]0.332553[/C][/ROW]
[ROW][C]43[/C][C]0.02232[/C][C]0.1562[/C][C]0.438243[/C][/ROW]
[ROW][C]44[/C][C]-0.046441[/C][C]-0.3251[/C][C]0.373249[/C][/ROW]
[ROW][C]45[/C][C]0.005749[/C][C]0.0402[/C][C]0.484033[/C][/ROW]
[ROW][C]46[/C][C]0.014256[/C][C]0.0998[/C][C]0.460459[/C][/ROW]
[ROW][C]47[/C][C]0.109459[/C][C]0.7662[/C][C]0.223612[/C][/ROW]
[ROW][C]48[/C][C]-0.039059[/C][C]-0.2734[/C][C]0.392843[/C][/ROW]
[ROW][C]49[/C][C]NA[/C][C]NA[/C][C]NA[/C][/ROW]
[ROW][C]50[/C][C]NA[/C][C]NA[/C][C]NA[/C][/ROW]
[ROW][C]51[/C][C]NA[/C][C]NA[/C][C]NA[/C][/ROW]
[ROW][C]52[/C][C]NA[/C][C]NA[/C][C]NA[/C][/ROW]
[ROW][C]53[/C][C]NA[/C][C]NA[/C][C]NA[/C][/ROW]
[ROW][C]54[/C][C]NA[/C][C]NA[/C][C]NA[/C][/ROW]
[ROW][C]55[/C][C]NA[/C][C]NA[/C][C]NA[/C][/ROW]
[ROW][C]56[/C][C]NA[/C][C]NA[/C][C]NA[/C][/ROW]
[ROW][C]57[/C][C]NA[/C][C]NA[/C][C]NA[/C][/ROW]
[ROW][C]58[/C][C]NA[/C][C]NA[/C][C]NA[/C][/ROW]
[ROW][C]59[/C][C]NA[/C][C]NA[/C][C]NA[/C][/ROW]
[ROW][C]60[/C][C]NA[/C][C]NA[/C][C]NA[/C][/ROW]
[/TABLE]
Source: https://freestatistics.org/blog/index.php?pk=35173&T=2

Globally Unique Identifier (entire table): ba.freestatistics.org/blog/index.php?pk=35173&T=2

As an alternative you can also use a QR Code:  

The GUIDs for individual cells are displayed in the table below:

Partial Autocorrelation Function
Time lag kPACF(k)T-STATP-value
10.382192.67530.00506
20.2123541.48650.07178
3-0.239118-1.67380.050269
4-0.092297-0.64610.26062
50.0572840.4010.345087
60.0867080.6070.273342
7-0.041059-0.28740.387503
80.0736560.51560.304229
9-0.091338-0.63940.26278
10-0.306408-2.14490.018474
11-0.227994-1.5960.058464
12-0.103024-0.72120.237116
13-0.109874-0.76910.222758
140.0124840.08740.465361
150.040760.28530.3883
160.0563910.39470.347374
17-0.022557-0.15790.437593
180.1467981.02760.154595
190.1658151.16070.125692
200.0023250.01630.49354
210.1110060.7770.220434
22-0.243523-1.70470.047296
230.0746840.52280.301739
24-0.075182-0.52630.300537
25-0.0556-0.38920.349408
26-0.008497-0.05950.476406
27-0.019316-0.13520.446499
28-0.05844-0.40910.342132
290.0664210.46490.322014
30-0.001395-0.00980.496124
31-0.063063-0.44140.330418
320.0177780.12440.450736
33-0.007031-0.04920.480474
340.0636610.44560.328915
350.0290720.20350.419791
36-0.097883-0.68520.248229
37-0.096204-0.67340.251919
38-0.06609-0.46260.322838
390.0354640.24820.402491
40-0.110683-0.77480.221096
41-0.174066-1.21850.114442
42-0.062215-0.43550.332553
430.022320.15620.438243
44-0.046441-0.32510.373249
450.0057490.04020.484033
460.0142560.09980.460459
470.1094590.76620.223612
48-0.039059-0.27340.392843
49NANANA
50NANANA
51NANANA
52NANANA
53NANANA
54NANANA
55NANANA
56NANANA
57NANANA
58NANANA
59NANANA
60NANANA


Parameters (Session):
par1 = 60 ; par2 = 1 ; par3 = 0 ; par4 = 1 ; par5 = 12 ;
Parameters (R input):
par1 = 60 ; par2 = 1 ; par3 = 0 ; par4 = 1 ; par5 = 12 ;
R code (references can be found in the software module):
if (par1 == 'Default') {
par1 = 10*log10(length(x))
} else {
par1 <- as.numeric(par1)
}
par2 <- as.numeric(par2)
par3 <- as.numeric(par3)
par4 <- as.numeric(par4)
par5 <- as.numeric(par5)
if (par2 == 0) {
x <- log(x)
} else {
x <- (x ^ par2 - 1) / par2
}
if (par3 > 0) x <- diff(x,lag=1,difference=par3)
if (par4 > 0) x <- diff(x,lag=par5,difference=par4)
bitmap(file='pic1.png')
racf <- acf(x,par1,main='Autocorrelation',xlab='lags',ylab='ACF')
dev.off()
bitmap(file='pic2.png')
rpacf <- pacf(x,par1,main='Partial Autocorrelation',xlab='lags',ylab='PACF')
dev.off()
(myacf <- c(racf$acf))
(mypacf <- c(rpacf$acf))
lengthx <- length(x)
sqrtn <- sqrt(lengthx)
load(file='createtable')
a<-table.start()
a<-table.row.start(a)
a<-table.element(a,'Autocorrelation Function',4,TRUE)
a<-table.row.end(a)
a<-table.row.start(a)
a<-table.element(a,'Time lag k',header=TRUE)
a<-table.element(a,hyperlink('basics.htm','ACF(k)','click here for more information about the Autocorrelation Function'),header=TRUE)
a<-table.element(a,'T-STAT',header=TRUE)
a<-table.element(a,'P-value',header=TRUE)
a<-table.row.end(a)
for (i in 2:(par1+1)) {
a<-table.row.start(a)
a<-table.element(a,i-1,header=TRUE)
a<-table.element(a,round(myacf[i],6))
mytstat <- myacf[i]*sqrtn
a<-table.element(a,round(mytstat,4))
a<-table.element(a,round(1-pt(abs(mytstat),lengthx),6))
a<-table.row.end(a)
}
a<-table.end(a)
table.save(a,file='mytable.tab')
a<-table.start()
a<-table.row.start(a)
a<-table.element(a,'Partial Autocorrelation Function',4,TRUE)
a<-table.row.end(a)
a<-table.row.start(a)
a<-table.element(a,'Time lag k',header=TRUE)
a<-table.element(a,hyperlink('basics.htm','PACF(k)','click here for more information about the Partial Autocorrelation Function'),header=TRUE)
a<-table.element(a,'T-STAT',header=TRUE)
a<-table.element(a,'P-value',header=TRUE)
a<-table.row.end(a)
for (i in 1:par1) {
a<-table.row.start(a)
a<-table.element(a,i,header=TRUE)
a<-table.element(a,round(mypacf[i],6))
mytstat <- mypacf[i]*sqrtn
a<-table.element(a,round(mytstat,4))
a<-table.element(a,round(1-pt(abs(mytstat),lengthx),6))
a<-table.row.end(a)
}
a<-table.end(a)
table.save(a,file='mytable1.tab')