Free Statistics

of Irreproducible Research!

Author's title

Author*The author of this computation has been verified*
R Software Modulerwasp_autocorrelation.wasp
Title produced by software(Partial) Autocorrelation Function
Date of computationFri, 19 Dec 2008 08:11:04 -0700
Cite this page as followsStatistical Computations at FreeStatistics.org, Office for Research Development and Education, URL https://freestatistics.org/blog/index.php?v=date/2008/Dec/19/t1229699507x6wdk0a96irbd66.htm/, Retrieved Wed, 15 May 2024 01:52:08 +0000
Statistical Computations at FreeStatistics.org, Office for Research Development and Education, URL https://freestatistics.org/blog/index.php?pk=35171, Retrieved Wed, 15 May 2024 01:52:08 +0000
QR Codes:

Original text written by user:
IsPrivate?No (this computation is public)
User-defined keywords
Estimated Impact169
Family? (F = Feedback message, R = changed R code, M = changed R Module, P = changed Parameters, D = changed Data)
-       [(Partial) Autocorrelation Function] [ACF PAPER] [2008-12-19 15:11:04] [00a0a665d7a07edd2e460056b0c0c354] [Current]
-   P     [(Partial) Autocorrelation Function] [ACF paper] [2008-12-19 15:15:09] [82d201ca7b4e7cd2c6f885d29b5b6937]
- RMP     [Spectral Analysis] [SPECTRUM PAPER] [2008-12-19 15:18:55] [82d201ca7b4e7cd2c6f885d29b5b6937]
-   P       [Spectral Analysis] [SPECTRUM Paper] [2008-12-19 15:22:44] [82d201ca7b4e7cd2c6f885d29b5b6937]
- RMPD      [Cross Correlation Function] [Cross Correlation...] [2008-12-19 15:45:56] [82d201ca7b4e7cd2c6f885d29b5b6937]
Feedback Forum

Post a new message
Dataseries X:
17704
15548
28029
29383
36438
32034
22679
24319
18004
17537
20366
22782
19169
13807
29743
25591
29096
26482
22405
27044
17970
18730
19684
19785
18479
10698
31956
29506
34506
27165
26736
23691
18157
17328
18205
20995
17382
9367
31124
26551
30651
25859
25100
25778
20418
18688
20424
24776
19814
12738
31566
30111
30019
31934
25826
26835
20205
17789
20520
22518
15572


Summary of computational transaction
Raw Inputview raw input (R code)
Raw Outputview raw output of R engine
Computing time1 seconds
R Server'George Udny Yule' @ 72.249.76.132

\begin{tabular}{lllllllll}
\hline
Summary of computational transaction \tabularnewline
Raw Input & view raw input (R code)  \tabularnewline
Raw Output & view raw output of R engine  \tabularnewline
Computing time & 1 seconds \tabularnewline
R Server & 'George Udny Yule' @ 72.249.76.132 \tabularnewline
\hline
\end{tabular}
%Source: https://freestatistics.org/blog/index.php?pk=35171&T=0

[TABLE]
[ROW][C]Summary of computational transaction[/C][/ROW]
[ROW][C]Raw Input[/C][C]view raw input (R code) [/C][/ROW]
[ROW][C]Raw Output[/C][C]view raw output of R engine [/C][/ROW]
[ROW][C]Computing time[/C][C]1 seconds[/C][/ROW]
[ROW][C]R Server[/C][C]'George Udny Yule' @ 72.249.76.132[/C][/ROW]
[/TABLE]
Source: https://freestatistics.org/blog/index.php?pk=35171&T=0

Globally Unique Identifier (entire table): ba.freestatistics.org/blog/index.php?pk=35171&T=0

As an alternative you can also use a QR Code:  

The GUIDs for individual cells are displayed in the table below:

Summary of computational transaction
Raw Inputview raw input (R code)
Raw Outputview raw output of R engine
Computing time1 seconds
R Server'George Udny Yule' @ 72.249.76.132


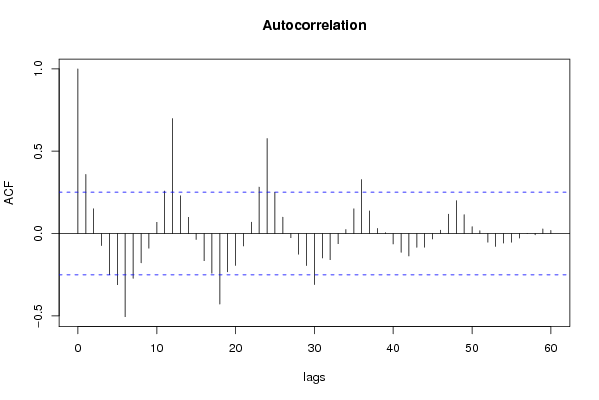
Autocorrelation Function
Time lag kACF(k)T-STATP-value
10.3587952.80230.003396
20.1501121.17240.122795
3-0.073328-0.57270.284472
4-0.250143-1.95370.027664
5-0.311067-2.42950.009039
6-0.505276-3.94630.000104
7-0.272217-2.12610.018776
8-0.178059-1.39070.084687
9-0.089394-0.69820.243856
100.0678250.52970.29911
110.2578242.01370.024231
120.6983565.45430
130.2289821.78840.039338
140.0983140.76790.222767
15-0.036394-0.28420.388591
16-0.164865-1.28760.101369
17-0.241-1.88230.032286
18-0.428461-3.34640.000703
19-0.233-1.81980.03685
20-0.194125-1.51620.067321
21-0.075254-0.58780.279435
220.06880.53730.296492
230.2818732.20150.015747
240.5771014.50731.5e-05
250.2514451.96380.027055
260.0992810.77540.220547
27-0.025206-0.19690.422293
28-0.125656-0.98140.165135
29-0.194994-1.5230.066469
30-0.310022-2.42130.009226
31-0.148521-1.160.125287
32-0.15901-1.24190.109513
33-0.061909-0.48350.315228
340.0236480.18470.42704
350.1503091.17390.122489
360.3278162.56030.006475
370.1371561.07120.144145
380.0307430.24010.405524
390.0047580.03720.48524
40-0.063099-0.49280.311955
41-0.114102-0.89120.188172
42-0.13613-1.06320.145939
43-0.083629-0.65320.258053
44-0.083246-0.65020.259012
45-0.033193-0.25920.39816
460.0200860.15690.43793
470.1173120.91620.181576
480.19911.5550.062557
490.1145680.89480.187205
500.0412920.32250.374088
510.0168910.13190.447738
52-0.052754-0.4120.340885
53-0.078391-0.61220.271324
54-0.058093-0.45370.325821
55-0.052873-0.4130.340544
56-0.027578-0.21540.415091
57-0.000355-0.00280.498897
58-0.007965-0.06220.475299
590.0280030.21870.413803
600.0189180.14780.441512

\begin{tabular}{lllllllll}
\hline
Autocorrelation Function \tabularnewline
Time lag k & ACF(k) & T-STAT & P-value \tabularnewline
1 & 0.358795 & 2.8023 & 0.003396 \tabularnewline
2 & 0.150112 & 1.1724 & 0.122795 \tabularnewline
3 & -0.073328 & -0.5727 & 0.284472 \tabularnewline
4 & -0.250143 & -1.9537 & 0.027664 \tabularnewline
5 & -0.311067 & -2.4295 & 0.009039 \tabularnewline
6 & -0.505276 & -3.9463 & 0.000104 \tabularnewline
7 & -0.272217 & -2.1261 & 0.018776 \tabularnewline
8 & -0.178059 & -1.3907 & 0.084687 \tabularnewline
9 & -0.089394 & -0.6982 & 0.243856 \tabularnewline
10 & 0.067825 & 0.5297 & 0.29911 \tabularnewline
11 & 0.257824 & 2.0137 & 0.024231 \tabularnewline
12 & 0.698356 & 5.4543 & 0 \tabularnewline
13 & 0.228982 & 1.7884 & 0.039338 \tabularnewline
14 & 0.098314 & 0.7679 & 0.222767 \tabularnewline
15 & -0.036394 & -0.2842 & 0.388591 \tabularnewline
16 & -0.164865 & -1.2876 & 0.101369 \tabularnewline
17 & -0.241 & -1.8823 & 0.032286 \tabularnewline
18 & -0.428461 & -3.3464 & 0.000703 \tabularnewline
19 & -0.233 & -1.8198 & 0.03685 \tabularnewline
20 & -0.194125 & -1.5162 & 0.067321 \tabularnewline
21 & -0.075254 & -0.5878 & 0.279435 \tabularnewline
22 & 0.0688 & 0.5373 & 0.296492 \tabularnewline
23 & 0.281873 & 2.2015 & 0.015747 \tabularnewline
24 & 0.577101 & 4.5073 & 1.5e-05 \tabularnewline
25 & 0.251445 & 1.9638 & 0.027055 \tabularnewline
26 & 0.099281 & 0.7754 & 0.220547 \tabularnewline
27 & -0.025206 & -0.1969 & 0.422293 \tabularnewline
28 & -0.125656 & -0.9814 & 0.165135 \tabularnewline
29 & -0.194994 & -1.523 & 0.066469 \tabularnewline
30 & -0.310022 & -2.4213 & 0.009226 \tabularnewline
31 & -0.148521 & -1.16 & 0.125287 \tabularnewline
32 & -0.15901 & -1.2419 & 0.109513 \tabularnewline
33 & -0.061909 & -0.4835 & 0.315228 \tabularnewline
34 & 0.023648 & 0.1847 & 0.42704 \tabularnewline
35 & 0.150309 & 1.1739 & 0.122489 \tabularnewline
36 & 0.327816 & 2.5603 & 0.006475 \tabularnewline
37 & 0.137156 & 1.0712 & 0.144145 \tabularnewline
38 & 0.030743 & 0.2401 & 0.405524 \tabularnewline
39 & 0.004758 & 0.0372 & 0.48524 \tabularnewline
40 & -0.063099 & -0.4928 & 0.311955 \tabularnewline
41 & -0.114102 & -0.8912 & 0.188172 \tabularnewline
42 & -0.13613 & -1.0632 & 0.145939 \tabularnewline
43 & -0.083629 & -0.6532 & 0.258053 \tabularnewline
44 & -0.083246 & -0.6502 & 0.259012 \tabularnewline
45 & -0.033193 & -0.2592 & 0.39816 \tabularnewline
46 & 0.020086 & 0.1569 & 0.43793 \tabularnewline
47 & 0.117312 & 0.9162 & 0.181576 \tabularnewline
48 & 0.1991 & 1.555 & 0.062557 \tabularnewline
49 & 0.114568 & 0.8948 & 0.187205 \tabularnewline
50 & 0.041292 & 0.3225 & 0.374088 \tabularnewline
51 & 0.016891 & 0.1319 & 0.447738 \tabularnewline
52 & -0.052754 & -0.412 & 0.340885 \tabularnewline
53 & -0.078391 & -0.6122 & 0.271324 \tabularnewline
54 & -0.058093 & -0.4537 & 0.325821 \tabularnewline
55 & -0.052873 & -0.413 & 0.340544 \tabularnewline
56 & -0.027578 & -0.2154 & 0.415091 \tabularnewline
57 & -0.000355 & -0.0028 & 0.498897 \tabularnewline
58 & -0.007965 & -0.0622 & 0.475299 \tabularnewline
59 & 0.028003 & 0.2187 & 0.413803 \tabularnewline
60 & 0.018918 & 0.1478 & 0.441512 \tabularnewline
\hline
\end{tabular}
%Source: https://freestatistics.org/blog/index.php?pk=35171&T=1

[TABLE]
[ROW][C]Autocorrelation Function[/C][/ROW]
[ROW][C]Time lag k[/C][C]ACF(k)[/C][C]T-STAT[/C][C]P-value[/C][/ROW]
[ROW][C]1[/C][C]0.358795[/C][C]2.8023[/C][C]0.003396[/C][/ROW]
[ROW][C]2[/C][C]0.150112[/C][C]1.1724[/C][C]0.122795[/C][/ROW]
[ROW][C]3[/C][C]-0.073328[/C][C]-0.5727[/C][C]0.284472[/C][/ROW]
[ROW][C]4[/C][C]-0.250143[/C][C]-1.9537[/C][C]0.027664[/C][/ROW]
[ROW][C]5[/C][C]-0.311067[/C][C]-2.4295[/C][C]0.009039[/C][/ROW]
[ROW][C]6[/C][C]-0.505276[/C][C]-3.9463[/C][C]0.000104[/C][/ROW]
[ROW][C]7[/C][C]-0.272217[/C][C]-2.1261[/C][C]0.018776[/C][/ROW]
[ROW][C]8[/C][C]-0.178059[/C][C]-1.3907[/C][C]0.084687[/C][/ROW]
[ROW][C]9[/C][C]-0.089394[/C][C]-0.6982[/C][C]0.243856[/C][/ROW]
[ROW][C]10[/C][C]0.067825[/C][C]0.5297[/C][C]0.29911[/C][/ROW]
[ROW][C]11[/C][C]0.257824[/C][C]2.0137[/C][C]0.024231[/C][/ROW]
[ROW][C]12[/C][C]0.698356[/C][C]5.4543[/C][C]0[/C][/ROW]
[ROW][C]13[/C][C]0.228982[/C][C]1.7884[/C][C]0.039338[/C][/ROW]
[ROW][C]14[/C][C]0.098314[/C][C]0.7679[/C][C]0.222767[/C][/ROW]
[ROW][C]15[/C][C]-0.036394[/C][C]-0.2842[/C][C]0.388591[/C][/ROW]
[ROW][C]16[/C][C]-0.164865[/C][C]-1.2876[/C][C]0.101369[/C][/ROW]
[ROW][C]17[/C][C]-0.241[/C][C]-1.8823[/C][C]0.032286[/C][/ROW]
[ROW][C]18[/C][C]-0.428461[/C][C]-3.3464[/C][C]0.000703[/C][/ROW]
[ROW][C]19[/C][C]-0.233[/C][C]-1.8198[/C][C]0.03685[/C][/ROW]
[ROW][C]20[/C][C]-0.194125[/C][C]-1.5162[/C][C]0.067321[/C][/ROW]
[ROW][C]21[/C][C]-0.075254[/C][C]-0.5878[/C][C]0.279435[/C][/ROW]
[ROW][C]22[/C][C]0.0688[/C][C]0.5373[/C][C]0.296492[/C][/ROW]
[ROW][C]23[/C][C]0.281873[/C][C]2.2015[/C][C]0.015747[/C][/ROW]
[ROW][C]24[/C][C]0.577101[/C][C]4.5073[/C][C]1.5e-05[/C][/ROW]
[ROW][C]25[/C][C]0.251445[/C][C]1.9638[/C][C]0.027055[/C][/ROW]
[ROW][C]26[/C][C]0.099281[/C][C]0.7754[/C][C]0.220547[/C][/ROW]
[ROW][C]27[/C][C]-0.025206[/C][C]-0.1969[/C][C]0.422293[/C][/ROW]
[ROW][C]28[/C][C]-0.125656[/C][C]-0.9814[/C][C]0.165135[/C][/ROW]
[ROW][C]29[/C][C]-0.194994[/C][C]-1.523[/C][C]0.066469[/C][/ROW]
[ROW][C]30[/C][C]-0.310022[/C][C]-2.4213[/C][C]0.009226[/C][/ROW]
[ROW][C]31[/C][C]-0.148521[/C][C]-1.16[/C][C]0.125287[/C][/ROW]
[ROW][C]32[/C][C]-0.15901[/C][C]-1.2419[/C][C]0.109513[/C][/ROW]
[ROW][C]33[/C][C]-0.061909[/C][C]-0.4835[/C][C]0.315228[/C][/ROW]
[ROW][C]34[/C][C]0.023648[/C][C]0.1847[/C][C]0.42704[/C][/ROW]
[ROW][C]35[/C][C]0.150309[/C][C]1.1739[/C][C]0.122489[/C][/ROW]
[ROW][C]36[/C][C]0.327816[/C][C]2.5603[/C][C]0.006475[/C][/ROW]
[ROW][C]37[/C][C]0.137156[/C][C]1.0712[/C][C]0.144145[/C][/ROW]
[ROW][C]38[/C][C]0.030743[/C][C]0.2401[/C][C]0.405524[/C][/ROW]
[ROW][C]39[/C][C]0.004758[/C][C]0.0372[/C][C]0.48524[/C][/ROW]
[ROW][C]40[/C][C]-0.063099[/C][C]-0.4928[/C][C]0.311955[/C][/ROW]
[ROW][C]41[/C][C]-0.114102[/C][C]-0.8912[/C][C]0.188172[/C][/ROW]
[ROW][C]42[/C][C]-0.13613[/C][C]-1.0632[/C][C]0.145939[/C][/ROW]
[ROW][C]43[/C][C]-0.083629[/C][C]-0.6532[/C][C]0.258053[/C][/ROW]
[ROW][C]44[/C][C]-0.083246[/C][C]-0.6502[/C][C]0.259012[/C][/ROW]
[ROW][C]45[/C][C]-0.033193[/C][C]-0.2592[/C][C]0.39816[/C][/ROW]
[ROW][C]46[/C][C]0.020086[/C][C]0.1569[/C][C]0.43793[/C][/ROW]
[ROW][C]47[/C][C]0.117312[/C][C]0.9162[/C][C]0.181576[/C][/ROW]
[ROW][C]48[/C][C]0.1991[/C][C]1.555[/C][C]0.062557[/C][/ROW]
[ROW][C]49[/C][C]0.114568[/C][C]0.8948[/C][C]0.187205[/C][/ROW]
[ROW][C]50[/C][C]0.041292[/C][C]0.3225[/C][C]0.374088[/C][/ROW]
[ROW][C]51[/C][C]0.016891[/C][C]0.1319[/C][C]0.447738[/C][/ROW]
[ROW][C]52[/C][C]-0.052754[/C][C]-0.412[/C][C]0.340885[/C][/ROW]
[ROW][C]53[/C][C]-0.078391[/C][C]-0.6122[/C][C]0.271324[/C][/ROW]
[ROW][C]54[/C][C]-0.058093[/C][C]-0.4537[/C][C]0.325821[/C][/ROW]
[ROW][C]55[/C][C]-0.052873[/C][C]-0.413[/C][C]0.340544[/C][/ROW]
[ROW][C]56[/C][C]-0.027578[/C][C]-0.2154[/C][C]0.415091[/C][/ROW]
[ROW][C]57[/C][C]-0.000355[/C][C]-0.0028[/C][C]0.498897[/C][/ROW]
[ROW][C]58[/C][C]-0.007965[/C][C]-0.0622[/C][C]0.475299[/C][/ROW]
[ROW][C]59[/C][C]0.028003[/C][C]0.2187[/C][C]0.413803[/C][/ROW]
[ROW][C]60[/C][C]0.018918[/C][C]0.1478[/C][C]0.441512[/C][/ROW]
[/TABLE]
Source: https://freestatistics.org/blog/index.php?pk=35171&T=1

Globally Unique Identifier (entire table): ba.freestatistics.org/blog/index.php?pk=35171&T=1

As an alternative you can also use a QR Code:  

The GUIDs for individual cells are displayed in the table below:

Autocorrelation Function
Time lag kACF(k)T-STATP-value
10.3587952.80230.003396
20.1501121.17240.122795
3-0.073328-0.57270.284472
4-0.250143-1.95370.027664
5-0.311067-2.42950.009039
6-0.505276-3.94630.000104
7-0.272217-2.12610.018776
8-0.178059-1.39070.084687
9-0.089394-0.69820.243856
100.0678250.52970.29911
110.2578242.01370.024231
120.6983565.45430
130.2289821.78840.039338
140.0983140.76790.222767
15-0.036394-0.28420.388591
16-0.164865-1.28760.101369
17-0.241-1.88230.032286
18-0.428461-3.34640.000703
19-0.233-1.81980.03685
20-0.194125-1.51620.067321
21-0.075254-0.58780.279435
220.06880.53730.296492
230.2818732.20150.015747
240.5771014.50731.5e-05
250.2514451.96380.027055
260.0992810.77540.220547
27-0.025206-0.19690.422293
28-0.125656-0.98140.165135
29-0.194994-1.5230.066469
30-0.310022-2.42130.009226
31-0.148521-1.160.125287
32-0.15901-1.24190.109513
33-0.061909-0.48350.315228
340.0236480.18470.42704
350.1503091.17390.122489
360.3278162.56030.006475
370.1371561.07120.144145
380.0307430.24010.405524
390.0047580.03720.48524
40-0.063099-0.49280.311955
41-0.114102-0.89120.188172
42-0.13613-1.06320.145939
43-0.083629-0.65320.258053
44-0.083246-0.65020.259012
45-0.033193-0.25920.39816
460.0200860.15690.43793
470.1173120.91620.181576
480.19911.5550.062557
490.1145680.89480.187205
500.0412920.32250.374088
510.0168910.13190.447738
52-0.052754-0.4120.340885
53-0.078391-0.61220.271324
54-0.058093-0.45370.325821
55-0.052873-0.4130.340544
56-0.027578-0.21540.415091
57-0.000355-0.00280.498897
58-0.007965-0.06220.475299
590.0280030.21870.413803
600.0189180.14780.441512


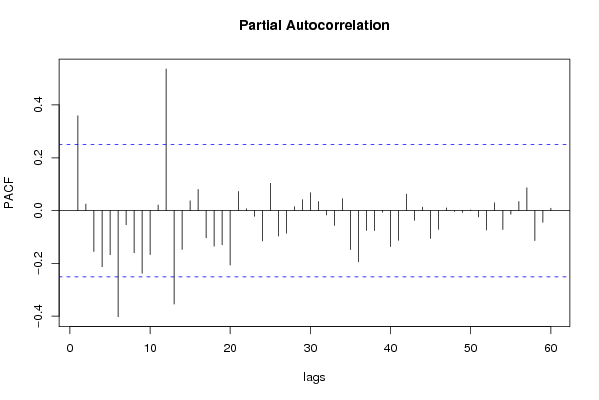
Partial Autocorrelation Function
Time lag kPACF(k)T-STATP-value
10.3587952.80230.003396
20.0245370.19160.424329
3-0.154661-1.20790.115866
4-0.212396-1.65890.051138
5-0.167145-1.30540.098322
6-0.40159-3.13650.001316
7-0.054028-0.4220.337263
8-0.159292-1.24410.109109
9-0.237724-1.85670.034093
10-0.166452-1.30.09924
110.0210090.16410.435104
120.5362674.18844.6e-05
13-0.353997-2.76480.003762
14-0.147315-1.15060.1272
150.0368160.28750.387336
160.0802980.62710.266452
17-0.10292-0.80380.212308
18-0.134617-1.05140.148613
19-0.129742-1.01330.157455
20-0.206059-1.60940.056349
210.0724830.56610.286698
220.006530.0510.479747
23-0.021505-0.1680.433585
24-0.114738-0.89610.186853
250.1033320.8070.211387
26-0.096613-0.75460.226705
27-0.085587-0.66850.253183
280.014630.11430.454703
290.0412550.32220.374198
300.0678750.53010.298977
310.034160.26680.395263
32-0.016394-0.1280.449268
33-0.056106-0.43820.331393
340.0448330.35020.363714
35-0.147409-1.15130.12705
36-0.193249-1.50930.068189
37-0.075008-0.58580.280076
38-0.075684-0.59110.278314
39-0.006087-0.04750.481117
40-0.136164-1.06350.145878
41-0.112431-0.87810.191664
420.0620130.48430.31494
43-0.036684-0.28650.387728
440.0131170.10240.45937
45-0.105291-0.82230.207041
46-0.070793-0.55290.291173
470.0100350.07840.468891
48-0.003323-0.0260.48969
49-0.006873-0.05370.478682
500.0020490.0160.493643
51-0.02398-0.18730.426026
52-0.073202-0.57170.284803
530.0294870.23030.409315
54-0.071835-0.56110.288409
55-0.013849-0.10820.45711
560.0343910.26860.394572
570.0860730.67220.251982
58-0.113623-0.88740.189169
59-0.044426-0.3470.364902
600.0090390.07060.471974

\begin{tabular}{lllllllll}
\hline
Partial Autocorrelation Function \tabularnewline
Time lag k & PACF(k) & T-STAT & P-value \tabularnewline
1 & 0.358795 & 2.8023 & 0.003396 \tabularnewline
2 & 0.024537 & 0.1916 & 0.424329 \tabularnewline
3 & -0.154661 & -1.2079 & 0.115866 \tabularnewline
4 & -0.212396 & -1.6589 & 0.051138 \tabularnewline
5 & -0.167145 & -1.3054 & 0.098322 \tabularnewline
6 & -0.40159 & -3.1365 & 0.001316 \tabularnewline
7 & -0.054028 & -0.422 & 0.337263 \tabularnewline
8 & -0.159292 & -1.2441 & 0.109109 \tabularnewline
9 & -0.237724 & -1.8567 & 0.034093 \tabularnewline
10 & -0.166452 & -1.3 & 0.09924 \tabularnewline
11 & 0.021009 & 0.1641 & 0.435104 \tabularnewline
12 & 0.536267 & 4.1884 & 4.6e-05 \tabularnewline
13 & -0.353997 & -2.7648 & 0.003762 \tabularnewline
14 & -0.147315 & -1.1506 & 0.1272 \tabularnewline
15 & 0.036816 & 0.2875 & 0.387336 \tabularnewline
16 & 0.080298 & 0.6271 & 0.266452 \tabularnewline
17 & -0.10292 & -0.8038 & 0.212308 \tabularnewline
18 & -0.134617 & -1.0514 & 0.148613 \tabularnewline
19 & -0.129742 & -1.0133 & 0.157455 \tabularnewline
20 & -0.206059 & -1.6094 & 0.056349 \tabularnewline
21 & 0.072483 & 0.5661 & 0.286698 \tabularnewline
22 & 0.00653 & 0.051 & 0.479747 \tabularnewline
23 & -0.021505 & -0.168 & 0.433585 \tabularnewline
24 & -0.114738 & -0.8961 & 0.186853 \tabularnewline
25 & 0.103332 & 0.807 & 0.211387 \tabularnewline
26 & -0.096613 & -0.7546 & 0.226705 \tabularnewline
27 & -0.085587 & -0.6685 & 0.253183 \tabularnewline
28 & 0.01463 & 0.1143 & 0.454703 \tabularnewline
29 & 0.041255 & 0.3222 & 0.374198 \tabularnewline
30 & 0.067875 & 0.5301 & 0.298977 \tabularnewline
31 & 0.03416 & 0.2668 & 0.395263 \tabularnewline
32 & -0.016394 & -0.128 & 0.449268 \tabularnewline
33 & -0.056106 & -0.4382 & 0.331393 \tabularnewline
34 & 0.044833 & 0.3502 & 0.363714 \tabularnewline
35 & -0.147409 & -1.1513 & 0.12705 \tabularnewline
36 & -0.193249 & -1.5093 & 0.068189 \tabularnewline
37 & -0.075008 & -0.5858 & 0.280076 \tabularnewline
38 & -0.075684 & -0.5911 & 0.278314 \tabularnewline
39 & -0.006087 & -0.0475 & 0.481117 \tabularnewline
40 & -0.136164 & -1.0635 & 0.145878 \tabularnewline
41 & -0.112431 & -0.8781 & 0.191664 \tabularnewline
42 & 0.062013 & 0.4843 & 0.31494 \tabularnewline
43 & -0.036684 & -0.2865 & 0.387728 \tabularnewline
44 & 0.013117 & 0.1024 & 0.45937 \tabularnewline
45 & -0.105291 & -0.8223 & 0.207041 \tabularnewline
46 & -0.070793 & -0.5529 & 0.291173 \tabularnewline
47 & 0.010035 & 0.0784 & 0.468891 \tabularnewline
48 & -0.003323 & -0.026 & 0.48969 \tabularnewline
49 & -0.006873 & -0.0537 & 0.478682 \tabularnewline
50 & 0.002049 & 0.016 & 0.493643 \tabularnewline
51 & -0.02398 & -0.1873 & 0.426026 \tabularnewline
52 & -0.073202 & -0.5717 & 0.284803 \tabularnewline
53 & 0.029487 & 0.2303 & 0.409315 \tabularnewline
54 & -0.071835 & -0.5611 & 0.288409 \tabularnewline
55 & -0.013849 & -0.1082 & 0.45711 \tabularnewline
56 & 0.034391 & 0.2686 & 0.394572 \tabularnewline
57 & 0.086073 & 0.6722 & 0.251982 \tabularnewline
58 & -0.113623 & -0.8874 & 0.189169 \tabularnewline
59 & -0.044426 & -0.347 & 0.364902 \tabularnewline
60 & 0.009039 & 0.0706 & 0.471974 \tabularnewline
\hline
\end{tabular}
%Source: https://freestatistics.org/blog/index.php?pk=35171&T=2

[TABLE]
[ROW][C]Partial Autocorrelation Function[/C][/ROW]
[ROW][C]Time lag k[/C][C]PACF(k)[/C][C]T-STAT[/C][C]P-value[/C][/ROW]
[ROW][C]1[/C][C]0.358795[/C][C]2.8023[/C][C]0.003396[/C][/ROW]
[ROW][C]2[/C][C]0.024537[/C][C]0.1916[/C][C]0.424329[/C][/ROW]
[ROW][C]3[/C][C]-0.154661[/C][C]-1.2079[/C][C]0.115866[/C][/ROW]
[ROW][C]4[/C][C]-0.212396[/C][C]-1.6589[/C][C]0.051138[/C][/ROW]
[ROW][C]5[/C][C]-0.167145[/C][C]-1.3054[/C][C]0.098322[/C][/ROW]
[ROW][C]6[/C][C]-0.40159[/C][C]-3.1365[/C][C]0.001316[/C][/ROW]
[ROW][C]7[/C][C]-0.054028[/C][C]-0.422[/C][C]0.337263[/C][/ROW]
[ROW][C]8[/C][C]-0.159292[/C][C]-1.2441[/C][C]0.109109[/C][/ROW]
[ROW][C]9[/C][C]-0.237724[/C][C]-1.8567[/C][C]0.034093[/C][/ROW]
[ROW][C]10[/C][C]-0.166452[/C][C]-1.3[/C][C]0.09924[/C][/ROW]
[ROW][C]11[/C][C]0.021009[/C][C]0.1641[/C][C]0.435104[/C][/ROW]
[ROW][C]12[/C][C]0.536267[/C][C]4.1884[/C][C]4.6e-05[/C][/ROW]
[ROW][C]13[/C][C]-0.353997[/C][C]-2.7648[/C][C]0.003762[/C][/ROW]
[ROW][C]14[/C][C]-0.147315[/C][C]-1.1506[/C][C]0.1272[/C][/ROW]
[ROW][C]15[/C][C]0.036816[/C][C]0.2875[/C][C]0.387336[/C][/ROW]
[ROW][C]16[/C][C]0.080298[/C][C]0.6271[/C][C]0.266452[/C][/ROW]
[ROW][C]17[/C][C]-0.10292[/C][C]-0.8038[/C][C]0.212308[/C][/ROW]
[ROW][C]18[/C][C]-0.134617[/C][C]-1.0514[/C][C]0.148613[/C][/ROW]
[ROW][C]19[/C][C]-0.129742[/C][C]-1.0133[/C][C]0.157455[/C][/ROW]
[ROW][C]20[/C][C]-0.206059[/C][C]-1.6094[/C][C]0.056349[/C][/ROW]
[ROW][C]21[/C][C]0.072483[/C][C]0.5661[/C][C]0.286698[/C][/ROW]
[ROW][C]22[/C][C]0.00653[/C][C]0.051[/C][C]0.479747[/C][/ROW]
[ROW][C]23[/C][C]-0.021505[/C][C]-0.168[/C][C]0.433585[/C][/ROW]
[ROW][C]24[/C][C]-0.114738[/C][C]-0.8961[/C][C]0.186853[/C][/ROW]
[ROW][C]25[/C][C]0.103332[/C][C]0.807[/C][C]0.211387[/C][/ROW]
[ROW][C]26[/C][C]-0.096613[/C][C]-0.7546[/C][C]0.226705[/C][/ROW]
[ROW][C]27[/C][C]-0.085587[/C][C]-0.6685[/C][C]0.253183[/C][/ROW]
[ROW][C]28[/C][C]0.01463[/C][C]0.1143[/C][C]0.454703[/C][/ROW]
[ROW][C]29[/C][C]0.041255[/C][C]0.3222[/C][C]0.374198[/C][/ROW]
[ROW][C]30[/C][C]0.067875[/C][C]0.5301[/C][C]0.298977[/C][/ROW]
[ROW][C]31[/C][C]0.03416[/C][C]0.2668[/C][C]0.395263[/C][/ROW]
[ROW][C]32[/C][C]-0.016394[/C][C]-0.128[/C][C]0.449268[/C][/ROW]
[ROW][C]33[/C][C]-0.056106[/C][C]-0.4382[/C][C]0.331393[/C][/ROW]
[ROW][C]34[/C][C]0.044833[/C][C]0.3502[/C][C]0.363714[/C][/ROW]
[ROW][C]35[/C][C]-0.147409[/C][C]-1.1513[/C][C]0.12705[/C][/ROW]
[ROW][C]36[/C][C]-0.193249[/C][C]-1.5093[/C][C]0.068189[/C][/ROW]
[ROW][C]37[/C][C]-0.075008[/C][C]-0.5858[/C][C]0.280076[/C][/ROW]
[ROW][C]38[/C][C]-0.075684[/C][C]-0.5911[/C][C]0.278314[/C][/ROW]
[ROW][C]39[/C][C]-0.006087[/C][C]-0.0475[/C][C]0.481117[/C][/ROW]
[ROW][C]40[/C][C]-0.136164[/C][C]-1.0635[/C][C]0.145878[/C][/ROW]
[ROW][C]41[/C][C]-0.112431[/C][C]-0.8781[/C][C]0.191664[/C][/ROW]
[ROW][C]42[/C][C]0.062013[/C][C]0.4843[/C][C]0.31494[/C][/ROW]
[ROW][C]43[/C][C]-0.036684[/C][C]-0.2865[/C][C]0.387728[/C][/ROW]
[ROW][C]44[/C][C]0.013117[/C][C]0.1024[/C][C]0.45937[/C][/ROW]
[ROW][C]45[/C][C]-0.105291[/C][C]-0.8223[/C][C]0.207041[/C][/ROW]
[ROW][C]46[/C][C]-0.070793[/C][C]-0.5529[/C][C]0.291173[/C][/ROW]
[ROW][C]47[/C][C]0.010035[/C][C]0.0784[/C][C]0.468891[/C][/ROW]
[ROW][C]48[/C][C]-0.003323[/C][C]-0.026[/C][C]0.48969[/C][/ROW]
[ROW][C]49[/C][C]-0.006873[/C][C]-0.0537[/C][C]0.478682[/C][/ROW]
[ROW][C]50[/C][C]0.002049[/C][C]0.016[/C][C]0.493643[/C][/ROW]
[ROW][C]51[/C][C]-0.02398[/C][C]-0.1873[/C][C]0.426026[/C][/ROW]
[ROW][C]52[/C][C]-0.073202[/C][C]-0.5717[/C][C]0.284803[/C][/ROW]
[ROW][C]53[/C][C]0.029487[/C][C]0.2303[/C][C]0.409315[/C][/ROW]
[ROW][C]54[/C][C]-0.071835[/C][C]-0.5611[/C][C]0.288409[/C][/ROW]
[ROW][C]55[/C][C]-0.013849[/C][C]-0.1082[/C][C]0.45711[/C][/ROW]
[ROW][C]56[/C][C]0.034391[/C][C]0.2686[/C][C]0.394572[/C][/ROW]
[ROW][C]57[/C][C]0.086073[/C][C]0.6722[/C][C]0.251982[/C][/ROW]
[ROW][C]58[/C][C]-0.113623[/C][C]-0.8874[/C][C]0.189169[/C][/ROW]
[ROW][C]59[/C][C]-0.044426[/C][C]-0.347[/C][C]0.364902[/C][/ROW]
[ROW][C]60[/C][C]0.009039[/C][C]0.0706[/C][C]0.471974[/C][/ROW]
[/TABLE]
Source: https://freestatistics.org/blog/index.php?pk=35171&T=2

Globally Unique Identifier (entire table): ba.freestatistics.org/blog/index.php?pk=35171&T=2

As an alternative you can also use a QR Code:  

The GUIDs for individual cells are displayed in the table below:

Partial Autocorrelation Function
Time lag kPACF(k)T-STATP-value
10.3587952.80230.003396
20.0245370.19160.424329
3-0.154661-1.20790.115866
4-0.212396-1.65890.051138
5-0.167145-1.30540.098322
6-0.40159-3.13650.001316
7-0.054028-0.4220.337263
8-0.159292-1.24410.109109
9-0.237724-1.85670.034093
10-0.166452-1.30.09924
110.0210090.16410.435104
120.5362674.18844.6e-05
13-0.353997-2.76480.003762
14-0.147315-1.15060.1272
150.0368160.28750.387336
160.0802980.62710.266452
17-0.10292-0.80380.212308
18-0.134617-1.05140.148613
19-0.129742-1.01330.157455
20-0.206059-1.60940.056349
210.0724830.56610.286698
220.006530.0510.479747
23-0.021505-0.1680.433585
24-0.114738-0.89610.186853
250.1033320.8070.211387
26-0.096613-0.75460.226705
27-0.085587-0.66850.253183
280.014630.11430.454703
290.0412550.32220.374198
300.0678750.53010.298977
310.034160.26680.395263
32-0.016394-0.1280.449268
33-0.056106-0.43820.331393
340.0448330.35020.363714
35-0.147409-1.15130.12705
36-0.193249-1.50930.068189
37-0.075008-0.58580.280076
38-0.075684-0.59110.278314
39-0.006087-0.04750.481117
40-0.136164-1.06350.145878
41-0.112431-0.87810.191664
420.0620130.48430.31494
43-0.036684-0.28650.387728
440.0131170.10240.45937
45-0.105291-0.82230.207041
46-0.070793-0.55290.291173
470.0100350.07840.468891
48-0.003323-0.0260.48969
49-0.006873-0.05370.478682
500.0020490.0160.493643
51-0.02398-0.18730.426026
52-0.073202-0.57170.284803
530.0294870.23030.409315
54-0.071835-0.56110.288409
55-0.013849-0.10820.45711
560.0343910.26860.394572
570.0860730.67220.251982
58-0.113623-0.88740.189169
59-0.044426-0.3470.364902
600.0090390.07060.471974


Parameters (Session):
par1 = 60 ; par2 = 1 ; par3 = 0 ; par4 = 0 ; par5 = 12 ;
Parameters (R input):
par1 = 60 ; par2 = 1 ; par3 = 0 ; par4 = 0 ; par5 = 12 ;
R code (references can be found in the software module):
if (par1 == 'Default') {
par1 = 10*log10(length(x))
} else {
par1 <- as.numeric(par1)
}
par2 <- as.numeric(par2)
par3 <- as.numeric(par3)
par4 <- as.numeric(par4)
par5 <- as.numeric(par5)
if (par2 == 0) {
x <- log(x)
} else {
x <- (x ^ par2 - 1) / par2
}
if (par3 > 0) x <- diff(x,lag=1,difference=par3)
if (par4 > 0) x <- diff(x,lag=par5,difference=par4)
bitmap(file='pic1.png')
racf <- acf(x,par1,main='Autocorrelation',xlab='lags',ylab='ACF')
dev.off()
bitmap(file='pic2.png')
rpacf <- pacf(x,par1,main='Partial Autocorrelation',xlab='lags',ylab='PACF')
dev.off()
(myacf <- c(racf$acf))
(mypacf <- c(rpacf$acf))
lengthx <- length(x)
sqrtn <- sqrt(lengthx)
load(file='createtable')
a<-table.start()
a<-table.row.start(a)
a<-table.element(a,'Autocorrelation Function',4,TRUE)
a<-table.row.end(a)
a<-table.row.start(a)
a<-table.element(a,'Time lag k',header=TRUE)
a<-table.element(a,hyperlink('basics.htm','ACF(k)','click here for more information about the Autocorrelation Function'),header=TRUE)
a<-table.element(a,'T-STAT',header=TRUE)
a<-table.element(a,'P-value',header=TRUE)
a<-table.row.end(a)
for (i in 2:(par1+1)) {
a<-table.row.start(a)
a<-table.element(a,i-1,header=TRUE)
a<-table.element(a,round(myacf[i],6))
mytstat <- myacf[i]*sqrtn
a<-table.element(a,round(mytstat,4))
a<-table.element(a,round(1-pt(abs(mytstat),lengthx),6))
a<-table.row.end(a)
}
a<-table.end(a)
table.save(a,file='mytable.tab')
a<-table.start()
a<-table.row.start(a)
a<-table.element(a,'Partial Autocorrelation Function',4,TRUE)
a<-table.row.end(a)
a<-table.row.start(a)
a<-table.element(a,'Time lag k',header=TRUE)
a<-table.element(a,hyperlink('basics.htm','PACF(k)','click here for more information about the Partial Autocorrelation Function'),header=TRUE)
a<-table.element(a,'T-STAT',header=TRUE)
a<-table.element(a,'P-value',header=TRUE)
a<-table.row.end(a)
for (i in 1:par1) {
a<-table.row.start(a)
a<-table.element(a,i,header=TRUE)
a<-table.element(a,round(mypacf[i],6))
mytstat <- mypacf[i]*sqrtn
a<-table.element(a,round(mytstat,4))
a<-table.element(a,round(1-pt(abs(mytstat),lengthx),6))
a<-table.row.end(a)
}
a<-table.end(a)
table.save(a,file='mytable1.tab')