Free Statistics

of Irreproducible Research!

Author's title

Author*The author of this computation has been verified*
R Software Modulerwasp_autocorrelation.wasp
Title produced by software(Partial) Autocorrelation Function
Date of computationFri, 19 Dec 2008 08:07:29 -0700
Cite this page as followsStatistical Computations at FreeStatistics.org, Office for Research Development and Education, URL https://freestatistics.org/blog/index.php?v=date/2008/Dec/19/t1229699413dljoqr13q0bpbew.htm/, Retrieved Wed, 15 May 2024 21:55:48 +0000
Statistical Computations at FreeStatistics.org, Office for Research Development and Education, URL https://freestatistics.org/blog/index.php?pk=35169, Retrieved Wed, 15 May 2024 21:55:48 +0000
QR Codes:

Original text written by user:
IsPrivate?No (this computation is public)
User-defined keywords
Estimated Impact227
Family? (F = Feedback message, R = changed R code, M = changed R Module, P = changed Parameters, D = changed Data)
-     [ARIMA Backward Selection] [Paper Arima Backw...] [2008-12-19 10:49:33] [f9b9e85820b2a54b20380c3265aca831]
- RMPD    [(Partial) Autocorrelation Function] [Paper H5 Vrouwen ...] [2008-12-19 15:07:29] [5e9e099b83e50415d7642e10d74756e4] [Current]
Feedback Forum

Post a new message
Dataseries X:
308347
298427
289231
291975
294912
293488
290555
284736
281818
287854
316263
325412
326011
328282
317480
317539
313737
312276
309391
302950
300316
304035
333476
337698
335932
323931
313927
314485
313218
309664
302963
298989
298423
301631
329765
335083
327616
309119
295916
291413
291542
284678
276475
272566
264981
263290
296806
303598
286994
276427
266424
267153
268381
262522
255542
253158
243803
250741
280445
285257
270976
261076
255603


Summary of computational transaction
Raw Inputview raw input (R code)
Raw Outputview raw output of R engine
Computing time3 seconds
R Server'Herman Ole Andreas Wold' @ 193.190.124.10:1001

\begin{tabular}{lllllllll}
\hline
Summary of computational transaction \tabularnewline
Raw Input & view raw input (R code)  \tabularnewline
Raw Output & view raw output of R engine  \tabularnewline
Computing time & 3 seconds \tabularnewline
R Server & 'Herman Ole Andreas Wold' @ 193.190.124.10:1001 \tabularnewline
\hline
\end{tabular}
%Source: https://freestatistics.org/blog/index.php?pk=35169&T=0

[TABLE]
[ROW][C]Summary of computational transaction[/C][/ROW]
[ROW][C]Raw Input[/C][C]view raw input (R code) [/C][/ROW]
[ROW][C]Raw Output[/C][C]view raw output of R engine [/C][/ROW]
[ROW][C]Computing time[/C][C]3 seconds[/C][/ROW]
[ROW][C]R Server[/C][C]'Herman Ole Andreas Wold' @ 193.190.124.10:1001[/C][/ROW]
[/TABLE]
Source: https://freestatistics.org/blog/index.php?pk=35169&T=0

Globally Unique Identifier (entire table): ba.freestatistics.org/blog/index.php?pk=35169&T=0

As an alternative you can also use a QR Code:  

The GUIDs for individual cells are displayed in the table below:

Summary of computational transaction
Raw Inputview raw input (R code)
Raw Outputview raw output of R engine
Computing time3 seconds
R Server'Herman Ole Andreas Wold' @ 193.190.124.10:1001


Autocorrelation Function
Time lag kACF(k)T-STATP-value
10.0001198e-040.499667
20.0117240.08290.46713
3-0.011346-0.08020.468189
40.0969750.68570.24803
50.0573740.40570.343348
60.0147550.10430.45866
70.0171880.12150.451876
80.0415790.2940.384985
90.0357040.25250.400859
10-0.12315-0.87080.194011
110.1604771.13470.130947
12-0.218738-1.54670.06412
13-0.074883-0.52950.2994
140.0988180.69880.243973
150.0273610.19350.423688
16-0.076601-0.54170.295232
17-0.105836-0.74840.228871
180.0220450.15590.438377
190.0963010.68090.249523
200.044610.31540.37687
21-0.060322-0.42650.335773
220.0640850.45310.326201
230.0541050.38260.351827
24-0.197427-1.3960.084439
25-0.060894-0.43060.334309
26-0.181551-1.28380.102571
27-0.022855-0.16160.436131
28-0.062487-0.44190.330251
290.0593640.41980.338226
30-0.051828-0.36650.357777
31-0.080447-0.56880.286004
32-0.151624-1.07210.144402
330.0761720.53860.296272
34-0.000116-8e-040.499675
35-0.15573-1.10120.138047
360.0519750.36750.357391
37-0.041849-0.29590.384259
380.0471030.33310.370238
39-0.018151-0.12830.449196
400.0323230.22860.410073
41-0.043656-0.30870.379418
420.0334950.23680.406873
43-0.007178-0.05080.479862
440.108560.76760.223157
45-0.05042-0.35650.361473
46-0.054505-0.38540.350784
470.0245880.17390.431336
480.0103880.07350.470868
490.0644060.45540.325389
50NANANA
51NANANA
52NANANA
53NANANA
54NANANA
55NANANA
56NANANA
57NANANA
58NANANA
59NANANA
60NANANA

\begin{tabular}{lllllllll}
\hline
Autocorrelation Function \tabularnewline
Time lag k & ACF(k) & T-STAT & P-value \tabularnewline
1 & 0.000119 & 8e-04 & 0.499667 \tabularnewline
2 & 0.011724 & 0.0829 & 0.46713 \tabularnewline
3 & -0.011346 & -0.0802 & 0.468189 \tabularnewline
4 & 0.096975 & 0.6857 & 0.24803 \tabularnewline
5 & 0.057374 & 0.4057 & 0.343348 \tabularnewline
6 & 0.014755 & 0.1043 & 0.45866 \tabularnewline
7 & 0.017188 & 0.1215 & 0.451876 \tabularnewline
8 & 0.041579 & 0.294 & 0.384985 \tabularnewline
9 & 0.035704 & 0.2525 & 0.400859 \tabularnewline
10 & -0.12315 & -0.8708 & 0.194011 \tabularnewline
11 & 0.160477 & 1.1347 & 0.130947 \tabularnewline
12 & -0.218738 & -1.5467 & 0.06412 \tabularnewline
13 & -0.074883 & -0.5295 & 0.2994 \tabularnewline
14 & 0.098818 & 0.6988 & 0.243973 \tabularnewline
15 & 0.027361 & 0.1935 & 0.423688 \tabularnewline
16 & -0.076601 & -0.5417 & 0.295232 \tabularnewline
17 & -0.105836 & -0.7484 & 0.228871 \tabularnewline
18 & 0.022045 & 0.1559 & 0.438377 \tabularnewline
19 & 0.096301 & 0.6809 & 0.249523 \tabularnewline
20 & 0.04461 & 0.3154 & 0.37687 \tabularnewline
21 & -0.060322 & -0.4265 & 0.335773 \tabularnewline
22 & 0.064085 & 0.4531 & 0.326201 \tabularnewline
23 & 0.054105 & 0.3826 & 0.351827 \tabularnewline
24 & -0.197427 & -1.396 & 0.084439 \tabularnewline
25 & -0.060894 & -0.4306 & 0.334309 \tabularnewline
26 & -0.181551 & -1.2838 & 0.102571 \tabularnewline
27 & -0.022855 & -0.1616 & 0.436131 \tabularnewline
28 & -0.062487 & -0.4419 & 0.330251 \tabularnewline
29 & 0.059364 & 0.4198 & 0.338226 \tabularnewline
30 & -0.051828 & -0.3665 & 0.357777 \tabularnewline
31 & -0.080447 & -0.5688 & 0.286004 \tabularnewline
32 & -0.151624 & -1.0721 & 0.144402 \tabularnewline
33 & 0.076172 & 0.5386 & 0.296272 \tabularnewline
34 & -0.000116 & -8e-04 & 0.499675 \tabularnewline
35 & -0.15573 & -1.1012 & 0.138047 \tabularnewline
36 & 0.051975 & 0.3675 & 0.357391 \tabularnewline
37 & -0.041849 & -0.2959 & 0.384259 \tabularnewline
38 & 0.047103 & 0.3331 & 0.370238 \tabularnewline
39 & -0.018151 & -0.1283 & 0.449196 \tabularnewline
40 & 0.032323 & 0.2286 & 0.410073 \tabularnewline
41 & -0.043656 & -0.3087 & 0.379418 \tabularnewline
42 & 0.033495 & 0.2368 & 0.406873 \tabularnewline
43 & -0.007178 & -0.0508 & 0.479862 \tabularnewline
44 & 0.10856 & 0.7676 & 0.223157 \tabularnewline
45 & -0.05042 & -0.3565 & 0.361473 \tabularnewline
46 & -0.054505 & -0.3854 & 0.350784 \tabularnewline
47 & 0.024588 & 0.1739 & 0.431336 \tabularnewline
48 & 0.010388 & 0.0735 & 0.470868 \tabularnewline
49 & 0.064406 & 0.4554 & 0.325389 \tabularnewline
50 & NA & NA & NA \tabularnewline
51 & NA & NA & NA \tabularnewline
52 & NA & NA & NA \tabularnewline
53 & NA & NA & NA \tabularnewline
54 & NA & NA & NA \tabularnewline
55 & NA & NA & NA \tabularnewline
56 & NA & NA & NA \tabularnewline
57 & NA & NA & NA \tabularnewline
58 & NA & NA & NA \tabularnewline
59 & NA & NA & NA \tabularnewline
60 & NA & NA & NA \tabularnewline
\hline
\end{tabular}
%Source: https://freestatistics.org/blog/index.php?pk=35169&T=1

[TABLE]
[ROW][C]Autocorrelation Function[/C][/ROW]
[ROW][C]Time lag k[/C][C]ACF(k)[/C][C]T-STAT[/C][C]P-value[/C][/ROW]
[ROW][C]1[/C][C]0.000119[/C][C]8e-04[/C][C]0.499667[/C][/ROW]
[ROW][C]2[/C][C]0.011724[/C][C]0.0829[/C][C]0.46713[/C][/ROW]
[ROW][C]3[/C][C]-0.011346[/C][C]-0.0802[/C][C]0.468189[/C][/ROW]
[ROW][C]4[/C][C]0.096975[/C][C]0.6857[/C][C]0.24803[/C][/ROW]
[ROW][C]5[/C][C]0.057374[/C][C]0.4057[/C][C]0.343348[/C][/ROW]
[ROW][C]6[/C][C]0.014755[/C][C]0.1043[/C][C]0.45866[/C][/ROW]
[ROW][C]7[/C][C]0.017188[/C][C]0.1215[/C][C]0.451876[/C][/ROW]
[ROW][C]8[/C][C]0.041579[/C][C]0.294[/C][C]0.384985[/C][/ROW]
[ROW][C]9[/C][C]0.035704[/C][C]0.2525[/C][C]0.400859[/C][/ROW]
[ROW][C]10[/C][C]-0.12315[/C][C]-0.8708[/C][C]0.194011[/C][/ROW]
[ROW][C]11[/C][C]0.160477[/C][C]1.1347[/C][C]0.130947[/C][/ROW]
[ROW][C]12[/C][C]-0.218738[/C][C]-1.5467[/C][C]0.06412[/C][/ROW]
[ROW][C]13[/C][C]-0.074883[/C][C]-0.5295[/C][C]0.2994[/C][/ROW]
[ROW][C]14[/C][C]0.098818[/C][C]0.6988[/C][C]0.243973[/C][/ROW]
[ROW][C]15[/C][C]0.027361[/C][C]0.1935[/C][C]0.423688[/C][/ROW]
[ROW][C]16[/C][C]-0.076601[/C][C]-0.5417[/C][C]0.295232[/C][/ROW]
[ROW][C]17[/C][C]-0.105836[/C][C]-0.7484[/C][C]0.228871[/C][/ROW]
[ROW][C]18[/C][C]0.022045[/C][C]0.1559[/C][C]0.438377[/C][/ROW]
[ROW][C]19[/C][C]0.096301[/C][C]0.6809[/C][C]0.249523[/C][/ROW]
[ROW][C]20[/C][C]0.04461[/C][C]0.3154[/C][C]0.37687[/C][/ROW]
[ROW][C]21[/C][C]-0.060322[/C][C]-0.4265[/C][C]0.335773[/C][/ROW]
[ROW][C]22[/C][C]0.064085[/C][C]0.4531[/C][C]0.326201[/C][/ROW]
[ROW][C]23[/C][C]0.054105[/C][C]0.3826[/C][C]0.351827[/C][/ROW]
[ROW][C]24[/C][C]-0.197427[/C][C]-1.396[/C][C]0.084439[/C][/ROW]
[ROW][C]25[/C][C]-0.060894[/C][C]-0.4306[/C][C]0.334309[/C][/ROW]
[ROW][C]26[/C][C]-0.181551[/C][C]-1.2838[/C][C]0.102571[/C][/ROW]
[ROW][C]27[/C][C]-0.022855[/C][C]-0.1616[/C][C]0.436131[/C][/ROW]
[ROW][C]28[/C][C]-0.062487[/C][C]-0.4419[/C][C]0.330251[/C][/ROW]
[ROW][C]29[/C][C]0.059364[/C][C]0.4198[/C][C]0.338226[/C][/ROW]
[ROW][C]30[/C][C]-0.051828[/C][C]-0.3665[/C][C]0.357777[/C][/ROW]
[ROW][C]31[/C][C]-0.080447[/C][C]-0.5688[/C][C]0.286004[/C][/ROW]
[ROW][C]32[/C][C]-0.151624[/C][C]-1.0721[/C][C]0.144402[/C][/ROW]
[ROW][C]33[/C][C]0.076172[/C][C]0.5386[/C][C]0.296272[/C][/ROW]
[ROW][C]34[/C][C]-0.000116[/C][C]-8e-04[/C][C]0.499675[/C][/ROW]
[ROW][C]35[/C][C]-0.15573[/C][C]-1.1012[/C][C]0.138047[/C][/ROW]
[ROW][C]36[/C][C]0.051975[/C][C]0.3675[/C][C]0.357391[/C][/ROW]
[ROW][C]37[/C][C]-0.041849[/C][C]-0.2959[/C][C]0.384259[/C][/ROW]
[ROW][C]38[/C][C]0.047103[/C][C]0.3331[/C][C]0.370238[/C][/ROW]
[ROW][C]39[/C][C]-0.018151[/C][C]-0.1283[/C][C]0.449196[/C][/ROW]
[ROW][C]40[/C][C]0.032323[/C][C]0.2286[/C][C]0.410073[/C][/ROW]
[ROW][C]41[/C][C]-0.043656[/C][C]-0.3087[/C][C]0.379418[/C][/ROW]
[ROW][C]42[/C][C]0.033495[/C][C]0.2368[/C][C]0.406873[/C][/ROW]
[ROW][C]43[/C][C]-0.007178[/C][C]-0.0508[/C][C]0.479862[/C][/ROW]
[ROW][C]44[/C][C]0.10856[/C][C]0.7676[/C][C]0.223157[/C][/ROW]
[ROW][C]45[/C][C]-0.05042[/C][C]-0.3565[/C][C]0.361473[/C][/ROW]
[ROW][C]46[/C][C]-0.054505[/C][C]-0.3854[/C][C]0.350784[/C][/ROW]
[ROW][C]47[/C][C]0.024588[/C][C]0.1739[/C][C]0.431336[/C][/ROW]
[ROW][C]48[/C][C]0.010388[/C][C]0.0735[/C][C]0.470868[/C][/ROW]
[ROW][C]49[/C][C]0.064406[/C][C]0.4554[/C][C]0.325389[/C][/ROW]
[ROW][C]50[/C][C]NA[/C][C]NA[/C][C]NA[/C][/ROW]
[ROW][C]51[/C][C]NA[/C][C]NA[/C][C]NA[/C][/ROW]
[ROW][C]52[/C][C]NA[/C][C]NA[/C][C]NA[/C][/ROW]
[ROW][C]53[/C][C]NA[/C][C]NA[/C][C]NA[/C][/ROW]
[ROW][C]54[/C][C]NA[/C][C]NA[/C][C]NA[/C][/ROW]
[ROW][C]55[/C][C]NA[/C][C]NA[/C][C]NA[/C][/ROW]
[ROW][C]56[/C][C]NA[/C][C]NA[/C][C]NA[/C][/ROW]
[ROW][C]57[/C][C]NA[/C][C]NA[/C][C]NA[/C][/ROW]
[ROW][C]58[/C][C]NA[/C][C]NA[/C][C]NA[/C][/ROW]
[ROW][C]59[/C][C]NA[/C][C]NA[/C][C]NA[/C][/ROW]
[ROW][C]60[/C][C]NA[/C][C]NA[/C][C]NA[/C][/ROW]
[/TABLE]
Source: https://freestatistics.org/blog/index.php?pk=35169&T=1

Globally Unique Identifier (entire table): ba.freestatistics.org/blog/index.php?pk=35169&T=1

As an alternative you can also use a QR Code:  

The GUIDs for individual cells are displayed in the table below:

Autocorrelation Function
Time lag kACF(k)T-STATP-value
10.0001198e-040.499667
20.0117240.08290.46713
3-0.011346-0.08020.468189
40.0969750.68570.24803
50.0573740.40570.343348
60.0147550.10430.45866
70.0171880.12150.451876
80.0415790.2940.384985
90.0357040.25250.400859
10-0.12315-0.87080.194011
110.1604771.13470.130947
12-0.218738-1.54670.06412
13-0.074883-0.52950.2994
140.0988180.69880.243973
150.0273610.19350.423688
16-0.076601-0.54170.295232
17-0.105836-0.74840.228871
180.0220450.15590.438377
190.0963010.68090.249523
200.044610.31540.37687
21-0.060322-0.42650.335773
220.0640850.45310.326201
230.0541050.38260.351827
24-0.197427-1.3960.084439
25-0.060894-0.43060.334309
26-0.181551-1.28380.102571
27-0.022855-0.16160.436131
28-0.062487-0.44190.330251
290.0593640.41980.338226
30-0.051828-0.36650.357777
31-0.080447-0.56880.286004
32-0.151624-1.07210.144402
330.0761720.53860.296272
34-0.000116-8e-040.499675
35-0.15573-1.10120.138047
360.0519750.36750.357391
37-0.041849-0.29590.384259
380.0471030.33310.370238
39-0.018151-0.12830.449196
400.0323230.22860.410073
41-0.043656-0.30870.379418
420.0334950.23680.406873
43-0.007178-0.05080.479862
440.108560.76760.223157
45-0.05042-0.35650.361473
46-0.054505-0.38540.350784
470.0245880.17390.431336
480.0103880.07350.470868
490.0644060.45540.325389
50NANANA
51NANANA
52NANANA
53NANANA
54NANANA
55NANANA
56NANANA
57NANANA
58NANANA
59NANANA
60NANANA


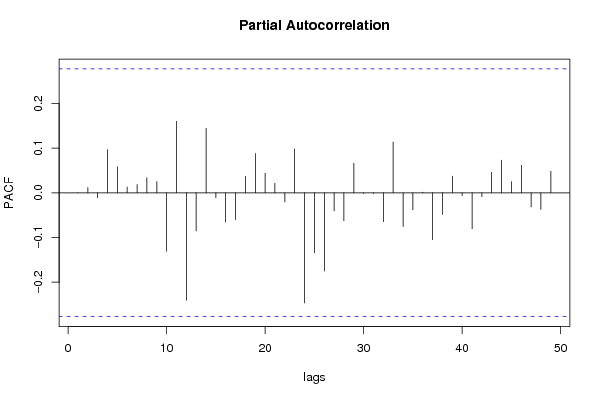
Partial Autocorrelation Function
Time lag kPACF(k)T-STATP-value
10.0001198e-040.499667
20.0117240.08290.46713
3-0.01135-0.08030.468177
40.0968670.6850.248268
50.0580450.41040.341617
60.0127980.09050.464127
70.0184920.13080.448244
80.0338860.23960.405806
90.0252910.17880.429394
10-0.130992-0.92630.179383
110.1598641.13040.131848
12-0.240444-1.70020.047654
13-0.085253-0.60280.274673
140.1443191.02050.156205
15-0.010999-0.07780.469158
16-0.065317-0.46190.323092
17-0.059993-0.42420.336613
180.0368680.26070.397699
190.0880850.62290.268105
200.043970.31090.37858
210.0215290.15220.439809
22-0.020566-0.14540.442482
230.0982330.69460.245257
24-0.246534-1.74330.043718
25-0.134387-0.95030.173275
26-0.175096-1.23810.110727
27-0.04022-0.28440.38864
28-0.062502-0.4420.330213
290.0663190.46890.320572
30-0.001408-0.010.496049
31-0.001755-0.01240.495075
32-0.064661-0.45720.324746
330.1134870.80250.213039
34-0.075579-0.53440.297707
35-0.03818-0.270.394147
360.0014240.01010.496004
37-0.104958-0.74220.230731
38-0.04848-0.34280.366591
390.0372660.26350.396619
40-0.006396-0.04520.482053
41-0.080306-0.56780.286339
42-0.008588-0.06070.475911
430.0461480.32630.372773
440.0729380.51580.304151
450.0250980.17750.429928
460.0614540.43450.33288
47-0.03177-0.22470.411583
48-0.037216-0.26320.396756
490.0480520.33980.367724
50NANANA
51NANANA
52NANANA
53NANANA
54NANANA
55NANANA
56NANANA
57NANANA
58NANANA
59NANANA
60NANANA

\begin{tabular}{lllllllll}
\hline
Partial Autocorrelation Function \tabularnewline
Time lag k & PACF(k) & T-STAT & P-value \tabularnewline
1 & 0.000119 & 8e-04 & 0.499667 \tabularnewline
2 & 0.011724 & 0.0829 & 0.46713 \tabularnewline
3 & -0.01135 & -0.0803 & 0.468177 \tabularnewline
4 & 0.096867 & 0.685 & 0.248268 \tabularnewline
5 & 0.058045 & 0.4104 & 0.341617 \tabularnewline
6 & 0.012798 & 0.0905 & 0.464127 \tabularnewline
7 & 0.018492 & 0.1308 & 0.448244 \tabularnewline
8 & 0.033886 & 0.2396 & 0.405806 \tabularnewline
9 & 0.025291 & 0.1788 & 0.429394 \tabularnewline
10 & -0.130992 & -0.9263 & 0.179383 \tabularnewline
11 & 0.159864 & 1.1304 & 0.131848 \tabularnewline
12 & -0.240444 & -1.7002 & 0.047654 \tabularnewline
13 & -0.085253 & -0.6028 & 0.274673 \tabularnewline
14 & 0.144319 & 1.0205 & 0.156205 \tabularnewline
15 & -0.010999 & -0.0778 & 0.469158 \tabularnewline
16 & -0.065317 & -0.4619 & 0.323092 \tabularnewline
17 & -0.059993 & -0.4242 & 0.336613 \tabularnewline
18 & 0.036868 & 0.2607 & 0.397699 \tabularnewline
19 & 0.088085 & 0.6229 & 0.268105 \tabularnewline
20 & 0.04397 & 0.3109 & 0.37858 \tabularnewline
21 & 0.021529 & 0.1522 & 0.439809 \tabularnewline
22 & -0.020566 & -0.1454 & 0.442482 \tabularnewline
23 & 0.098233 & 0.6946 & 0.245257 \tabularnewline
24 & -0.246534 & -1.7433 & 0.043718 \tabularnewline
25 & -0.134387 & -0.9503 & 0.173275 \tabularnewline
26 & -0.175096 & -1.2381 & 0.110727 \tabularnewline
27 & -0.04022 & -0.2844 & 0.38864 \tabularnewline
28 & -0.062502 & -0.442 & 0.330213 \tabularnewline
29 & 0.066319 & 0.4689 & 0.320572 \tabularnewline
30 & -0.001408 & -0.01 & 0.496049 \tabularnewline
31 & -0.001755 & -0.0124 & 0.495075 \tabularnewline
32 & -0.064661 & -0.4572 & 0.324746 \tabularnewline
33 & 0.113487 & 0.8025 & 0.213039 \tabularnewline
34 & -0.075579 & -0.5344 & 0.297707 \tabularnewline
35 & -0.03818 & -0.27 & 0.394147 \tabularnewline
36 & 0.001424 & 0.0101 & 0.496004 \tabularnewline
37 & -0.104958 & -0.7422 & 0.230731 \tabularnewline
38 & -0.04848 & -0.3428 & 0.366591 \tabularnewline
39 & 0.037266 & 0.2635 & 0.396619 \tabularnewline
40 & -0.006396 & -0.0452 & 0.482053 \tabularnewline
41 & -0.080306 & -0.5678 & 0.286339 \tabularnewline
42 & -0.008588 & -0.0607 & 0.475911 \tabularnewline
43 & 0.046148 & 0.3263 & 0.372773 \tabularnewline
44 & 0.072938 & 0.5158 & 0.304151 \tabularnewline
45 & 0.025098 & 0.1775 & 0.429928 \tabularnewline
46 & 0.061454 & 0.4345 & 0.33288 \tabularnewline
47 & -0.03177 & -0.2247 & 0.411583 \tabularnewline
48 & -0.037216 & -0.2632 & 0.396756 \tabularnewline
49 & 0.048052 & 0.3398 & 0.367724 \tabularnewline
50 & NA & NA & NA \tabularnewline
51 & NA & NA & NA \tabularnewline
52 & NA & NA & NA \tabularnewline
53 & NA & NA & NA \tabularnewline
54 & NA & NA & NA \tabularnewline
55 & NA & NA & NA \tabularnewline
56 & NA & NA & NA \tabularnewline
57 & NA & NA & NA \tabularnewline
58 & NA & NA & NA \tabularnewline
59 & NA & NA & NA \tabularnewline
60 & NA & NA & NA \tabularnewline
\hline
\end{tabular}
%Source: https://freestatistics.org/blog/index.php?pk=35169&T=2

[TABLE]
[ROW][C]Partial Autocorrelation Function[/C][/ROW]
[ROW][C]Time lag k[/C][C]PACF(k)[/C][C]T-STAT[/C][C]P-value[/C][/ROW]
[ROW][C]1[/C][C]0.000119[/C][C]8e-04[/C][C]0.499667[/C][/ROW]
[ROW][C]2[/C][C]0.011724[/C][C]0.0829[/C][C]0.46713[/C][/ROW]
[ROW][C]3[/C][C]-0.01135[/C][C]-0.0803[/C][C]0.468177[/C][/ROW]
[ROW][C]4[/C][C]0.096867[/C][C]0.685[/C][C]0.248268[/C][/ROW]
[ROW][C]5[/C][C]0.058045[/C][C]0.4104[/C][C]0.341617[/C][/ROW]
[ROW][C]6[/C][C]0.012798[/C][C]0.0905[/C][C]0.464127[/C][/ROW]
[ROW][C]7[/C][C]0.018492[/C][C]0.1308[/C][C]0.448244[/C][/ROW]
[ROW][C]8[/C][C]0.033886[/C][C]0.2396[/C][C]0.405806[/C][/ROW]
[ROW][C]9[/C][C]0.025291[/C][C]0.1788[/C][C]0.429394[/C][/ROW]
[ROW][C]10[/C][C]-0.130992[/C][C]-0.9263[/C][C]0.179383[/C][/ROW]
[ROW][C]11[/C][C]0.159864[/C][C]1.1304[/C][C]0.131848[/C][/ROW]
[ROW][C]12[/C][C]-0.240444[/C][C]-1.7002[/C][C]0.047654[/C][/ROW]
[ROW][C]13[/C][C]-0.085253[/C][C]-0.6028[/C][C]0.274673[/C][/ROW]
[ROW][C]14[/C][C]0.144319[/C][C]1.0205[/C][C]0.156205[/C][/ROW]
[ROW][C]15[/C][C]-0.010999[/C][C]-0.0778[/C][C]0.469158[/C][/ROW]
[ROW][C]16[/C][C]-0.065317[/C][C]-0.4619[/C][C]0.323092[/C][/ROW]
[ROW][C]17[/C][C]-0.059993[/C][C]-0.4242[/C][C]0.336613[/C][/ROW]
[ROW][C]18[/C][C]0.036868[/C][C]0.2607[/C][C]0.397699[/C][/ROW]
[ROW][C]19[/C][C]0.088085[/C][C]0.6229[/C][C]0.268105[/C][/ROW]
[ROW][C]20[/C][C]0.04397[/C][C]0.3109[/C][C]0.37858[/C][/ROW]
[ROW][C]21[/C][C]0.021529[/C][C]0.1522[/C][C]0.439809[/C][/ROW]
[ROW][C]22[/C][C]-0.020566[/C][C]-0.1454[/C][C]0.442482[/C][/ROW]
[ROW][C]23[/C][C]0.098233[/C][C]0.6946[/C][C]0.245257[/C][/ROW]
[ROW][C]24[/C][C]-0.246534[/C][C]-1.7433[/C][C]0.043718[/C][/ROW]
[ROW][C]25[/C][C]-0.134387[/C][C]-0.9503[/C][C]0.173275[/C][/ROW]
[ROW][C]26[/C][C]-0.175096[/C][C]-1.2381[/C][C]0.110727[/C][/ROW]
[ROW][C]27[/C][C]-0.04022[/C][C]-0.2844[/C][C]0.38864[/C][/ROW]
[ROW][C]28[/C][C]-0.062502[/C][C]-0.442[/C][C]0.330213[/C][/ROW]
[ROW][C]29[/C][C]0.066319[/C][C]0.4689[/C][C]0.320572[/C][/ROW]
[ROW][C]30[/C][C]-0.001408[/C][C]-0.01[/C][C]0.496049[/C][/ROW]
[ROW][C]31[/C][C]-0.001755[/C][C]-0.0124[/C][C]0.495075[/C][/ROW]
[ROW][C]32[/C][C]-0.064661[/C][C]-0.4572[/C][C]0.324746[/C][/ROW]
[ROW][C]33[/C][C]0.113487[/C][C]0.8025[/C][C]0.213039[/C][/ROW]
[ROW][C]34[/C][C]-0.075579[/C][C]-0.5344[/C][C]0.297707[/C][/ROW]
[ROW][C]35[/C][C]-0.03818[/C][C]-0.27[/C][C]0.394147[/C][/ROW]
[ROW][C]36[/C][C]0.001424[/C][C]0.0101[/C][C]0.496004[/C][/ROW]
[ROW][C]37[/C][C]-0.104958[/C][C]-0.7422[/C][C]0.230731[/C][/ROW]
[ROW][C]38[/C][C]-0.04848[/C][C]-0.3428[/C][C]0.366591[/C][/ROW]
[ROW][C]39[/C][C]0.037266[/C][C]0.2635[/C][C]0.396619[/C][/ROW]
[ROW][C]40[/C][C]-0.006396[/C][C]-0.0452[/C][C]0.482053[/C][/ROW]
[ROW][C]41[/C][C]-0.080306[/C][C]-0.5678[/C][C]0.286339[/C][/ROW]
[ROW][C]42[/C][C]-0.008588[/C][C]-0.0607[/C][C]0.475911[/C][/ROW]
[ROW][C]43[/C][C]0.046148[/C][C]0.3263[/C][C]0.372773[/C][/ROW]
[ROW][C]44[/C][C]0.072938[/C][C]0.5158[/C][C]0.304151[/C][/ROW]
[ROW][C]45[/C][C]0.025098[/C][C]0.1775[/C][C]0.429928[/C][/ROW]
[ROW][C]46[/C][C]0.061454[/C][C]0.4345[/C][C]0.33288[/C][/ROW]
[ROW][C]47[/C][C]-0.03177[/C][C]-0.2247[/C][C]0.411583[/C][/ROW]
[ROW][C]48[/C][C]-0.037216[/C][C]-0.2632[/C][C]0.396756[/C][/ROW]
[ROW][C]49[/C][C]0.048052[/C][C]0.3398[/C][C]0.367724[/C][/ROW]
[ROW][C]50[/C][C]NA[/C][C]NA[/C][C]NA[/C][/ROW]
[ROW][C]51[/C][C]NA[/C][C]NA[/C][C]NA[/C][/ROW]
[ROW][C]52[/C][C]NA[/C][C]NA[/C][C]NA[/C][/ROW]
[ROW][C]53[/C][C]NA[/C][C]NA[/C][C]NA[/C][/ROW]
[ROW][C]54[/C][C]NA[/C][C]NA[/C][C]NA[/C][/ROW]
[ROW][C]55[/C][C]NA[/C][C]NA[/C][C]NA[/C][/ROW]
[ROW][C]56[/C][C]NA[/C][C]NA[/C][C]NA[/C][/ROW]
[ROW][C]57[/C][C]NA[/C][C]NA[/C][C]NA[/C][/ROW]
[ROW][C]58[/C][C]NA[/C][C]NA[/C][C]NA[/C][/ROW]
[ROW][C]59[/C][C]NA[/C][C]NA[/C][C]NA[/C][/ROW]
[ROW][C]60[/C][C]NA[/C][C]NA[/C][C]NA[/C][/ROW]
[/TABLE]
Source: https://freestatistics.org/blog/index.php?pk=35169&T=2

Globally Unique Identifier (entire table): ba.freestatistics.org/blog/index.php?pk=35169&T=2

As an alternative you can also use a QR Code:  

The GUIDs for individual cells are displayed in the table below:

Partial Autocorrelation Function
Time lag kPACF(k)T-STATP-value
10.0001198e-040.499667
20.0117240.08290.46713
3-0.01135-0.08030.468177
40.0968670.6850.248268
50.0580450.41040.341617
60.0127980.09050.464127
70.0184920.13080.448244
80.0338860.23960.405806
90.0252910.17880.429394
10-0.130992-0.92630.179383
110.1598641.13040.131848
12-0.240444-1.70020.047654
13-0.085253-0.60280.274673
140.1443191.02050.156205
15-0.010999-0.07780.469158
16-0.065317-0.46190.323092
17-0.059993-0.42420.336613
180.0368680.26070.397699
190.0880850.62290.268105
200.043970.31090.37858
210.0215290.15220.439809
22-0.020566-0.14540.442482
230.0982330.69460.245257
24-0.246534-1.74330.043718
25-0.134387-0.95030.173275
26-0.175096-1.23810.110727
27-0.04022-0.28440.38864
28-0.062502-0.4420.330213
290.0663190.46890.320572
30-0.001408-0.010.496049
31-0.001755-0.01240.495075
32-0.064661-0.45720.324746
330.1134870.80250.213039
34-0.075579-0.53440.297707
35-0.03818-0.270.394147
360.0014240.01010.496004
37-0.104958-0.74220.230731
38-0.04848-0.34280.366591
390.0372660.26350.396619
40-0.006396-0.04520.482053
41-0.080306-0.56780.286339
42-0.008588-0.06070.475911
430.0461480.32630.372773
440.0729380.51580.304151
450.0250980.17750.429928
460.0614540.43450.33288
47-0.03177-0.22470.411583
48-0.037216-0.26320.396756
490.0480520.33980.367724
50NANANA
51NANANA
52NANANA
53NANANA
54NANANA
55NANANA
56NANANA
57NANANA
58NANANA
59NANANA
60NANANA


Parameters (Session):
par1 = 60 ; par2 = 1 ; par3 = 1 ; par4 = 1 ; par5 = 12 ;
Parameters (R input):
par1 = 60 ; par2 = 1 ; par3 = 1 ; par4 = 1 ; par5 = 12 ;
R code (references can be found in the software module):
if (par1 == 'Default') {
par1 = 10*log10(length(x))
} else {
par1 <- as.numeric(par1)
}
par2 <- as.numeric(par2)
par3 <- as.numeric(par3)
par4 <- as.numeric(par4)
par5 <- as.numeric(par5)
if (par2 == 0) {
x <- log(x)
} else {
x <- (x ^ par2 - 1) / par2
}
if (par3 > 0) x <- diff(x,lag=1,difference=par3)
if (par4 > 0) x <- diff(x,lag=par5,difference=par4)
bitmap(file='pic1.png')
racf <- acf(x,par1,main='Autocorrelation',xlab='lags',ylab='ACF')
dev.off()
bitmap(file='pic2.png')
rpacf <- pacf(x,par1,main='Partial Autocorrelation',xlab='lags',ylab='PACF')
dev.off()
(myacf <- c(racf$acf))
(mypacf <- c(rpacf$acf))
lengthx <- length(x)
sqrtn <- sqrt(lengthx)
load(file='createtable')
a<-table.start()
a<-table.row.start(a)
a<-table.element(a,'Autocorrelation Function',4,TRUE)
a<-table.row.end(a)
a<-table.row.start(a)
a<-table.element(a,'Time lag k',header=TRUE)
a<-table.element(a,hyperlink('basics.htm','ACF(k)','click here for more information about the Autocorrelation Function'),header=TRUE)
a<-table.element(a,'T-STAT',header=TRUE)
a<-table.element(a,'P-value',header=TRUE)
a<-table.row.end(a)
for (i in 2:(par1+1)) {
a<-table.row.start(a)
a<-table.element(a,i-1,header=TRUE)
a<-table.element(a,round(myacf[i],6))
mytstat <- myacf[i]*sqrtn
a<-table.element(a,round(mytstat,4))
a<-table.element(a,round(1-pt(abs(mytstat),lengthx),6))
a<-table.row.end(a)
}
a<-table.end(a)
table.save(a,file='mytable.tab')
a<-table.start()
a<-table.row.start(a)
a<-table.element(a,'Partial Autocorrelation Function',4,TRUE)
a<-table.row.end(a)
a<-table.row.start(a)
a<-table.element(a,'Time lag k',header=TRUE)
a<-table.element(a,hyperlink('basics.htm','PACF(k)','click here for more information about the Partial Autocorrelation Function'),header=TRUE)
a<-table.element(a,'T-STAT',header=TRUE)
a<-table.element(a,'P-value',header=TRUE)
a<-table.row.end(a)
for (i in 1:par1) {
a<-table.row.start(a)
a<-table.element(a,i,header=TRUE)
a<-table.element(a,round(mypacf[i],6))
mytstat <- mypacf[i]*sqrtn
a<-table.element(a,round(mytstat,4))
a<-table.element(a,round(1-pt(abs(mytstat),lengthx),6))
a<-table.row.end(a)
}
a<-table.end(a)
table.save(a,file='mytable1.tab')