Free Statistics
of Irreproducible Research!
Description of Statistical Computation | |||||||||||||||||||||||||||||||||||||||||||||||||||||
|---|---|---|---|---|---|---|---|---|---|---|---|---|---|---|---|---|---|---|---|---|---|---|---|---|---|---|---|---|---|---|---|---|---|---|---|---|---|---|---|---|---|---|---|---|---|---|---|---|---|---|---|---|---|
| Author's title | |||||||||||||||||||||||||||||||||||||||||||||||||||||
| Author | *The author of this computation has been verified* | ||||||||||||||||||||||||||||||||||||||||||||||||||||
| R Software Module | rwasp_edauni.wasp | ||||||||||||||||||||||||||||||||||||||||||||||||||||
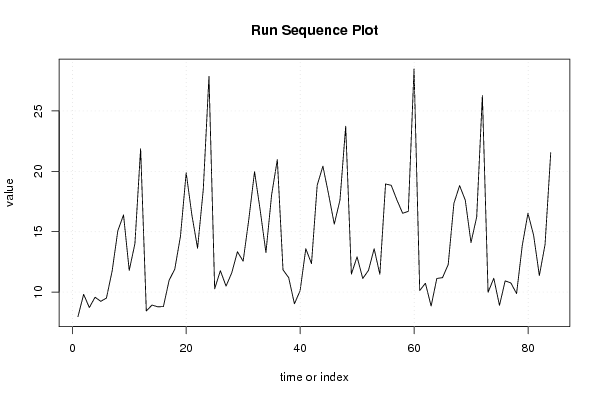
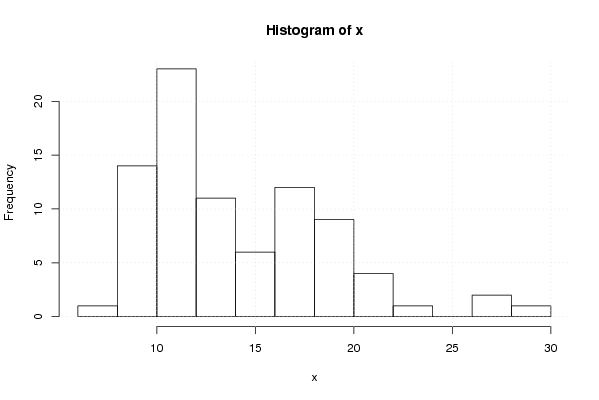
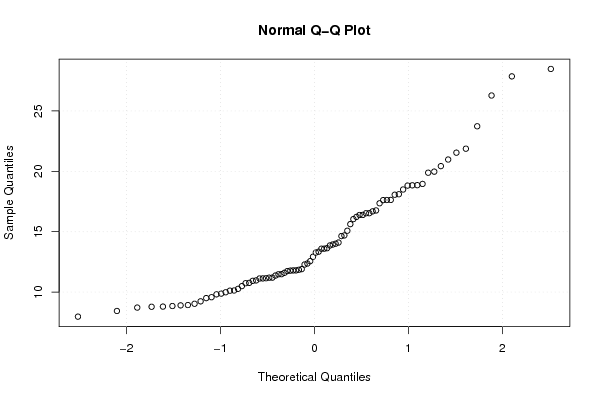
| Title produced by software | Univariate Explorative Data Analysis | ||||||||||||||||||||||||||||||||||||||||||||||||||||
| Date of computation | Fri, 19 Dec 2008 07:44:30 -0700 | ||||||||||||||||||||||||||||||||||||||||||||||||||||
| Cite this page as follows | Statistical Computations at FreeStatistics.org, Office for Research Development and Education, URL https://freestatistics.org/blog/index.php?v=date/2008/Dec/19/t12296979850kz5p8m1bjkr6jf.htm/, Retrieved Wed, 15 May 2024 10:51:37 +0000 | ||||||||||||||||||||||||||||||||||||||||||||||||||||
| Statistical Computations at FreeStatistics.org, Office for Research Development and Education, URL https://freestatistics.org/blog/index.php?pk=35159, Retrieved Wed, 15 May 2024 10:51:37 +0000 | |||||||||||||||||||||||||||||||||||||||||||||||||||||
| QR Codes: | |||||||||||||||||||||||||||||||||||||||||||||||||||||
|
| |||||||||||||||||||||||||||||||||||||||||||||||||||||
| Original text written by user: | |||||||||||||||||||||||||||||||||||||||||||||||||||||
| IsPrivate? | No (this computation is public) | ||||||||||||||||||||||||||||||||||||||||||||||||||||
| User-defined keywords | |||||||||||||||||||||||||||||||||||||||||||||||||||||
| Estimated Impact | 168 | ||||||||||||||||||||||||||||||||||||||||||||||||||||
Tree of Dependent Computations | |||||||||||||||||||||||||||||||||||||||||||||||||||||
| Family? (F = Feedback message, R = changed R code, M = changed R Module, P = changed Parameters, D = changed Data) | |||||||||||||||||||||||||||||||||||||||||||||||||||||
| F [Univariate Explorative Data Analysis] [Investigating Dis...] [2007-10-21 18:26:46] [b9964c45117f7aac638ab9056d451faa] - PD [Univariate Explorative Data Analysis] [Univariate explor...] [2008-12-19 14:44:30] [9ba97de59bb4d2edf0cfeac4ca7d2b73] [Current] | |||||||||||||||||||||||||||||||||||||||||||||||||||||
| Feedback Forum | |||||||||||||||||||||||||||||||||||||||||||||||||||||
Post a new message | |||||||||||||||||||||||||||||||||||||||||||||||||||||
Dataset | |||||||||||||||||||||||||||||||||||||||||||||||||||||
| Dataseries X: | |||||||||||||||||||||||||||||||||||||||||||||||||||||
7,968826781 9,816920943 8,719451905 9,578609279 9,237957039 9,504384998 11,74024304 15,0813138 16,39006231 11,7966217 14,00695911 21,87143653 8,437443505 8,92920304 8,78733936 8,801156312 10,96936363 11,90525463 14,63906985 19,8830923 16,38546856 13,63620826 18,49491538 27,85870452 10,26908774 11,77670213 10,49849708 11,59769015 13,3447991 12,56215774 16,04223844 19,97154374 16,76067856 13,27442603 18,06058206 20,97417867 11,84839865 11,1937969 9,034930448 10,11798757 13,59429541 12,36409614 18,85359423 20,42958924 18,10215117 15,62689162 17,63002196 23,72893919 11,48604253 12,92667895 11,12814654 11,80092249 13,59338843 11,47580922 18,95547684 18,84070823 17,62468789 16,52851434 16,68686416 28,47325005 10,13471786 10,73736694 8,846490693 11,13447741 11,19904194 12,28408482 17,35287363 18,8196253 17,61475293 14,10254872 16,22664563 26,27411598 9,987813135 11,14854462 8,902315691 10,93318504 10,76504044 9,875081688 13,86360119 16,53316349 14,69498101 11,37004918 13,93897805 21,54230898 | |||||||||||||||||||||||||||||||||||||||||||||||||||||
Tables (Output of Computation) | |||||||||||||||||||||||||||||||||||||||||||||||||||||
| |||||||||||||||||||||||||||||||||||||||||||||||||||||
Figures (Output of Computation) | |||||||||||||||||||||||||||||||||||||||||||||||||||||
Input Parameters & R Code | |||||||||||||||||||||||||||||||||||||||||||||||||||||
| Parameters (Session): | |||||||||||||||||||||||||||||||||||||||||||||||||||||
| Parameters (R input): | |||||||||||||||||||||||||||||||||||||||||||||||||||||
| par1 = 0 ; par2 = 0 ; | |||||||||||||||||||||||||||||||||||||||||||||||||||||
| R code (references can be found in the software module): | |||||||||||||||||||||||||||||||||||||||||||||||||||||
par1 <- as.numeric(par1) | |||||||||||||||||||||||||||||||||||||||||||||||||||||