Free Statistics

of Irreproducible Research!

Author's title

Author*The author of this computation has been verified*
R Software Modulerwasp_arimabackwardselection.wasp
Title produced by softwareARIMA Backward Selection
Date of computationFri, 19 Dec 2008 07:06:50 -0700
Cite this page as followsStatistical Computations at FreeStatistics.org, Office for Research Development and Education, URL https://freestatistics.org/blog/index.php?v=date/2008/Dec/19/t1229695651f9dqxcm0122ntta.htm/, Retrieved Wed, 15 May 2024 23:19:22 +0000
Statistical Computations at FreeStatistics.org, Office for Research Development and Education, URL https://freestatistics.org/blog/index.php?pk=35141, Retrieved Wed, 15 May 2024 23:19:22 +0000
QR Codes:

Original text written by user:
IsPrivate?No (this computation is public)
User-defined keywords
Estimated Impact176
Family? (F = Feedback message, R = changed R code, M = changed R Module, P = changed Parameters, D = changed Data)
-     [(Partial) Autocorrelation Function] [acf Belgie] [2008-12-18 16:23:46] [005293453b571dbccb80b45226e44173]
-   P   [(Partial) Autocorrelation Function] [acf paper d=1 D=0] [2008-12-18 18:54:33] [005293453b571dbccb80b45226e44173]
-   P     [(Partial) Autocorrelation Function] [acf d=1 D=1] [2008-12-18 19:00:40] [005293453b571dbccb80b45226e44173]
- RMP       [ARIMA Backward Selection] [arima backward be...] [2008-12-18 21:15:10] [005293453b571dbccb80b45226e44173]
-   P         [ARIMA Backward Selection] [arima backward be...] [2008-12-18 21:23:00] [005293453b571dbccb80b45226e44173]
-   PD            [ARIMA Backward Selection] [ARIMA backward se...] [2008-12-19 14:06:50] [80c86a3cb2b11c1c3a9a42d67fc5074f] [Current]
Feedback Forum

Post a new message
Dataseries X:
464196
460170
467037
460070
447988
442867
436087
431328
484015
509673
512927
502831
470984
471067
476049
474605
470439
461251
454724
455626
516847
525192
522975
518585
509239
512238
519164
517009
509933
509127
500857
506971
569323
579714
577992
565464
547344
554788
562325
560854
555332
543599
536662
542722
593530
610763
612613
611324
594167
595454
590865
589379
584428
573100
567456
569028
620735
628884
628232
612117
595404
597141
593408
590072
579799
574205
572775
572942
619567
625809
619916
587625
565742
557274
560576
548854
531673
525919
511038
498662
555362
564591
541657
527070
509846
514258
516922
507561
492622
490243
469357
477580
528379
533590
517945
506174
501866


Summary of computational transaction
Raw Inputview raw input (R code)
Raw Outputview raw output of R engine
Computing time3 seconds
R Server'Gwilym Jenkins' @ 72.249.127.135

\begin{tabular}{lllllllll}
\hline
Summary of computational transaction \tabularnewline
Raw Input & view raw input (R code)  \tabularnewline
Raw Output & view raw output of R engine  \tabularnewline
Computing time & 3 seconds \tabularnewline
R Server & 'Gwilym Jenkins' @ 72.249.127.135 \tabularnewline
\hline
\end{tabular}
%Source: https://freestatistics.org/blog/index.php?pk=35141&T=0

[TABLE]
[ROW][C]Summary of computational transaction[/C][/ROW]
[ROW][C]Raw Input[/C][C]view raw input (R code) [/C][/ROW]
[ROW][C]Raw Output[/C][C]view raw output of R engine [/C][/ROW]
[ROW][C]Computing time[/C][C]3 seconds[/C][/ROW]
[ROW][C]R Server[/C][C]'Gwilym Jenkins' @ 72.249.127.135[/C][/ROW]
[/TABLE]
Source: https://freestatistics.org/blog/index.php?pk=35141&T=0

Globally Unique Identifier (entire table): ba.freestatistics.org/blog/index.php?pk=35141&T=0

As an alternative you can also use a QR Code:  

The GUIDs for individual cells are displayed in the table below:

Summary of computational transaction
Raw Inputview raw input (R code)
Raw Outputview raw output of R engine
Computing time3 seconds
R Server'Gwilym Jenkins' @ 72.249.127.135


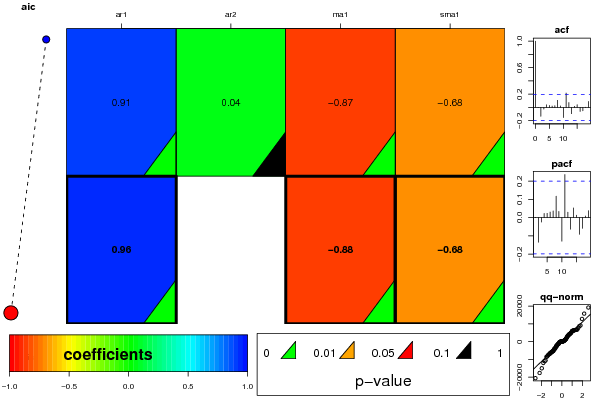
ARIMA Parameter Estimation and Backward Selection
Iterationar1ar2ma1sma1
Estimates ( 1 )0.91070.0433-0.8682-0.6824
(p-val)(0 )(0.7135 )(0 )(0 )
Estimates ( 2 )0.95670-0.8769-0.6837
(p-val)(0 )(NA )(0 )(0 )
Estimates ( 3 )NANANANA
(p-val)(NA )(NA )(NA )(NA )
Estimates ( 4 )NANANANA
(p-val)(NA )(NA )(NA )(NA )
Estimates ( 5 )NANANANA
(p-val)(NA )(NA )(NA )(NA )
Estimates ( 6 )NANANANA
(p-val)(NA )(NA )(NA )(NA )
Estimates ( 7 )NANANANA
(p-val)(NA )(NA )(NA )(NA )

\begin{tabular}{lllllllll}
\hline
ARIMA Parameter Estimation and Backward Selection \tabularnewline
Iteration & ar1 & ar2 & ma1 & sma1 \tabularnewline
Estimates ( 1 ) & 0.9107 & 0.0433 & -0.8682 & -0.6824 \tabularnewline
(p-val) & (0 ) & (0.7135 ) & (0 ) & (0 ) \tabularnewline
Estimates ( 2 ) & 0.9567 & 0 & -0.8769 & -0.6837 \tabularnewline
(p-val) & (0 ) & (NA ) & (0 ) & (0 ) \tabularnewline
Estimates ( 3 ) & NA & NA & NA & NA \tabularnewline
(p-val) & (NA ) & (NA ) & (NA ) & (NA ) \tabularnewline
Estimates ( 4 ) & NA & NA & NA & NA \tabularnewline
(p-val) & (NA ) & (NA ) & (NA ) & (NA ) \tabularnewline
Estimates ( 5 ) & NA & NA & NA & NA \tabularnewline
(p-val) & (NA ) & (NA ) & (NA ) & (NA ) \tabularnewline
Estimates ( 6 ) & NA & NA & NA & NA \tabularnewline
(p-val) & (NA ) & (NA ) & (NA ) & (NA ) \tabularnewline
Estimates ( 7 ) & NA & NA & NA & NA \tabularnewline
(p-val) & (NA ) & (NA ) & (NA ) & (NA ) \tabularnewline
\hline
\end{tabular}
%Source: https://freestatistics.org/blog/index.php?pk=35141&T=1

[TABLE]
[ROW][C]ARIMA Parameter Estimation and Backward Selection[/C][/ROW]
[ROW][C]Iteration[/C][C]ar1[/C][C]ar2[/C][C]ma1[/C][C]sma1[/C][/ROW]
[ROW][C]Estimates ( 1 )[/C][C]0.9107[/C][C]0.0433[/C][C]-0.8682[/C][C]-0.6824[/C][/ROW]
[ROW][C](p-val)[/C][C](0 )[/C][C](0.7135 )[/C][C](0 )[/C][C](0 )[/C][/ROW]
[ROW][C]Estimates ( 2 )[/C][C]0.9567[/C][C]0[/C][C]-0.8769[/C][C]-0.6837[/C][/ROW]
[ROW][C](p-val)[/C][C](0 )[/C][C](NA )[/C][C](0 )[/C][C](0 )[/C][/ROW]
[ROW][C]Estimates ( 3 )[/C][C]NA[/C][C]NA[/C][C]NA[/C][C]NA[/C][/ROW]
[ROW][C](p-val)[/C][C](NA )[/C][C](NA )[/C][C](NA )[/C][C](NA )[/C][/ROW]
[ROW][C]Estimates ( 4 )[/C][C]NA[/C][C]NA[/C][C]NA[/C][C]NA[/C][/ROW]
[ROW][C](p-val)[/C][C](NA )[/C][C](NA )[/C][C](NA )[/C][C](NA )[/C][/ROW]
[ROW][C]Estimates ( 5 )[/C][C]NA[/C][C]NA[/C][C]NA[/C][C]NA[/C][/ROW]
[ROW][C](p-val)[/C][C](NA )[/C][C](NA )[/C][C](NA )[/C][C](NA )[/C][/ROW]
[ROW][C]Estimates ( 6 )[/C][C]NA[/C][C]NA[/C][C]NA[/C][C]NA[/C][/ROW]
[ROW][C](p-val)[/C][C](NA )[/C][C](NA )[/C][C](NA )[/C][C](NA )[/C][/ROW]
[ROW][C]Estimates ( 7 )[/C][C]NA[/C][C]NA[/C][C]NA[/C][C]NA[/C][/ROW]
[ROW][C](p-val)[/C][C](NA )[/C][C](NA )[/C][C](NA )[/C][C](NA )[/C][/ROW]
[/TABLE]
Source: https://freestatistics.org/blog/index.php?pk=35141&T=1

Globally Unique Identifier (entire table): ba.freestatistics.org/blog/index.php?pk=35141&T=1

As an alternative you can also use a QR Code:  

The GUIDs for individual cells are displayed in the table below:

ARIMA Parameter Estimation and Backward Selection
Iterationar1ar2ma1sma1
Estimates ( 1 )0.91070.0433-0.8682-0.6824
(p-val)(0 )(0.7135 )(0 )(0 )
Estimates ( 2 )0.95670-0.8769-0.6837
(p-val)(0 )(NA )(0 )(0 )
Estimates ( 3 )NANANANA
(p-val)(NA )(NA )(NA )(NA )
Estimates ( 4 )NANANANA
(p-val)(NA )(NA )(NA )(NA )
Estimates ( 5 )NANANANA
(p-val)(NA )(NA )(NA )(NA )
Estimates ( 6 )NANANANA
(p-val)(NA )(NA )(NA )(NA )
Estimates ( 7 )NANANANA
(p-val)(NA )(NA )(NA )(NA )


Estimated ARIMA Residuals
Value
-1628.95439575428
3418.33360145578
-1661.50356274953
4428.36900482565
6423.42075891587
-3869.74968551286
-378.183553195013
4391.04112811208
6778.39869531594
-15070.6638656028
-5073.2346120412
5075.83305336389
19164.2022670969
3946.86968528879
-368.868670388098
355.181842721402
-550.93769259169
4906.69730848402
-2744.22921881912
6131.68411269436
3589.62031370761
-7102.67725554041
-3159.12915868626
-5850.07639978167
1240.44603456917
6691.04645035141
498.67167131246
795.141793304495
1047.43868240196
-7793.55016478876
-223.187791562385
4298.85915355986
-8600.93137945986
3062.67576189116
2459.65189538417
7732.83981710711
1493.58408611788
-2418.29889106754
-12055.4686194804
909.21391335919
2113.04135997616
-3970.48303502731
1725.60523193067
-1180.49425823857
-4230.23278411276
-6373.32512099618
-24.8958387505767
-8386.77798238736
3147.72907750448
991.063062021533
-5379.79617749193
311.9357847265
-2500.56218056879
4538.05599191733
6633.09734281912
-1493.55374368629
-7406.92602943756
-5474.95420691387
-4332.73787251041
-20624.6400208538
-1203.70039977467
-7000.03590416535
6206.43730905874
-5554.11416343216
-6276.64923102331
5562.22263153157
-6325.7272227109
-10691.9800106790
8600.98715715497
2486.00209214289
-17702.3763731903
6227.90940217291
6016.2638424401
9048.27363636852
3652.19525157508
-1884.62015385220
-2504.75152143556
6539.48384005982
-11068.0033172740
12747.8309858569
-1145.13162806132
-3916.96895729349
-5708.43918263905
6081.33339310801
15717.7986483070

\begin{tabular}{lllllllll}
\hline
Estimated ARIMA Residuals \tabularnewline
Value \tabularnewline
-1628.95439575428 \tabularnewline
3418.33360145578 \tabularnewline
-1661.50356274953 \tabularnewline
4428.36900482565 \tabularnewline
6423.42075891587 \tabularnewline
-3869.74968551286 \tabularnewline
-378.183553195013 \tabularnewline
4391.04112811208 \tabularnewline
6778.39869531594 \tabularnewline
-15070.6638656028 \tabularnewline
-5073.2346120412 \tabularnewline
5075.83305336389 \tabularnewline
19164.2022670969 \tabularnewline
3946.86968528879 \tabularnewline
-368.868670388098 \tabularnewline
355.181842721402 \tabularnewline
-550.93769259169 \tabularnewline
4906.69730848402 \tabularnewline
-2744.22921881912 \tabularnewline
6131.68411269436 \tabularnewline
3589.62031370761 \tabularnewline
-7102.67725554041 \tabularnewline
-3159.12915868626 \tabularnewline
-5850.07639978167 \tabularnewline
1240.44603456917 \tabularnewline
6691.04645035141 \tabularnewline
498.67167131246 \tabularnewline
795.141793304495 \tabularnewline
1047.43868240196 \tabularnewline
-7793.55016478876 \tabularnewline
-223.187791562385 \tabularnewline
4298.85915355986 \tabularnewline
-8600.93137945986 \tabularnewline
3062.67576189116 \tabularnewline
2459.65189538417 \tabularnewline
7732.83981710711 \tabularnewline
1493.58408611788 \tabularnewline
-2418.29889106754 \tabularnewline
-12055.4686194804 \tabularnewline
909.21391335919 \tabularnewline
2113.04135997616 \tabularnewline
-3970.48303502731 \tabularnewline
1725.60523193067 \tabularnewline
-1180.49425823857 \tabularnewline
-4230.23278411276 \tabularnewline
-6373.32512099618 \tabularnewline
-24.8958387505767 \tabularnewline
-8386.77798238736 \tabularnewline
3147.72907750448 \tabularnewline
991.063062021533 \tabularnewline
-5379.79617749193 \tabularnewline
311.9357847265 \tabularnewline
-2500.56218056879 \tabularnewline
4538.05599191733 \tabularnewline
6633.09734281912 \tabularnewline
-1493.55374368629 \tabularnewline
-7406.92602943756 \tabularnewline
-5474.95420691387 \tabularnewline
-4332.73787251041 \tabularnewline
-20624.6400208538 \tabularnewline
-1203.70039977467 \tabularnewline
-7000.03590416535 \tabularnewline
6206.43730905874 \tabularnewline
-5554.11416343216 \tabularnewline
-6276.64923102331 \tabularnewline
5562.22263153157 \tabularnewline
-6325.7272227109 \tabularnewline
-10691.9800106790 \tabularnewline
8600.98715715497 \tabularnewline
2486.00209214289 \tabularnewline
-17702.3763731903 \tabularnewline
6227.90940217291 \tabularnewline
6016.2638424401 \tabularnewline
9048.27363636852 \tabularnewline
3652.19525157508 \tabularnewline
-1884.62015385220 \tabularnewline
-2504.75152143556 \tabularnewline
6539.48384005982 \tabularnewline
-11068.0033172740 \tabularnewline
12747.8309858569 \tabularnewline
-1145.13162806132 \tabularnewline
-3916.96895729349 \tabularnewline
-5708.43918263905 \tabularnewline
6081.33339310801 \tabularnewline
15717.7986483070 \tabularnewline
\hline
\end{tabular}
%Source: https://freestatistics.org/blog/index.php?pk=35141&T=2

[TABLE]
[ROW][C]Estimated ARIMA Residuals[/C][/ROW]
[ROW][C]Value[/C][/ROW]
[ROW][C]-1628.95439575428[/C][/ROW]
[ROW][C]3418.33360145578[/C][/ROW]
[ROW][C]-1661.50356274953[/C][/ROW]
[ROW][C]4428.36900482565[/C][/ROW]
[ROW][C]6423.42075891587[/C][/ROW]
[ROW][C]-3869.74968551286[/C][/ROW]
[ROW][C]-378.183553195013[/C][/ROW]
[ROW][C]4391.04112811208[/C][/ROW]
[ROW][C]6778.39869531594[/C][/ROW]
[ROW][C]-15070.6638656028[/C][/ROW]
[ROW][C]-5073.2346120412[/C][/ROW]
[ROW][C]5075.83305336389[/C][/ROW]
[ROW][C]19164.2022670969[/C][/ROW]
[ROW][C]3946.86968528879[/C][/ROW]
[ROW][C]-368.868670388098[/C][/ROW]
[ROW][C]355.181842721402[/C][/ROW]
[ROW][C]-550.93769259169[/C][/ROW]
[ROW][C]4906.69730848402[/C][/ROW]
[ROW][C]-2744.22921881912[/C][/ROW]
[ROW][C]6131.68411269436[/C][/ROW]
[ROW][C]3589.62031370761[/C][/ROW]
[ROW][C]-7102.67725554041[/C][/ROW]
[ROW][C]-3159.12915868626[/C][/ROW]
[ROW][C]-5850.07639978167[/C][/ROW]
[ROW][C]1240.44603456917[/C][/ROW]
[ROW][C]6691.04645035141[/C][/ROW]
[ROW][C]498.67167131246[/C][/ROW]
[ROW][C]795.141793304495[/C][/ROW]
[ROW][C]1047.43868240196[/C][/ROW]
[ROW][C]-7793.55016478876[/C][/ROW]
[ROW][C]-223.187791562385[/C][/ROW]
[ROW][C]4298.85915355986[/C][/ROW]
[ROW][C]-8600.93137945986[/C][/ROW]
[ROW][C]3062.67576189116[/C][/ROW]
[ROW][C]2459.65189538417[/C][/ROW]
[ROW][C]7732.83981710711[/C][/ROW]
[ROW][C]1493.58408611788[/C][/ROW]
[ROW][C]-2418.29889106754[/C][/ROW]
[ROW][C]-12055.4686194804[/C][/ROW]
[ROW][C]909.21391335919[/C][/ROW]
[ROW][C]2113.04135997616[/C][/ROW]
[ROW][C]-3970.48303502731[/C][/ROW]
[ROW][C]1725.60523193067[/C][/ROW]
[ROW][C]-1180.49425823857[/C][/ROW]
[ROW][C]-4230.23278411276[/C][/ROW]
[ROW][C]-6373.32512099618[/C][/ROW]
[ROW][C]-24.8958387505767[/C][/ROW]
[ROW][C]-8386.77798238736[/C][/ROW]
[ROW][C]3147.72907750448[/C][/ROW]
[ROW][C]991.063062021533[/C][/ROW]
[ROW][C]-5379.79617749193[/C][/ROW]
[ROW][C]311.9357847265[/C][/ROW]
[ROW][C]-2500.56218056879[/C][/ROW]
[ROW][C]4538.05599191733[/C][/ROW]
[ROW][C]6633.09734281912[/C][/ROW]
[ROW][C]-1493.55374368629[/C][/ROW]
[ROW][C]-7406.92602943756[/C][/ROW]
[ROW][C]-5474.95420691387[/C][/ROW]
[ROW][C]-4332.73787251041[/C][/ROW]
[ROW][C]-20624.6400208538[/C][/ROW]
[ROW][C]-1203.70039977467[/C][/ROW]
[ROW][C]-7000.03590416535[/C][/ROW]
[ROW][C]6206.43730905874[/C][/ROW]
[ROW][C]-5554.11416343216[/C][/ROW]
[ROW][C]-6276.64923102331[/C][/ROW]
[ROW][C]5562.22263153157[/C][/ROW]
[ROW][C]-6325.7272227109[/C][/ROW]
[ROW][C]-10691.9800106790[/C][/ROW]
[ROW][C]8600.98715715497[/C][/ROW]
[ROW][C]2486.00209214289[/C][/ROW]
[ROW][C]-17702.3763731903[/C][/ROW]
[ROW][C]6227.90940217291[/C][/ROW]
[ROW][C]6016.2638424401[/C][/ROW]
[ROW][C]9048.27363636852[/C][/ROW]
[ROW][C]3652.19525157508[/C][/ROW]
[ROW][C]-1884.62015385220[/C][/ROW]
[ROW][C]-2504.75152143556[/C][/ROW]
[ROW][C]6539.48384005982[/C][/ROW]
[ROW][C]-11068.0033172740[/C][/ROW]
[ROW][C]12747.8309858569[/C][/ROW]
[ROW][C]-1145.13162806132[/C][/ROW]
[ROW][C]-3916.96895729349[/C][/ROW]
[ROW][C]-5708.43918263905[/C][/ROW]
[ROW][C]6081.33339310801[/C][/ROW]
[ROW][C]15717.7986483070[/C][/ROW]
[/TABLE]
Source: https://freestatistics.org/blog/index.php?pk=35141&T=2

Globally Unique Identifier (entire table): ba.freestatistics.org/blog/index.php?pk=35141&T=2

As an alternative you can also use a QR Code:  

The GUIDs for individual cells are displayed in the table below:

Estimated ARIMA Residuals
Value
-1628.95439575428
3418.33360145578
-1661.50356274953
4428.36900482565
6423.42075891587
-3869.74968551286
-378.183553195013
4391.04112811208
6778.39869531594
-15070.6638656028
-5073.2346120412
5075.83305336389
19164.2022670969
3946.86968528879
-368.868670388098
355.181842721402
-550.93769259169
4906.69730848402
-2744.22921881912
6131.68411269436
3589.62031370761
-7102.67725554041
-3159.12915868626
-5850.07639978167
1240.44603456917
6691.04645035141
498.67167131246
795.141793304495
1047.43868240196
-7793.55016478876
-223.187791562385
4298.85915355986
-8600.93137945986
3062.67576189116
2459.65189538417
7732.83981710711
1493.58408611788
-2418.29889106754
-12055.4686194804
909.21391335919
2113.04135997616
-3970.48303502731
1725.60523193067
-1180.49425823857
-4230.23278411276
-6373.32512099618
-24.8958387505767
-8386.77798238736
3147.72907750448
991.063062021533
-5379.79617749193
311.9357847265
-2500.56218056879
4538.05599191733
6633.09734281912
-1493.55374368629
-7406.92602943756
-5474.95420691387
-4332.73787251041
-20624.6400208538
-1203.70039977467
-7000.03590416535
6206.43730905874
-5554.11416343216
-6276.64923102331
5562.22263153157
-6325.7272227109
-10691.9800106790
8600.98715715497
2486.00209214289
-17702.3763731903
6227.90940217291
6016.2638424401
9048.27363636852
3652.19525157508
-1884.62015385220
-2504.75152143556
6539.48384005982
-11068.0033172740
12747.8309858569
-1145.13162806132
-3916.96895729349
-5708.43918263905
6081.33339310801
15717.7986483070


Parameters (Session):
par1 = FALSE ; par2 = 1 ; par3 = 1 ; par4 = 1 ; par5 = 12 ; par6 = 3 ; par7 = 1 ; par8 = 2 ; par9 = 1 ;
Parameters (R input):
par1 = FALSE ; par2 = 1 ; par3 = 1 ; par4 = 1 ; par5 = 12 ; par6 = 2 ; par7 = 1 ; par8 = 0 ; par9 = 1 ;
R code (references can be found in the software module):
library(lattice)
if (par1 == 'TRUE') par1 <- TRUE
if (par1 == 'FALSE') par1 <- FALSE
par2 <- as.numeric(par2) #Box-Cox lambda transformation parameter
par3 <- as.numeric(par3) #degree of non-seasonal differencing
par4 <- as.numeric(par4) #degree of seasonal differencing
par5 <- as.numeric(par5) #seasonal period
par6 <- as.numeric(par6) #degree (p) of the non-seasonal AR(p) polynomial
par7 <- as.numeric(par7) #degree (q) of the non-seasonal MA(q) polynomial
par8 <- as.numeric(par8) #degree (P) of the seasonal AR(P) polynomial
par9 <- as.numeric(par9) #degree (Q) of the seasonal MA(Q) polynomial
armaGR <- function(arima.out, names, n){
try1 <- arima.out$coef
try2 <- sqrt(diag(arima.out$var.coef))
try.data.frame <- data.frame(matrix(NA,ncol=4,nrow=length(names)))
dimnames(try.data.frame) <- list(names,c('coef','std','tstat','pv'))
try.data.frame[,1] <- try1
for(i in 1:length(try2)) try.data.frame[which(rownames(try.data.frame)==names(try2)[i]),2] <- try2[i]
try.data.frame[,3] <- try.data.frame[,1] / try.data.frame[,2]
try.data.frame[,4] <- round((1-pt(abs(try.data.frame[,3]),df=n-(length(try2)+1)))*2,5)
vector <- rep(NA,length(names))
vector[is.na(try.data.frame[,4])] <- 0
maxi <- which.max(try.data.frame[,4])
continue <- max(try.data.frame[,4],na.rm=TRUE) > .05
vector[maxi] <- 0
list(summary=try.data.frame,next.vector=vector,continue=continue)
}
arimaSelect <- function(series, order=c(13,0,0), seasonal=list(order=c(2,0,0),period=12), include.mean=F){
nrc <- order[1]+order[3]+seasonal$order[1]+seasonal$order[3]
coeff <- matrix(NA, nrow=nrc*2, ncol=nrc)
pval <- matrix(NA, nrow=nrc*2, ncol=nrc)
mylist <- rep(list(NULL), nrc)
names <- NULL
if(order[1] > 0) names <- paste('ar',1:order[1],sep='')
if(order[3] > 0) names <- c( names , paste('ma',1:order[3],sep='') )
if(seasonal$order[1] > 0) names <- c(names, paste('sar',1:seasonal$order[1],sep=''))
if(seasonal$order[3] > 0) names <- c(names, paste('sma',1:seasonal$order[3],sep=''))
arima.out <- arima(series, order=order, seasonal=seasonal, include.mean=include.mean, method='ML')
mylist[[1]] <- arima.out
last.arma <- armaGR(arima.out, names, length(series))
mystop <- FALSE
i <- 1
coeff[i,] <- last.arma[[1]][,1]
pval [i,] <- last.arma[[1]][,4]
i <- 2
aic <- arima.out$aic
while(!mystop){
mylist[[i]] <- arima.out
arima.out <- arima(series, order=order, seasonal=seasonal, include.mean=include.mean, method='ML', fixed=last.arma$next.vector)
aic <- c(aic, arima.out$aic)
last.arma <- armaGR(arima.out, names, length(series))
mystop <- !last.arma$continue
coeff[i,] <- last.arma[[1]][,1]
pval [i,] <- last.arma[[1]][,4]
i <- i+1
}
list(coeff, pval, mylist, aic=aic)
}
arimaSelectplot <- function(arimaSelect.out,noms,choix){
noms <- names(arimaSelect.out[[3]][[1]]$coef)
coeff <- arimaSelect.out[[1]]
k <- min(which(is.na(coeff[,1])))-1
coeff <- coeff[1:k,]
pval <- arimaSelect.out[[2]][1:k,]
aic <- arimaSelect.out$aic[1:k]
coeff[coeff==0] <- NA
n <- ncol(coeff)
if(missing(choix)) choix <- k
layout(matrix(c(1,1,1,2,
3,3,3,2,
3,3,3,4,
5,6,7,7),nr=4),
widths=c(10,35,45,15),
heights=c(30,30,15,15))
couleurs <- rainbow(75)[1:50]#(50)
ticks <- pretty(coeff)
par(mar=c(1,1,3,1))
plot(aic,k:1-.5,type='o',pch=21,bg='blue',cex=2,axes=F,lty=2,xpd=NA)
points(aic[choix],k-choix+.5,pch=21,cex=4,bg=2,xpd=NA)
title('aic',line=2)
par(mar=c(3,0,0,0))
plot(0,axes=F,xlab='',ylab='',xlim=range(ticks),ylim=c(.1,1))
rect(xleft = min(ticks) + (0:49)/50*(max(ticks)-min(ticks)),
xright = min(ticks) + (1:50)/50*(max(ticks)-min(ticks)),
ytop = rep(1,50),
ybottom= rep(0,50),col=couleurs,border=NA)
axis(1,ticks)
rect(xleft=min(ticks),xright=max(ticks),ytop=1,ybottom=0)
text(mean(coeff,na.rm=T),.5,'coefficients',cex=2,font=2)
par(mar=c(1,1,3,1))
image(1:n,1:k,t(coeff[k:1,]),axes=F,col=couleurs,zlim=range(ticks))
for(i in 1:n) for(j in 1:k) if(!is.na(coeff[j,i])) {
if(pval[j,i]<.01) symb = 'green'
else if( (pval[j,i]<.05) & (pval[j,i]>=.01)) symb = 'orange'
else if( (pval[j,i]<.1) & (pval[j,i]>=.05)) symb = 'red'
else symb = 'black'
polygon(c(i+.5 ,i+.2 ,i+.5 ,i+.5),
c(k-j+0.5,k-j+0.5,k-j+0.8,k-j+0.5),
col=symb)
if(j==choix) {
rect(xleft=i-.5,
xright=i+.5,
ybottom=k-j+1.5,
ytop=k-j+.5,
lwd=4)
text(i,
k-j+1,
round(coeff[j,i],2),
cex=1.2,
font=2)
}
else{
rect(xleft=i-.5,xright=i+.5,ybottom=k-j+1.5,ytop=k-j+.5)
text(i,k-j+1,round(coeff[j,i],2),cex=1.2,font=1)
}
}
axis(3,1:n,noms)
par(mar=c(0.5,0,0,0.5))
plot(0,axes=F,xlab='',ylab='',type='n',xlim=c(0,8),ylim=c(-.2,.8))
cols <- c('green','orange','red','black')
niv <- c('0','0.01','0.05','0.1')
for(i in 0:3){
polygon(c(1+2*i ,1+2*i ,1+2*i-.5 ,1+2*i),
c(.4 ,.7 , .4 , .4),
col=cols[i+1])
text(2*i,0.5,niv[i+1],cex=1.5)
}
text(8,.5,1,cex=1.5)
text(4,0,'p-value',cex=2)
box()
residus <- arimaSelect.out[[3]][[choix]]$res
par(mar=c(1,2,4,1))
acf(residus,main='')
title('acf',line=.5)
par(mar=c(1,2,4,1))
pacf(residus,main='')
title('pacf',line=.5)
par(mar=c(2,2,4,1))
qqnorm(residus,main='')
title('qq-norm',line=.5)
qqline(residus)
residus
}
if (par2 == 0) x <- log(x)
if (par2 != 0) x <- x^par2
(selection <- arimaSelect(x, order=c(par6,par3,par7), seasonal=list(order=c(par8,par4,par9), period=par5)))
bitmap(file='test1.png')
resid <- arimaSelectplot(selection)
dev.off()
resid
bitmap(file='test2.png')
acf(resid,length(resid)/2, main='Residual Autocorrelation Function')
dev.off()
bitmap(file='test3.png')
pacf(resid,length(resid)/2, main='Residual Partial Autocorrelation Function')
dev.off()
bitmap(file='test4.png')
cpgram(resid, main='Residual Cumulative Periodogram')
dev.off()
bitmap(file='test5.png')
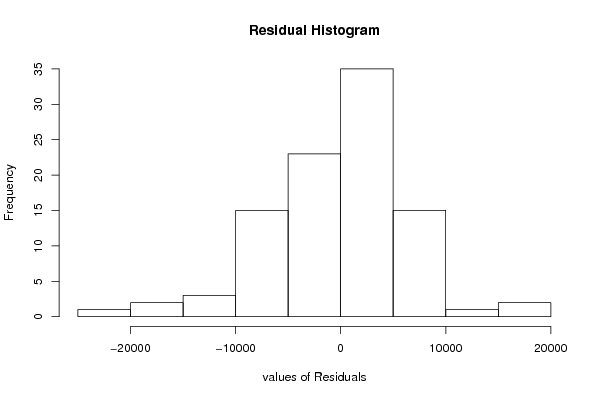
hist(resid, main='Residual Histogram', xlab='values of Residuals')
dev.off()
bitmap(file='test6.png')
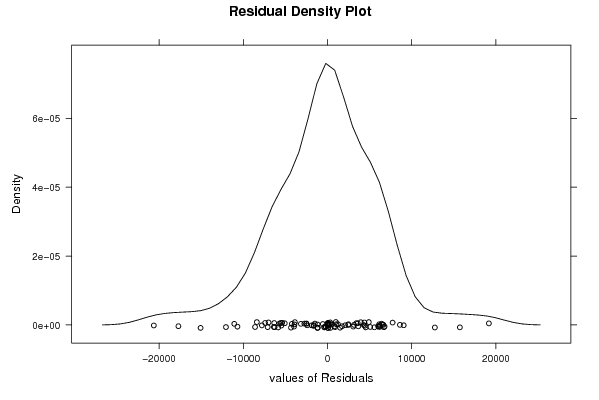
densityplot(~resid,col='black',main='Residual Density Plot', xlab='values of Residuals')
dev.off()
bitmap(file='test7.png')
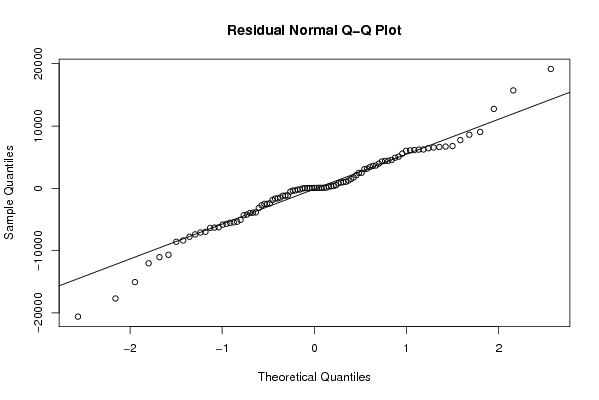
qqnorm(resid, main='Residual Normal Q-Q Plot')
qqline(resid)
dev.off()
ncols <- length(selection[[1]][1,])
nrows <- length(selection[[2]][,1])-1
load(file='createtable')
a<-table.start()
a<-table.row.start(a)
a<-table.element(a,'ARIMA Parameter Estimation and Backward Selection', ncols+1,TRUE)
a<-table.row.end(a)
a<-table.row.start(a)
a<-table.element(a,'Iteration', header=TRUE)
for (i in 1:ncols) {
a<-table.element(a,names(selection[[3]][[1]]$coef)[i],header=TRUE)
}
a<-table.row.end(a)
for (j in 1:nrows) {
a<-table.row.start(a)
mydum <- 'Estimates ('
mydum <- paste(mydum,j)
mydum <- paste(mydum,')')
a<-table.element(a,mydum, header=TRUE)
for (i in 1:ncols) {
a<-table.element(a,round(selection[[1]][j,i],4))
}
a<-table.row.end(a)
a<-table.row.start(a)
a<-table.element(a,'(p-val)', header=TRUE)
for (i in 1:ncols) {
mydum <- '('
mydum <- paste(mydum,round(selection[[2]][j,i],4),sep='')
mydum <- paste(mydum,')')
a<-table.element(a,mydum)
}
a<-table.row.end(a)
}
a<-table.end(a)
table.save(a,file='mytable.tab')
a<-table.start()
a<-table.row.start(a)
a<-table.element(a,'Estimated ARIMA Residuals', 1,TRUE)
a<-table.row.end(a)
a<-table.row.start(a)
a<-table.element(a,'Value', 1,TRUE)
a<-table.row.end(a)
for (i in (par4*par5+par3):length(resid)) {
a<-table.row.start(a)
a<-table.element(a,resid[i])
a<-table.row.end(a)
}
a<-table.end(a)
table.save(a,file='mytable1.tab')