Free Statistics
of Irreproducible Research!
Description of Statistical Computation | |||||||||||||||||||||
|---|---|---|---|---|---|---|---|---|---|---|---|---|---|---|---|---|---|---|---|---|---|
| Author's title | |||||||||||||||||||||
| Author | *The author of this computation has been verified* | ||||||||||||||||||||
| R Software Module | rwasp_backtobackhist.wasp | ||||||||||||||||||||
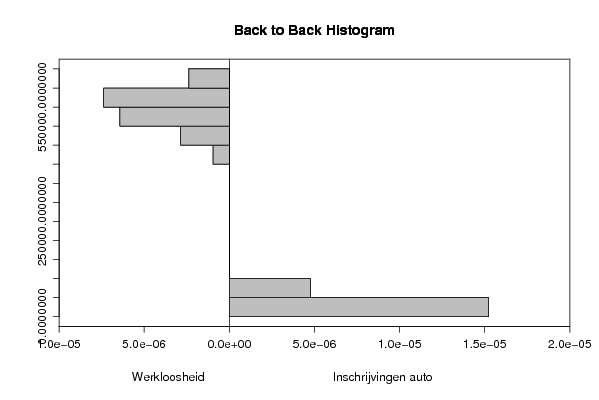
| Title produced by software | Back to Back Histogram | ||||||||||||||||||||
| Date of computation | Fri, 19 Dec 2008 06:48:49 -0700 | ||||||||||||||||||||
| Cite this page as follows | Statistical Computations at FreeStatistics.org, Office for Research Development and Education, URL https://freestatistics.org/blog/index.php?v=date/2008/Dec/19/t1229694577zq32o75hpra7z3n.htm/, Retrieved Wed, 15 May 2024 01:15:48 +0000 | ||||||||||||||||||||
| Statistical Computations at FreeStatistics.org, Office for Research Development and Education, URL https://freestatistics.org/blog/index.php?pk=35126, Retrieved Wed, 15 May 2024 01:15:48 +0000 | |||||||||||||||||||||
| QR Codes: | |||||||||||||||||||||
|
| |||||||||||||||||||||
| Original text written by user: | |||||||||||||||||||||
| IsPrivate? | No (this computation is public) | ||||||||||||||||||||
| User-defined keywords | |||||||||||||||||||||
| Estimated Impact | 156 | ||||||||||||||||||||
Tree of Dependent Computations | |||||||||||||||||||||
| Family? (F = Feedback message, R = changed R code, M = changed R Module, P = changed Parameters, D = changed Data) | |||||||||||||||||||||
| - [Back to Back Histogram] [Back to back hist...] [2008-12-19 13:48:49] [9ba97de59bb4d2edf0cfeac4ca7d2b73] [Current] | |||||||||||||||||||||
| Feedback Forum | |||||||||||||||||||||
Post a new message | |||||||||||||||||||||
Dataset | |||||||||||||||||||||
| Dataseries X: | |||||||||||||||||||||
467037 460070 447988 442867 436087 431328 484015 509673 512927 502831 470984 471067 476049 474605 470439 461251 454724 455626 516847 525192 522975 518585 509239 512238 519164 517009 509933 509127 500857 506971 569323 579714 577992 565464 547344 554788 562325 560854 555332 543599 536662 542722 593530 610763 612613 611324 594167 595454 590865 589379 584428 573100 567456 569028 620735 628884 628232 612117 595404 597141 593408 590072 579799 574205 572775 572942 619567 625809 619916 587625 565742 557274 560576 548854 531673 525919 511038 498662 555362 564591 541657 527070 509846 514258 | |||||||||||||||||||||
| Dataseries Y: | |||||||||||||||||||||
58608 46865 51378 46235 47206 45382 41227 33795 31295 42625 33625 21538 56421 53152 53536 52408 41454 38271 35306 26414 31917 38030 27534 18387 50556 43901 48572 43899 37532 40357 35489 29027 34485 42598 30306 26451 47460 50104 61465 53726 39477 43895 31481 29896 33842 39120 33702 25094 51442 45594 52518 48564 41745 49585 32747 33379 35645 37034 35681 20972 58552 54955 65540 51570 51145 46641 35704 33253 35193 41668 34865 21210 56126 49231 59723 48103 47472 50497 40059 34149 36860 46356 36577 23872 | |||||||||||||||||||||
Tables (Output of Computation) | |||||||||||||||||||||
| |||||||||||||||||||||
Figures (Output of Computation) | |||||||||||||||||||||
Input Parameters & R Code | |||||||||||||||||||||
| Parameters (Session): | |||||||||||||||||||||
| par1 = grey ; par2 = grey ; par3 = TRUE ; par4 = Werkloosheid ; par5 = Inschrijvingen auto ; | |||||||||||||||||||||
| Parameters (R input): | |||||||||||||||||||||
| par1 = grey ; par2 = grey ; par3 = TRUE ; par4 = Werkloosheid ; par5 = Inschrijvingen auto ; | |||||||||||||||||||||
| R code (references can be found in the software module): | |||||||||||||||||||||
if (par3 == 'TRUE') par3 <- TRUE | |||||||||||||||||||||