Free Statistics

of Irreproducible Research!

Author's title

Author*The author of this computation has been verified*
R Software Modulerwasp_autocorrelation.wasp
Title produced by software(Partial) Autocorrelation Function
Date of computationFri, 19 Dec 2008 06:32:32 -0700
Cite this page as followsStatistical Computations at FreeStatistics.org, Office for Research Development and Education, URL https://freestatistics.org/blog/index.php?v=date/2008/Dec/19/t12296936653yl5j5frz5t017u.htm/, Retrieved Wed, 15 May 2024 05:05:02 +0000
Statistical Computations at FreeStatistics.org, Office for Research Development and Education, URL https://freestatistics.org/blog/index.php?pk=35123, Retrieved Wed, 15 May 2024 05:05:02 +0000
QR Codes:

Original text written by user:
IsPrivate?No (this computation is public)
User-defined keywords
Estimated Impact196
Family? (F = Feedback message, R = changed R code, M = changed R Module, P = changed Parameters, D = changed Data)
-     [Mean Plot] [Gilliam Schoorel] [2008-11-06 14:07:56] [666bda00bbd072dde5655a1423b1377b]
- RMPD  [Spectral Analysis] [Spectrum suiker m...] [2008-12-09 16:30:42] [f77c9ab3b413812d7baee6b7ec69a15d]
- RMPD      [(Partial) Autocorrelation Function] [AC Chocopasta] [2008-12-19 13:32:32] [d300b7a0882cee7d84584ad37a3d4ede] [Current]
Feedback Forum

Post a new message
Dataseries X:
101.73
101.63
101.43
101.34
101.01
100.89
100.93
100.77
100.3
99.86
99.71
99.93
99.88
99.92
99.87
99.63
100.05
99.88
100.11
100.05
100.07
100.2
100.21
99.76
99.41
99.24
99.65
99.7
99.79
99.84
101
101.62
101.98
101.46
102.28
102.14
102.02
102.21
101.61
102.38
102.19
102.04
101.76
101.9
102.01
102.37
103.04
103.42
103.76
104.41
104.75
104.28
103.89
104.09
103.8
105.03
105.86
106.04
106.03
106.13
107.21
107.66
108.08
108.76
108.26
108.71
108.65
108.61
108.86
109.54
108.22
108.77
109.9
110.13
109.6
110.42
110.6
109.73
110.72
111.08
111.14
111.01
110.56
111.57


Summary of computational transaction
Raw Inputview raw input (R code)
Raw Outputview raw output of R engine
Computing time2 seconds
R Server'Sir Ronald Aylmer Fisher' @ 193.190.124.24

\begin{tabular}{lllllllll}
\hline
Summary of computational transaction \tabularnewline
Raw Input & view raw input (R code)  \tabularnewline
Raw Output & view raw output of R engine  \tabularnewline
Computing time & 2 seconds \tabularnewline
R Server & 'Sir Ronald Aylmer Fisher' @ 193.190.124.24 \tabularnewline
\hline
\end{tabular}
%Source: https://freestatistics.org/blog/index.php?pk=35123&T=0

[TABLE]
[ROW][C]Summary of computational transaction[/C][/ROW]
[ROW][C]Raw Input[/C][C]view raw input (R code) [/C][/ROW]
[ROW][C]Raw Output[/C][C]view raw output of R engine [/C][/ROW]
[ROW][C]Computing time[/C][C]2 seconds[/C][/ROW]
[ROW][C]R Server[/C][C]'Sir Ronald Aylmer Fisher' @ 193.190.124.24[/C][/ROW]
[/TABLE]
Source: https://freestatistics.org/blog/index.php?pk=35123&T=0

Globally Unique Identifier (entire table): ba.freestatistics.org/blog/index.php?pk=35123&T=0

As an alternative you can also use a QR Code:  

The GUIDs for individual cells are displayed in the table below:

Summary of computational transaction
Raw Inputview raw input (R code)
Raw Outputview raw output of R engine
Computing time2 seconds
R Server'Sir Ronald Aylmer Fisher' @ 193.190.124.24


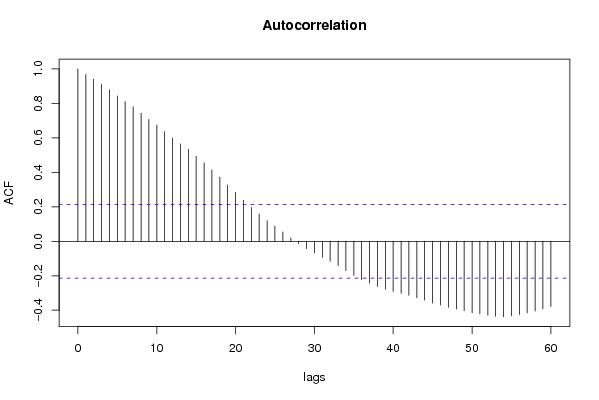
Autocorrelation Function
Time lag kACF(k)T-STATP-value
10.9676338.86850
20.9409348.62380
30.9115738.35470
40.8786638.05310
50.8435897.73160
60.809667.42070
70.7804077.15250
80.7433816.81320
90.707176.48130
100.6743916.18090
110.6363825.83250
120.5987395.48750
130.5652215.18031e-06
140.5334764.88942e-06
150.4927444.51611e-05
160.4541714.16253.8e-05
170.4133173.78810.000142
180.3713673.40360.000511
190.3271442.99830.001785
200.2838622.60160.005482
210.2374482.17630.016172
220.1960111.79650.038007
230.1584591.45230.075072
240.1197361.09740.137802
250.0870480.79780.213615
260.0540090.4950.310946
270.0196040.17970.428921
28-0.013057-0.11970.452514
29-0.042602-0.39050.348595
30-0.066946-0.61360.27058
31-0.092593-0.84860.199251
32-0.115443-1.05810.146532
33-0.140674-1.28930.100417
34-0.170465-1.56230.060984
35-0.197552-1.81060.03689
36-0.221659-2.03150.022681
37-0.242861-2.22590.014351
38-0.262158-2.40270.009238
39-0.277794-2.5460.006361
40-0.290849-2.66570.004607
41-0.301734-2.76540.003494
42-0.31317-2.87030.002594
43-0.327304-2.99980.001777
44-0.341257-3.12770.001211
45-0.357803-3.27930.000758
46-0.368912-3.38110.000549
47-0.382189-3.50280.00037
48-0.393239-3.60410.000265
49-0.403633-3.69940.000192
50-0.414922-3.80280.000135
51-0.420235-3.85150.000114
52-0.428573-3.92798.8e-05
53-0.43466-3.98377.2e-05
54-0.437228-4.00736.6e-05
55-0.432531-3.96427.7e-05
56-0.424949-3.89479.8e-05
57-0.414893-3.80260.000135
58-0.404444-3.70680.000188
59-0.391112-3.58460.000283
60-0.377993-3.46440.00042

\begin{tabular}{lllllllll}
\hline
Autocorrelation Function \tabularnewline
Time lag k & ACF(k) & T-STAT & P-value \tabularnewline
1 & 0.967633 & 8.8685 & 0 \tabularnewline
2 & 0.940934 & 8.6238 & 0 \tabularnewline
3 & 0.911573 & 8.3547 & 0 \tabularnewline
4 & 0.878663 & 8.0531 & 0 \tabularnewline
5 & 0.843589 & 7.7316 & 0 \tabularnewline
6 & 0.80966 & 7.4207 & 0 \tabularnewline
7 & 0.780407 & 7.1525 & 0 \tabularnewline
8 & 0.743381 & 6.8132 & 0 \tabularnewline
9 & 0.70717 & 6.4813 & 0 \tabularnewline
10 & 0.674391 & 6.1809 & 0 \tabularnewline
11 & 0.636382 & 5.8325 & 0 \tabularnewline
12 & 0.598739 & 5.4875 & 0 \tabularnewline
13 & 0.565221 & 5.1803 & 1e-06 \tabularnewline
14 & 0.533476 & 4.8894 & 2e-06 \tabularnewline
15 & 0.492744 & 4.5161 & 1e-05 \tabularnewline
16 & 0.454171 & 4.1625 & 3.8e-05 \tabularnewline
17 & 0.413317 & 3.7881 & 0.000142 \tabularnewline
18 & 0.371367 & 3.4036 & 0.000511 \tabularnewline
19 & 0.327144 & 2.9983 & 0.001785 \tabularnewline
20 & 0.283862 & 2.6016 & 0.005482 \tabularnewline
21 & 0.237448 & 2.1763 & 0.016172 \tabularnewline
22 & 0.196011 & 1.7965 & 0.038007 \tabularnewline
23 & 0.158459 & 1.4523 & 0.075072 \tabularnewline
24 & 0.119736 & 1.0974 & 0.137802 \tabularnewline
25 & 0.087048 & 0.7978 & 0.213615 \tabularnewline
26 & 0.054009 & 0.495 & 0.310946 \tabularnewline
27 & 0.019604 & 0.1797 & 0.428921 \tabularnewline
28 & -0.013057 & -0.1197 & 0.452514 \tabularnewline
29 & -0.042602 & -0.3905 & 0.348595 \tabularnewline
30 & -0.066946 & -0.6136 & 0.27058 \tabularnewline
31 & -0.092593 & -0.8486 & 0.199251 \tabularnewline
32 & -0.115443 & -1.0581 & 0.146532 \tabularnewline
33 & -0.140674 & -1.2893 & 0.100417 \tabularnewline
34 & -0.170465 & -1.5623 & 0.060984 \tabularnewline
35 & -0.197552 & -1.8106 & 0.03689 \tabularnewline
36 & -0.221659 & -2.0315 & 0.022681 \tabularnewline
37 & -0.242861 & -2.2259 & 0.014351 \tabularnewline
38 & -0.262158 & -2.4027 & 0.009238 \tabularnewline
39 & -0.277794 & -2.546 & 0.006361 \tabularnewline
40 & -0.290849 & -2.6657 & 0.004607 \tabularnewline
41 & -0.301734 & -2.7654 & 0.003494 \tabularnewline
42 & -0.31317 & -2.8703 & 0.002594 \tabularnewline
43 & -0.327304 & -2.9998 & 0.001777 \tabularnewline
44 & -0.341257 & -3.1277 & 0.001211 \tabularnewline
45 & -0.357803 & -3.2793 & 0.000758 \tabularnewline
46 & -0.368912 & -3.3811 & 0.000549 \tabularnewline
47 & -0.382189 & -3.5028 & 0.00037 \tabularnewline
48 & -0.393239 & -3.6041 & 0.000265 \tabularnewline
49 & -0.403633 & -3.6994 & 0.000192 \tabularnewline
50 & -0.414922 & -3.8028 & 0.000135 \tabularnewline
51 & -0.420235 & -3.8515 & 0.000114 \tabularnewline
52 & -0.428573 & -3.9279 & 8.8e-05 \tabularnewline
53 & -0.43466 & -3.9837 & 7.2e-05 \tabularnewline
54 & -0.437228 & -4.0073 & 6.6e-05 \tabularnewline
55 & -0.432531 & -3.9642 & 7.7e-05 \tabularnewline
56 & -0.424949 & -3.8947 & 9.8e-05 \tabularnewline
57 & -0.414893 & -3.8026 & 0.000135 \tabularnewline
58 & -0.404444 & -3.7068 & 0.000188 \tabularnewline
59 & -0.391112 & -3.5846 & 0.000283 \tabularnewline
60 & -0.377993 & -3.4644 & 0.00042 \tabularnewline
\hline
\end{tabular}
%Source: https://freestatistics.org/blog/index.php?pk=35123&T=1

[TABLE]
[ROW][C]Autocorrelation Function[/C][/ROW]
[ROW][C]Time lag k[/C][C]ACF(k)[/C][C]T-STAT[/C][C]P-value[/C][/ROW]
[ROW][C]1[/C][C]0.967633[/C][C]8.8685[/C][C]0[/C][/ROW]
[ROW][C]2[/C][C]0.940934[/C][C]8.6238[/C][C]0[/C][/ROW]
[ROW][C]3[/C][C]0.911573[/C][C]8.3547[/C][C]0[/C][/ROW]
[ROW][C]4[/C][C]0.878663[/C][C]8.0531[/C][C]0[/C][/ROW]
[ROW][C]5[/C][C]0.843589[/C][C]7.7316[/C][C]0[/C][/ROW]
[ROW][C]6[/C][C]0.80966[/C][C]7.4207[/C][C]0[/C][/ROW]
[ROW][C]7[/C][C]0.780407[/C][C]7.1525[/C][C]0[/C][/ROW]
[ROW][C]8[/C][C]0.743381[/C][C]6.8132[/C][C]0[/C][/ROW]
[ROW][C]9[/C][C]0.70717[/C][C]6.4813[/C][C]0[/C][/ROW]
[ROW][C]10[/C][C]0.674391[/C][C]6.1809[/C][C]0[/C][/ROW]
[ROW][C]11[/C][C]0.636382[/C][C]5.8325[/C][C]0[/C][/ROW]
[ROW][C]12[/C][C]0.598739[/C][C]5.4875[/C][C]0[/C][/ROW]
[ROW][C]13[/C][C]0.565221[/C][C]5.1803[/C][C]1e-06[/C][/ROW]
[ROW][C]14[/C][C]0.533476[/C][C]4.8894[/C][C]2e-06[/C][/ROW]
[ROW][C]15[/C][C]0.492744[/C][C]4.5161[/C][C]1e-05[/C][/ROW]
[ROW][C]16[/C][C]0.454171[/C][C]4.1625[/C][C]3.8e-05[/C][/ROW]
[ROW][C]17[/C][C]0.413317[/C][C]3.7881[/C][C]0.000142[/C][/ROW]
[ROW][C]18[/C][C]0.371367[/C][C]3.4036[/C][C]0.000511[/C][/ROW]
[ROW][C]19[/C][C]0.327144[/C][C]2.9983[/C][C]0.001785[/C][/ROW]
[ROW][C]20[/C][C]0.283862[/C][C]2.6016[/C][C]0.005482[/C][/ROW]
[ROW][C]21[/C][C]0.237448[/C][C]2.1763[/C][C]0.016172[/C][/ROW]
[ROW][C]22[/C][C]0.196011[/C][C]1.7965[/C][C]0.038007[/C][/ROW]
[ROW][C]23[/C][C]0.158459[/C][C]1.4523[/C][C]0.075072[/C][/ROW]
[ROW][C]24[/C][C]0.119736[/C][C]1.0974[/C][C]0.137802[/C][/ROW]
[ROW][C]25[/C][C]0.087048[/C][C]0.7978[/C][C]0.213615[/C][/ROW]
[ROW][C]26[/C][C]0.054009[/C][C]0.495[/C][C]0.310946[/C][/ROW]
[ROW][C]27[/C][C]0.019604[/C][C]0.1797[/C][C]0.428921[/C][/ROW]
[ROW][C]28[/C][C]-0.013057[/C][C]-0.1197[/C][C]0.452514[/C][/ROW]
[ROW][C]29[/C][C]-0.042602[/C][C]-0.3905[/C][C]0.348595[/C][/ROW]
[ROW][C]30[/C][C]-0.066946[/C][C]-0.6136[/C][C]0.27058[/C][/ROW]
[ROW][C]31[/C][C]-0.092593[/C][C]-0.8486[/C][C]0.199251[/C][/ROW]
[ROW][C]32[/C][C]-0.115443[/C][C]-1.0581[/C][C]0.146532[/C][/ROW]
[ROW][C]33[/C][C]-0.140674[/C][C]-1.2893[/C][C]0.100417[/C][/ROW]
[ROW][C]34[/C][C]-0.170465[/C][C]-1.5623[/C][C]0.060984[/C][/ROW]
[ROW][C]35[/C][C]-0.197552[/C][C]-1.8106[/C][C]0.03689[/C][/ROW]
[ROW][C]36[/C][C]-0.221659[/C][C]-2.0315[/C][C]0.022681[/C][/ROW]
[ROW][C]37[/C][C]-0.242861[/C][C]-2.2259[/C][C]0.014351[/C][/ROW]
[ROW][C]38[/C][C]-0.262158[/C][C]-2.4027[/C][C]0.009238[/C][/ROW]
[ROW][C]39[/C][C]-0.277794[/C][C]-2.546[/C][C]0.006361[/C][/ROW]
[ROW][C]40[/C][C]-0.290849[/C][C]-2.6657[/C][C]0.004607[/C][/ROW]
[ROW][C]41[/C][C]-0.301734[/C][C]-2.7654[/C][C]0.003494[/C][/ROW]
[ROW][C]42[/C][C]-0.31317[/C][C]-2.8703[/C][C]0.002594[/C][/ROW]
[ROW][C]43[/C][C]-0.327304[/C][C]-2.9998[/C][C]0.001777[/C][/ROW]
[ROW][C]44[/C][C]-0.341257[/C][C]-3.1277[/C][C]0.001211[/C][/ROW]
[ROW][C]45[/C][C]-0.357803[/C][C]-3.2793[/C][C]0.000758[/C][/ROW]
[ROW][C]46[/C][C]-0.368912[/C][C]-3.3811[/C][C]0.000549[/C][/ROW]
[ROW][C]47[/C][C]-0.382189[/C][C]-3.5028[/C][C]0.00037[/C][/ROW]
[ROW][C]48[/C][C]-0.393239[/C][C]-3.6041[/C][C]0.000265[/C][/ROW]
[ROW][C]49[/C][C]-0.403633[/C][C]-3.6994[/C][C]0.000192[/C][/ROW]
[ROW][C]50[/C][C]-0.414922[/C][C]-3.8028[/C][C]0.000135[/C][/ROW]
[ROW][C]51[/C][C]-0.420235[/C][C]-3.8515[/C][C]0.000114[/C][/ROW]
[ROW][C]52[/C][C]-0.428573[/C][C]-3.9279[/C][C]8.8e-05[/C][/ROW]
[ROW][C]53[/C][C]-0.43466[/C][C]-3.9837[/C][C]7.2e-05[/C][/ROW]
[ROW][C]54[/C][C]-0.437228[/C][C]-4.0073[/C][C]6.6e-05[/C][/ROW]
[ROW][C]55[/C][C]-0.432531[/C][C]-3.9642[/C][C]7.7e-05[/C][/ROW]
[ROW][C]56[/C][C]-0.424949[/C][C]-3.8947[/C][C]9.8e-05[/C][/ROW]
[ROW][C]57[/C][C]-0.414893[/C][C]-3.8026[/C][C]0.000135[/C][/ROW]
[ROW][C]58[/C][C]-0.404444[/C][C]-3.7068[/C][C]0.000188[/C][/ROW]
[ROW][C]59[/C][C]-0.391112[/C][C]-3.5846[/C][C]0.000283[/C][/ROW]
[ROW][C]60[/C][C]-0.377993[/C][C]-3.4644[/C][C]0.00042[/C][/ROW]
[/TABLE]
Source: https://freestatistics.org/blog/index.php?pk=35123&T=1

Globally Unique Identifier (entire table): ba.freestatistics.org/blog/index.php?pk=35123&T=1

As an alternative you can also use a QR Code:  

The GUIDs for individual cells are displayed in the table below:

Autocorrelation Function
Time lag kACF(k)T-STATP-value
10.9676338.86850
20.9409348.62380
30.9115738.35470
40.8786638.05310
50.8435897.73160
60.809667.42070
70.7804077.15250
80.7433816.81320
90.707176.48130
100.6743916.18090
110.6363825.83250
120.5987395.48750
130.5652215.18031e-06
140.5334764.88942e-06
150.4927444.51611e-05
160.4541714.16253.8e-05
170.4133173.78810.000142
180.3713673.40360.000511
190.3271442.99830.001785
200.2838622.60160.005482
210.2374482.17630.016172
220.1960111.79650.038007
230.1584591.45230.075072
240.1197361.09740.137802
250.0870480.79780.213615
260.0540090.4950.310946
270.0196040.17970.428921
28-0.013057-0.11970.452514
29-0.042602-0.39050.348595
30-0.066946-0.61360.27058
31-0.092593-0.84860.199251
32-0.115443-1.05810.146532
33-0.140674-1.28930.100417
34-0.170465-1.56230.060984
35-0.197552-1.81060.03689
36-0.221659-2.03150.022681
37-0.242861-2.22590.014351
38-0.262158-2.40270.009238
39-0.277794-2.5460.006361
40-0.290849-2.66570.004607
41-0.301734-2.76540.003494
42-0.31317-2.87030.002594
43-0.327304-2.99980.001777
44-0.341257-3.12770.001211
45-0.357803-3.27930.000758
46-0.368912-3.38110.000549
47-0.382189-3.50280.00037
48-0.393239-3.60410.000265
49-0.403633-3.69940.000192
50-0.414922-3.80280.000135
51-0.420235-3.85150.000114
52-0.428573-3.92798.8e-05
53-0.43466-3.98377.2e-05
54-0.437228-4.00736.6e-05
55-0.432531-3.96427.7e-05
56-0.424949-3.89479.8e-05
57-0.414893-3.80260.000135
58-0.404444-3.70680.000188
59-0.391112-3.58460.000283
60-0.377993-3.46440.00042


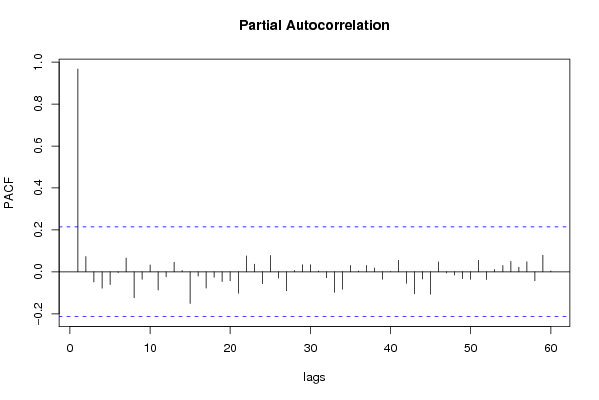
Partial Autocorrelation Function
Time lag kPACF(k)T-STATP-value
10.9676338.86850
20.0725560.6650.25394
3-0.048193-0.44170.329921
4-0.077927-0.71420.238538
5-0.060774-0.5570.289502
6-0.003168-0.0290.488454
70.0654070.59950.275239
8-0.123683-1.13360.1301
9-0.035678-0.3270.372243
100.03310.30340.381181
11-0.08642-0.79210.215279
12-0.023471-0.21510.415101
130.0457430.41920.338054
140.0059230.05430.478417
15-0.150524-1.37960.08569
16-0.01992-0.18260.427787
17-0.077452-0.70990.239879
18-0.025522-0.23390.407812
19-0.046038-0.42190.337072
20-0.042739-0.39170.348134
21-0.101972-0.93460.176339
220.0757080.69390.244837
230.0359840.32980.371188
24-0.057511-0.52710.299759
250.0783250.71790.237417
26-0.029487-0.27030.393813
27-0.090682-0.83110.204132
280.0065120.05970.476275
290.034010.31170.378017
300.0342080.31350.377332
310.0040830.03740.485119
32-0.028246-0.25890.398182
33-0.097868-0.8970.186147
34-0.082804-0.75890.225016
350.0298660.27370.392485
360.0038510.03530.485966
370.0304290.27890.390509
380.0177250.16240.435671
39-0.035016-0.32090.374532
403.6e-053e-040.49987
410.0548640.50280.308198
42-0.054724-0.50160.308647
43-0.10454-0.95810.170374
44-0.034499-0.31620.376321
45-0.106558-0.97660.165782
460.047360.43410.332679
47-0.005071-0.04650.481521
48-0.015584-0.14280.443383
49-0.032695-0.29970.382592
50-0.035708-0.32730.372138
510.0551450.50540.307296
52-0.036415-0.33370.3697
530.0115380.10580.458016
540.0300070.2750.391989
550.0494650.45340.325731
560.0214760.19680.422219
570.0476330.43660.331774
58-0.042577-0.39020.348678
590.0787970.72220.236093
600.00440.04030.483964

\begin{tabular}{lllllllll}
\hline
Partial Autocorrelation Function \tabularnewline
Time lag k & PACF(k) & T-STAT & P-value \tabularnewline
1 & 0.967633 & 8.8685 & 0 \tabularnewline
2 & 0.072556 & 0.665 & 0.25394 \tabularnewline
3 & -0.048193 & -0.4417 & 0.329921 \tabularnewline
4 & -0.077927 & -0.7142 & 0.238538 \tabularnewline
5 & -0.060774 & -0.557 & 0.289502 \tabularnewline
6 & -0.003168 & -0.029 & 0.488454 \tabularnewline
7 & 0.065407 & 0.5995 & 0.275239 \tabularnewline
8 & -0.123683 & -1.1336 & 0.1301 \tabularnewline
9 & -0.035678 & -0.327 & 0.372243 \tabularnewline
10 & 0.0331 & 0.3034 & 0.381181 \tabularnewline
11 & -0.08642 & -0.7921 & 0.215279 \tabularnewline
12 & -0.023471 & -0.2151 & 0.415101 \tabularnewline
13 & 0.045743 & 0.4192 & 0.338054 \tabularnewline
14 & 0.005923 & 0.0543 & 0.478417 \tabularnewline
15 & -0.150524 & -1.3796 & 0.08569 \tabularnewline
16 & -0.01992 & -0.1826 & 0.427787 \tabularnewline
17 & -0.077452 & -0.7099 & 0.239879 \tabularnewline
18 & -0.025522 & -0.2339 & 0.407812 \tabularnewline
19 & -0.046038 & -0.4219 & 0.337072 \tabularnewline
20 & -0.042739 & -0.3917 & 0.348134 \tabularnewline
21 & -0.101972 & -0.9346 & 0.176339 \tabularnewline
22 & 0.075708 & 0.6939 & 0.244837 \tabularnewline
23 & 0.035984 & 0.3298 & 0.371188 \tabularnewline
24 & -0.057511 & -0.5271 & 0.299759 \tabularnewline
25 & 0.078325 & 0.7179 & 0.237417 \tabularnewline
26 & -0.029487 & -0.2703 & 0.393813 \tabularnewline
27 & -0.090682 & -0.8311 & 0.204132 \tabularnewline
28 & 0.006512 & 0.0597 & 0.476275 \tabularnewline
29 & 0.03401 & 0.3117 & 0.378017 \tabularnewline
30 & 0.034208 & 0.3135 & 0.377332 \tabularnewline
31 & 0.004083 & 0.0374 & 0.485119 \tabularnewline
32 & -0.028246 & -0.2589 & 0.398182 \tabularnewline
33 & -0.097868 & -0.897 & 0.186147 \tabularnewline
34 & -0.082804 & -0.7589 & 0.225016 \tabularnewline
35 & 0.029866 & 0.2737 & 0.392485 \tabularnewline
36 & 0.003851 & 0.0353 & 0.485966 \tabularnewline
37 & 0.030429 & 0.2789 & 0.390509 \tabularnewline
38 & 0.017725 & 0.1624 & 0.435671 \tabularnewline
39 & -0.035016 & -0.3209 & 0.374532 \tabularnewline
40 & 3.6e-05 & 3e-04 & 0.49987 \tabularnewline
41 & 0.054864 & 0.5028 & 0.308198 \tabularnewline
42 & -0.054724 & -0.5016 & 0.308647 \tabularnewline
43 & -0.10454 & -0.9581 & 0.170374 \tabularnewline
44 & -0.034499 & -0.3162 & 0.376321 \tabularnewline
45 & -0.106558 & -0.9766 & 0.165782 \tabularnewline
46 & 0.04736 & 0.4341 & 0.332679 \tabularnewline
47 & -0.005071 & -0.0465 & 0.481521 \tabularnewline
48 & -0.015584 & -0.1428 & 0.443383 \tabularnewline
49 & -0.032695 & -0.2997 & 0.382592 \tabularnewline
50 & -0.035708 & -0.3273 & 0.372138 \tabularnewline
51 & 0.055145 & 0.5054 & 0.307296 \tabularnewline
52 & -0.036415 & -0.3337 & 0.3697 \tabularnewline
53 & 0.011538 & 0.1058 & 0.458016 \tabularnewline
54 & 0.030007 & 0.275 & 0.391989 \tabularnewline
55 & 0.049465 & 0.4534 & 0.325731 \tabularnewline
56 & 0.021476 & 0.1968 & 0.422219 \tabularnewline
57 & 0.047633 & 0.4366 & 0.331774 \tabularnewline
58 & -0.042577 & -0.3902 & 0.348678 \tabularnewline
59 & 0.078797 & 0.7222 & 0.236093 \tabularnewline
60 & 0.0044 & 0.0403 & 0.483964 \tabularnewline
\hline
\end{tabular}
%Source: https://freestatistics.org/blog/index.php?pk=35123&T=2

[TABLE]
[ROW][C]Partial Autocorrelation Function[/C][/ROW]
[ROW][C]Time lag k[/C][C]PACF(k)[/C][C]T-STAT[/C][C]P-value[/C][/ROW]
[ROW][C]1[/C][C]0.967633[/C][C]8.8685[/C][C]0[/C][/ROW]
[ROW][C]2[/C][C]0.072556[/C][C]0.665[/C][C]0.25394[/C][/ROW]
[ROW][C]3[/C][C]-0.048193[/C][C]-0.4417[/C][C]0.329921[/C][/ROW]
[ROW][C]4[/C][C]-0.077927[/C][C]-0.7142[/C][C]0.238538[/C][/ROW]
[ROW][C]5[/C][C]-0.060774[/C][C]-0.557[/C][C]0.289502[/C][/ROW]
[ROW][C]6[/C][C]-0.003168[/C][C]-0.029[/C][C]0.488454[/C][/ROW]
[ROW][C]7[/C][C]0.065407[/C][C]0.5995[/C][C]0.275239[/C][/ROW]
[ROW][C]8[/C][C]-0.123683[/C][C]-1.1336[/C][C]0.1301[/C][/ROW]
[ROW][C]9[/C][C]-0.035678[/C][C]-0.327[/C][C]0.372243[/C][/ROW]
[ROW][C]10[/C][C]0.0331[/C][C]0.3034[/C][C]0.381181[/C][/ROW]
[ROW][C]11[/C][C]-0.08642[/C][C]-0.7921[/C][C]0.215279[/C][/ROW]
[ROW][C]12[/C][C]-0.023471[/C][C]-0.2151[/C][C]0.415101[/C][/ROW]
[ROW][C]13[/C][C]0.045743[/C][C]0.4192[/C][C]0.338054[/C][/ROW]
[ROW][C]14[/C][C]0.005923[/C][C]0.0543[/C][C]0.478417[/C][/ROW]
[ROW][C]15[/C][C]-0.150524[/C][C]-1.3796[/C][C]0.08569[/C][/ROW]
[ROW][C]16[/C][C]-0.01992[/C][C]-0.1826[/C][C]0.427787[/C][/ROW]
[ROW][C]17[/C][C]-0.077452[/C][C]-0.7099[/C][C]0.239879[/C][/ROW]
[ROW][C]18[/C][C]-0.025522[/C][C]-0.2339[/C][C]0.407812[/C][/ROW]
[ROW][C]19[/C][C]-0.046038[/C][C]-0.4219[/C][C]0.337072[/C][/ROW]
[ROW][C]20[/C][C]-0.042739[/C][C]-0.3917[/C][C]0.348134[/C][/ROW]
[ROW][C]21[/C][C]-0.101972[/C][C]-0.9346[/C][C]0.176339[/C][/ROW]
[ROW][C]22[/C][C]0.075708[/C][C]0.6939[/C][C]0.244837[/C][/ROW]
[ROW][C]23[/C][C]0.035984[/C][C]0.3298[/C][C]0.371188[/C][/ROW]
[ROW][C]24[/C][C]-0.057511[/C][C]-0.5271[/C][C]0.299759[/C][/ROW]
[ROW][C]25[/C][C]0.078325[/C][C]0.7179[/C][C]0.237417[/C][/ROW]
[ROW][C]26[/C][C]-0.029487[/C][C]-0.2703[/C][C]0.393813[/C][/ROW]
[ROW][C]27[/C][C]-0.090682[/C][C]-0.8311[/C][C]0.204132[/C][/ROW]
[ROW][C]28[/C][C]0.006512[/C][C]0.0597[/C][C]0.476275[/C][/ROW]
[ROW][C]29[/C][C]0.03401[/C][C]0.3117[/C][C]0.378017[/C][/ROW]
[ROW][C]30[/C][C]0.034208[/C][C]0.3135[/C][C]0.377332[/C][/ROW]
[ROW][C]31[/C][C]0.004083[/C][C]0.0374[/C][C]0.485119[/C][/ROW]
[ROW][C]32[/C][C]-0.028246[/C][C]-0.2589[/C][C]0.398182[/C][/ROW]
[ROW][C]33[/C][C]-0.097868[/C][C]-0.897[/C][C]0.186147[/C][/ROW]
[ROW][C]34[/C][C]-0.082804[/C][C]-0.7589[/C][C]0.225016[/C][/ROW]
[ROW][C]35[/C][C]0.029866[/C][C]0.2737[/C][C]0.392485[/C][/ROW]
[ROW][C]36[/C][C]0.003851[/C][C]0.0353[/C][C]0.485966[/C][/ROW]
[ROW][C]37[/C][C]0.030429[/C][C]0.2789[/C][C]0.390509[/C][/ROW]
[ROW][C]38[/C][C]0.017725[/C][C]0.1624[/C][C]0.435671[/C][/ROW]
[ROW][C]39[/C][C]-0.035016[/C][C]-0.3209[/C][C]0.374532[/C][/ROW]
[ROW][C]40[/C][C]3.6e-05[/C][C]3e-04[/C][C]0.49987[/C][/ROW]
[ROW][C]41[/C][C]0.054864[/C][C]0.5028[/C][C]0.308198[/C][/ROW]
[ROW][C]42[/C][C]-0.054724[/C][C]-0.5016[/C][C]0.308647[/C][/ROW]
[ROW][C]43[/C][C]-0.10454[/C][C]-0.9581[/C][C]0.170374[/C][/ROW]
[ROW][C]44[/C][C]-0.034499[/C][C]-0.3162[/C][C]0.376321[/C][/ROW]
[ROW][C]45[/C][C]-0.106558[/C][C]-0.9766[/C][C]0.165782[/C][/ROW]
[ROW][C]46[/C][C]0.04736[/C][C]0.4341[/C][C]0.332679[/C][/ROW]
[ROW][C]47[/C][C]-0.005071[/C][C]-0.0465[/C][C]0.481521[/C][/ROW]
[ROW][C]48[/C][C]-0.015584[/C][C]-0.1428[/C][C]0.443383[/C][/ROW]
[ROW][C]49[/C][C]-0.032695[/C][C]-0.2997[/C][C]0.382592[/C][/ROW]
[ROW][C]50[/C][C]-0.035708[/C][C]-0.3273[/C][C]0.372138[/C][/ROW]
[ROW][C]51[/C][C]0.055145[/C][C]0.5054[/C][C]0.307296[/C][/ROW]
[ROW][C]52[/C][C]-0.036415[/C][C]-0.3337[/C][C]0.3697[/C][/ROW]
[ROW][C]53[/C][C]0.011538[/C][C]0.1058[/C][C]0.458016[/C][/ROW]
[ROW][C]54[/C][C]0.030007[/C][C]0.275[/C][C]0.391989[/C][/ROW]
[ROW][C]55[/C][C]0.049465[/C][C]0.4534[/C][C]0.325731[/C][/ROW]
[ROW][C]56[/C][C]0.021476[/C][C]0.1968[/C][C]0.422219[/C][/ROW]
[ROW][C]57[/C][C]0.047633[/C][C]0.4366[/C][C]0.331774[/C][/ROW]
[ROW][C]58[/C][C]-0.042577[/C][C]-0.3902[/C][C]0.348678[/C][/ROW]
[ROW][C]59[/C][C]0.078797[/C][C]0.7222[/C][C]0.236093[/C][/ROW]
[ROW][C]60[/C][C]0.0044[/C][C]0.0403[/C][C]0.483964[/C][/ROW]
[/TABLE]
Source: https://freestatistics.org/blog/index.php?pk=35123&T=2

Globally Unique Identifier (entire table): ba.freestatistics.org/blog/index.php?pk=35123&T=2

As an alternative you can also use a QR Code:  

The GUIDs for individual cells are displayed in the table below:

Partial Autocorrelation Function
Time lag kPACF(k)T-STATP-value
10.9676338.86850
20.0725560.6650.25394
3-0.048193-0.44170.329921
4-0.077927-0.71420.238538
5-0.060774-0.5570.289502
6-0.003168-0.0290.488454
70.0654070.59950.275239
8-0.123683-1.13360.1301
9-0.035678-0.3270.372243
100.03310.30340.381181
11-0.08642-0.79210.215279
12-0.023471-0.21510.415101
130.0457430.41920.338054
140.0059230.05430.478417
15-0.150524-1.37960.08569
16-0.01992-0.18260.427787
17-0.077452-0.70990.239879
18-0.025522-0.23390.407812
19-0.046038-0.42190.337072
20-0.042739-0.39170.348134
21-0.101972-0.93460.176339
220.0757080.69390.244837
230.0359840.32980.371188
24-0.057511-0.52710.299759
250.0783250.71790.237417
26-0.029487-0.27030.393813
27-0.090682-0.83110.204132
280.0065120.05970.476275
290.034010.31170.378017
300.0342080.31350.377332
310.0040830.03740.485119
32-0.028246-0.25890.398182
33-0.097868-0.8970.186147
34-0.082804-0.75890.225016
350.0298660.27370.392485
360.0038510.03530.485966
370.0304290.27890.390509
380.0177250.16240.435671
39-0.035016-0.32090.374532
403.6e-053e-040.49987
410.0548640.50280.308198
42-0.054724-0.50160.308647
43-0.10454-0.95810.170374
44-0.034499-0.31620.376321
45-0.106558-0.97660.165782
460.047360.43410.332679
47-0.005071-0.04650.481521
48-0.015584-0.14280.443383
49-0.032695-0.29970.382592
50-0.035708-0.32730.372138
510.0551450.50540.307296
52-0.036415-0.33370.3697
530.0115380.10580.458016
540.0300070.2750.391989
550.0494650.45340.325731
560.0214760.19680.422219
570.0476330.43660.331774
58-0.042577-0.39020.348678
590.0787970.72220.236093
600.00440.04030.483964


Parameters (Session):
par1 = 60 ; par2 = 1 ; par3 = 0 ; par4 = 0 ; par5 = 12 ;
Parameters (R input):
par1 = 60 ; par2 = 1 ; par3 = 0 ; par4 = 0 ; par5 = 12 ;
R code (references can be found in the software module):
if (par1 == 'Default') {
par1 = 10*log10(length(x))
} else {
par1 <- as.numeric(par1)
}
par2 <- as.numeric(par2)
par3 <- as.numeric(par3)
par4 <- as.numeric(par4)
par5 <- as.numeric(par5)
if (par2 == 0) {
x <- log(x)
} else {
x <- (x ^ par2 - 1) / par2
}
if (par3 > 0) x <- diff(x,lag=1,difference=par3)
if (par4 > 0) x <- diff(x,lag=par5,difference=par4)
bitmap(file='pic1.png')
racf <- acf(x,par1,main='Autocorrelation',xlab='lags',ylab='ACF')
dev.off()
bitmap(file='pic2.png')
rpacf <- pacf(x,par1,main='Partial Autocorrelation',xlab='lags',ylab='PACF')
dev.off()
(myacf <- c(racf$acf))
(mypacf <- c(rpacf$acf))
lengthx <- length(x)
sqrtn <- sqrt(lengthx)
load(file='createtable')
a<-table.start()
a<-table.row.start(a)
a<-table.element(a,'Autocorrelation Function',4,TRUE)
a<-table.row.end(a)
a<-table.row.start(a)
a<-table.element(a,'Time lag k',header=TRUE)
a<-table.element(a,hyperlink('basics.htm','ACF(k)','click here for more information about the Autocorrelation Function'),header=TRUE)
a<-table.element(a,'T-STAT',header=TRUE)
a<-table.element(a,'P-value',header=TRUE)
a<-table.row.end(a)
for (i in 2:(par1+1)) {
a<-table.row.start(a)
a<-table.element(a,i-1,header=TRUE)
a<-table.element(a,round(myacf[i],6))
mytstat <- myacf[i]*sqrtn
a<-table.element(a,round(mytstat,4))
a<-table.element(a,round(1-pt(abs(mytstat),lengthx),6))
a<-table.row.end(a)
}
a<-table.end(a)
table.save(a,file='mytable.tab')
a<-table.start()
a<-table.row.start(a)
a<-table.element(a,'Partial Autocorrelation Function',4,TRUE)
a<-table.row.end(a)
a<-table.row.start(a)
a<-table.element(a,'Time lag k',header=TRUE)
a<-table.element(a,hyperlink('basics.htm','PACF(k)','click here for more information about the Partial Autocorrelation Function'),header=TRUE)
a<-table.element(a,'T-STAT',header=TRUE)
a<-table.element(a,'P-value',header=TRUE)
a<-table.row.end(a)
for (i in 1:par1) {
a<-table.row.start(a)
a<-table.element(a,i,header=TRUE)
a<-table.element(a,round(mypacf[i],6))
mytstat <- mypacf[i]*sqrtn
a<-table.element(a,round(mytstat,4))
a<-table.element(a,round(1-pt(abs(mytstat),lengthx),6))
a<-table.row.end(a)
}
a<-table.end(a)
table.save(a,file='mytable1.tab')