Free Statistics

of Irreproducible Research!

Author's title

Author*Unverified author*
R Software Modulerwasp_autocorrelation.wasp
Title produced by software(Partial) Autocorrelation Function
Date of computationFri, 19 Dec 2008 06:21:38 -0700
Cite this page as followsStatistical Computations at FreeStatistics.org, Office for Research Development and Education, URL https://freestatistics.org/blog/index.php?v=date/2008/Dec/19/t1229692935xvmsrk1ktasn3ft.htm/, Retrieved Thu, 16 May 2024 01:06:12 +0000
Statistical Computations at FreeStatistics.org, Office for Research Development and Education, URL https://freestatistics.org/blog/index.php?pk=35111, Retrieved Thu, 16 May 2024 01:06:12 +0000
QR Codes:

Original text written by user:
IsPrivate?No (this computation is public)
User-defined keywords
Estimated Impact212
Family? (F = Feedback message, R = changed R code, M = changed R Module, P = changed Parameters, D = changed Data)
-     [Standard Deviation-Mean Plot] [Paper2] [2008-12-19 12:57:19] [8ac58ef7b35dc5a117bc162cf16850e9]
- RMP     [(Partial) Autocorrelation Function] [Paper10] [2008-12-19 13:21:38] [acca1d0ee7cc95ffc080d0867a313954] [Current]
-           [(Partial) Autocorrelation Function] [Paper 10] [2008-12-24 12:00:06] [74be16979710d4c4e7c6647856088456]
Feedback Forum

Post a new message
Dataseries X:
4.256
5.008
4.181
4.666
4.476
4.912
4.340
3.830
4.285
5.537
3.813
4.610
4.207
5.099
4.112
4.199
5.110
4.218
4.736
4.624
4.145
5.299
5.011
4.730
4.619
5.578
5.369
4.902
6.102
5.024
5.731
5.732
4.491
4.755
5.208
4.962
4.163
5.592
5.754
4.929
5.219
4.429
4.143
4.308
3.996
4.634
4.138
3.759
3.922
5.560
4.004
3.937
5.250
3.908
4.814
4.407
3.243
3.740
3.949
3.711


Summary of computational transaction
Raw Inputview raw input (R code)
Raw Outputview raw output of R engine
Computing time5 seconds
R Server'Sir Ronald Aylmer Fisher' @ 193.190.124.24

\begin{tabular}{lllllllll}
\hline
Summary of computational transaction \tabularnewline
Raw Input & view raw input (R code)  \tabularnewline
Raw Output & view raw output of R engine  \tabularnewline
Computing time & 5 seconds \tabularnewline
R Server & 'Sir Ronald Aylmer Fisher' @ 193.190.124.24 \tabularnewline
\hline
\end{tabular}
%Source: https://freestatistics.org/blog/index.php?pk=35111&T=0

[TABLE]
[ROW][C]Summary of computational transaction[/C][/ROW]
[ROW][C]Raw Input[/C][C]view raw input (R code) [/C][/ROW]
[ROW][C]Raw Output[/C][C]view raw output of R engine [/C][/ROW]
[ROW][C]Computing time[/C][C]5 seconds[/C][/ROW]
[ROW][C]R Server[/C][C]'Sir Ronald Aylmer Fisher' @ 193.190.124.24[/C][/ROW]
[/TABLE]
Source: https://freestatistics.org/blog/index.php?pk=35111&T=0

Globally Unique Identifier (entire table): ba.freestatistics.org/blog/index.php?pk=35111&T=0

As an alternative you can also use a QR Code:  

The GUIDs for individual cells are displayed in the table below:

Summary of computational transaction
Raw Inputview raw input (R code)
Raw Outputview raw output of R engine
Computing time5 seconds
R Server'Sir Ronald Aylmer Fisher' @ 193.190.124.24


Autocorrelation Function
Time lag kACF(k)T-STATP-value
10.2211791.71320.045915
20.2394431.85470.034276
30.4291953.32450.000757
40.1830621.4180.080683
50.1600961.24010.109883
60.1545421.19710.117993
70.1088420.84310.201265
80.1147560.88890.188805
90.1987291.53930.064489
100.1143740.88590.189594
11-0.019831-0.15360.439218
120.2498241.93510.028846
13-0.067298-0.52130.302042
14-0.050133-0.38830.349573
150.0227530.17620.430348
16-0.190971-1.47930.072151
17-0.119095-0.92250.179979
18-0.234057-1.8130.037418
19-0.244168-1.89130.031706
20-0.274058-2.12280.018951
21-0.146031-1.13110.131247
22-0.176649-1.36830.088158
23-0.227507-1.76230.04156
24-0.044477-0.34450.36583
25-0.211093-1.63510.05363
26-0.178338-1.38140.08614
27-0.137862-1.06790.144927
28-0.233217-1.80650.037929
29-0.125933-0.97550.166622
30-0.15098-1.16950.123416
31-0.180013-1.39440.084173
32-0.109252-0.84630.200384
33-0.017961-0.13910.44491
34-0.062874-0.4870.314008
35-0.11362-0.88010.19116
360.1094640.84790.19993
37-0.03085-0.2390.405973
38-0.03582-0.27750.391189
390.0417640.32350.373719
400.0604230.4680.320728
410.0485080.37570.354218
42-0.01554-0.12040.452295
430.0468110.36260.359091
440.0580630.44980.327255
450.028070.21740.414305
460.0504120.39050.348778
47-0.006122-0.04740.481166
480.037990.29430.384784
490.0628170.48660.314165
500.0021260.01650.493456
510.0652740.50560.307491
520.0111240.08620.46581
530.0239220.18530.426811
540.0107690.08340.4669
550.0018520.01430.4943
560.0179980.13940.444795
570.0197890.15330.439344
58-0.004381-0.03390.48652
590.0141590.10970.456516
60NANANA

\begin{tabular}{lllllllll}
\hline
Autocorrelation Function \tabularnewline
Time lag k & ACF(k) & T-STAT & P-value \tabularnewline
1 & 0.221179 & 1.7132 & 0.045915 \tabularnewline
2 & 0.239443 & 1.8547 & 0.034276 \tabularnewline
3 & 0.429195 & 3.3245 & 0.000757 \tabularnewline
4 & 0.183062 & 1.418 & 0.080683 \tabularnewline
5 & 0.160096 & 1.2401 & 0.109883 \tabularnewline
6 & 0.154542 & 1.1971 & 0.117993 \tabularnewline
7 & 0.108842 & 0.8431 & 0.201265 \tabularnewline
8 & 0.114756 & 0.8889 & 0.188805 \tabularnewline
9 & 0.198729 & 1.5393 & 0.064489 \tabularnewline
10 & 0.114374 & 0.8859 & 0.189594 \tabularnewline
11 & -0.019831 & -0.1536 & 0.439218 \tabularnewline
12 & 0.249824 & 1.9351 & 0.028846 \tabularnewline
13 & -0.067298 & -0.5213 & 0.302042 \tabularnewline
14 & -0.050133 & -0.3883 & 0.349573 \tabularnewline
15 & 0.022753 & 0.1762 & 0.430348 \tabularnewline
16 & -0.190971 & -1.4793 & 0.072151 \tabularnewline
17 & -0.119095 & -0.9225 & 0.179979 \tabularnewline
18 & -0.234057 & -1.813 & 0.037418 \tabularnewline
19 & -0.244168 & -1.8913 & 0.031706 \tabularnewline
20 & -0.274058 & -2.1228 & 0.018951 \tabularnewline
21 & -0.146031 & -1.1311 & 0.131247 \tabularnewline
22 & -0.176649 & -1.3683 & 0.088158 \tabularnewline
23 & -0.227507 & -1.7623 & 0.04156 \tabularnewline
24 & -0.044477 & -0.3445 & 0.36583 \tabularnewline
25 & -0.211093 & -1.6351 & 0.05363 \tabularnewline
26 & -0.178338 & -1.3814 & 0.08614 \tabularnewline
27 & -0.137862 & -1.0679 & 0.144927 \tabularnewline
28 & -0.233217 & -1.8065 & 0.037929 \tabularnewline
29 & -0.125933 & -0.9755 & 0.166622 \tabularnewline
30 & -0.15098 & -1.1695 & 0.123416 \tabularnewline
31 & -0.180013 & -1.3944 & 0.084173 \tabularnewline
32 & -0.109252 & -0.8463 & 0.200384 \tabularnewline
33 & -0.017961 & -0.1391 & 0.44491 \tabularnewline
34 & -0.062874 & -0.487 & 0.314008 \tabularnewline
35 & -0.11362 & -0.8801 & 0.19116 \tabularnewline
36 & 0.109464 & 0.8479 & 0.19993 \tabularnewline
37 & -0.03085 & -0.239 & 0.405973 \tabularnewline
38 & -0.03582 & -0.2775 & 0.391189 \tabularnewline
39 & 0.041764 & 0.3235 & 0.373719 \tabularnewline
40 & 0.060423 & 0.468 & 0.320728 \tabularnewline
41 & 0.048508 & 0.3757 & 0.354218 \tabularnewline
42 & -0.01554 & -0.1204 & 0.452295 \tabularnewline
43 & 0.046811 & 0.3626 & 0.359091 \tabularnewline
44 & 0.058063 & 0.4498 & 0.327255 \tabularnewline
45 & 0.02807 & 0.2174 & 0.414305 \tabularnewline
46 & 0.050412 & 0.3905 & 0.348778 \tabularnewline
47 & -0.006122 & -0.0474 & 0.481166 \tabularnewline
48 & 0.03799 & 0.2943 & 0.384784 \tabularnewline
49 & 0.062817 & 0.4866 & 0.314165 \tabularnewline
50 & 0.002126 & 0.0165 & 0.493456 \tabularnewline
51 & 0.065274 & 0.5056 & 0.307491 \tabularnewline
52 & 0.011124 & 0.0862 & 0.46581 \tabularnewline
53 & 0.023922 & 0.1853 & 0.426811 \tabularnewline
54 & 0.010769 & 0.0834 & 0.4669 \tabularnewline
55 & 0.001852 & 0.0143 & 0.4943 \tabularnewline
56 & 0.017998 & 0.1394 & 0.444795 \tabularnewline
57 & 0.019789 & 0.1533 & 0.439344 \tabularnewline
58 & -0.004381 & -0.0339 & 0.48652 \tabularnewline
59 & 0.014159 & 0.1097 & 0.456516 \tabularnewline
60 & NA & NA & NA \tabularnewline
\hline
\end{tabular}
%Source: https://freestatistics.org/blog/index.php?pk=35111&T=1

[TABLE]
[ROW][C]Autocorrelation Function[/C][/ROW]
[ROW][C]Time lag k[/C][C]ACF(k)[/C][C]T-STAT[/C][C]P-value[/C][/ROW]
[ROW][C]1[/C][C]0.221179[/C][C]1.7132[/C][C]0.045915[/C][/ROW]
[ROW][C]2[/C][C]0.239443[/C][C]1.8547[/C][C]0.034276[/C][/ROW]
[ROW][C]3[/C][C]0.429195[/C][C]3.3245[/C][C]0.000757[/C][/ROW]
[ROW][C]4[/C][C]0.183062[/C][C]1.418[/C][C]0.080683[/C][/ROW]
[ROW][C]5[/C][C]0.160096[/C][C]1.2401[/C][C]0.109883[/C][/ROW]
[ROW][C]6[/C][C]0.154542[/C][C]1.1971[/C][C]0.117993[/C][/ROW]
[ROW][C]7[/C][C]0.108842[/C][C]0.8431[/C][C]0.201265[/C][/ROW]
[ROW][C]8[/C][C]0.114756[/C][C]0.8889[/C][C]0.188805[/C][/ROW]
[ROW][C]9[/C][C]0.198729[/C][C]1.5393[/C][C]0.064489[/C][/ROW]
[ROW][C]10[/C][C]0.114374[/C][C]0.8859[/C][C]0.189594[/C][/ROW]
[ROW][C]11[/C][C]-0.019831[/C][C]-0.1536[/C][C]0.439218[/C][/ROW]
[ROW][C]12[/C][C]0.249824[/C][C]1.9351[/C][C]0.028846[/C][/ROW]
[ROW][C]13[/C][C]-0.067298[/C][C]-0.5213[/C][C]0.302042[/C][/ROW]
[ROW][C]14[/C][C]-0.050133[/C][C]-0.3883[/C][C]0.349573[/C][/ROW]
[ROW][C]15[/C][C]0.022753[/C][C]0.1762[/C][C]0.430348[/C][/ROW]
[ROW][C]16[/C][C]-0.190971[/C][C]-1.4793[/C][C]0.072151[/C][/ROW]
[ROW][C]17[/C][C]-0.119095[/C][C]-0.9225[/C][C]0.179979[/C][/ROW]
[ROW][C]18[/C][C]-0.234057[/C][C]-1.813[/C][C]0.037418[/C][/ROW]
[ROW][C]19[/C][C]-0.244168[/C][C]-1.8913[/C][C]0.031706[/C][/ROW]
[ROW][C]20[/C][C]-0.274058[/C][C]-2.1228[/C][C]0.018951[/C][/ROW]
[ROW][C]21[/C][C]-0.146031[/C][C]-1.1311[/C][C]0.131247[/C][/ROW]
[ROW][C]22[/C][C]-0.176649[/C][C]-1.3683[/C][C]0.088158[/C][/ROW]
[ROW][C]23[/C][C]-0.227507[/C][C]-1.7623[/C][C]0.04156[/C][/ROW]
[ROW][C]24[/C][C]-0.044477[/C][C]-0.3445[/C][C]0.36583[/C][/ROW]
[ROW][C]25[/C][C]-0.211093[/C][C]-1.6351[/C][C]0.05363[/C][/ROW]
[ROW][C]26[/C][C]-0.178338[/C][C]-1.3814[/C][C]0.08614[/C][/ROW]
[ROW][C]27[/C][C]-0.137862[/C][C]-1.0679[/C][C]0.144927[/C][/ROW]
[ROW][C]28[/C][C]-0.233217[/C][C]-1.8065[/C][C]0.037929[/C][/ROW]
[ROW][C]29[/C][C]-0.125933[/C][C]-0.9755[/C][C]0.166622[/C][/ROW]
[ROW][C]30[/C][C]-0.15098[/C][C]-1.1695[/C][C]0.123416[/C][/ROW]
[ROW][C]31[/C][C]-0.180013[/C][C]-1.3944[/C][C]0.084173[/C][/ROW]
[ROW][C]32[/C][C]-0.109252[/C][C]-0.8463[/C][C]0.200384[/C][/ROW]
[ROW][C]33[/C][C]-0.017961[/C][C]-0.1391[/C][C]0.44491[/C][/ROW]
[ROW][C]34[/C][C]-0.062874[/C][C]-0.487[/C][C]0.314008[/C][/ROW]
[ROW][C]35[/C][C]-0.11362[/C][C]-0.8801[/C][C]0.19116[/C][/ROW]
[ROW][C]36[/C][C]0.109464[/C][C]0.8479[/C][C]0.19993[/C][/ROW]
[ROW][C]37[/C][C]-0.03085[/C][C]-0.239[/C][C]0.405973[/C][/ROW]
[ROW][C]38[/C][C]-0.03582[/C][C]-0.2775[/C][C]0.391189[/C][/ROW]
[ROW][C]39[/C][C]0.041764[/C][C]0.3235[/C][C]0.373719[/C][/ROW]
[ROW][C]40[/C][C]0.060423[/C][C]0.468[/C][C]0.320728[/C][/ROW]
[ROW][C]41[/C][C]0.048508[/C][C]0.3757[/C][C]0.354218[/C][/ROW]
[ROW][C]42[/C][C]-0.01554[/C][C]-0.1204[/C][C]0.452295[/C][/ROW]
[ROW][C]43[/C][C]0.046811[/C][C]0.3626[/C][C]0.359091[/C][/ROW]
[ROW][C]44[/C][C]0.058063[/C][C]0.4498[/C][C]0.327255[/C][/ROW]
[ROW][C]45[/C][C]0.02807[/C][C]0.2174[/C][C]0.414305[/C][/ROW]
[ROW][C]46[/C][C]0.050412[/C][C]0.3905[/C][C]0.348778[/C][/ROW]
[ROW][C]47[/C][C]-0.006122[/C][C]-0.0474[/C][C]0.481166[/C][/ROW]
[ROW][C]48[/C][C]0.03799[/C][C]0.2943[/C][C]0.384784[/C][/ROW]
[ROW][C]49[/C][C]0.062817[/C][C]0.4866[/C][C]0.314165[/C][/ROW]
[ROW][C]50[/C][C]0.002126[/C][C]0.0165[/C][C]0.493456[/C][/ROW]
[ROW][C]51[/C][C]0.065274[/C][C]0.5056[/C][C]0.307491[/C][/ROW]
[ROW][C]52[/C][C]0.011124[/C][C]0.0862[/C][C]0.46581[/C][/ROW]
[ROW][C]53[/C][C]0.023922[/C][C]0.1853[/C][C]0.426811[/C][/ROW]
[ROW][C]54[/C][C]0.010769[/C][C]0.0834[/C][C]0.4669[/C][/ROW]
[ROW][C]55[/C][C]0.001852[/C][C]0.0143[/C][C]0.4943[/C][/ROW]
[ROW][C]56[/C][C]0.017998[/C][C]0.1394[/C][C]0.444795[/C][/ROW]
[ROW][C]57[/C][C]0.019789[/C][C]0.1533[/C][C]0.439344[/C][/ROW]
[ROW][C]58[/C][C]-0.004381[/C][C]-0.0339[/C][C]0.48652[/C][/ROW]
[ROW][C]59[/C][C]0.014159[/C][C]0.1097[/C][C]0.456516[/C][/ROW]
[ROW][C]60[/C][C]NA[/C][C]NA[/C][C]NA[/C][/ROW]
[/TABLE]
Source: https://freestatistics.org/blog/index.php?pk=35111&T=1

Globally Unique Identifier (entire table): ba.freestatistics.org/blog/index.php?pk=35111&T=1

As an alternative you can also use a QR Code:  

The GUIDs for individual cells are displayed in the table below:

Autocorrelation Function
Time lag kACF(k)T-STATP-value
10.2211791.71320.045915
20.2394431.85470.034276
30.4291953.32450.000757
40.1830621.4180.080683
50.1600961.24010.109883
60.1545421.19710.117993
70.1088420.84310.201265
80.1147560.88890.188805
90.1987291.53930.064489
100.1143740.88590.189594
11-0.019831-0.15360.439218
120.2498241.93510.028846
13-0.067298-0.52130.302042
14-0.050133-0.38830.349573
150.0227530.17620.430348
16-0.190971-1.47930.072151
17-0.119095-0.92250.179979
18-0.234057-1.8130.037418
19-0.244168-1.89130.031706
20-0.274058-2.12280.018951
21-0.146031-1.13110.131247
22-0.176649-1.36830.088158
23-0.227507-1.76230.04156
24-0.044477-0.34450.36583
25-0.211093-1.63510.05363
26-0.178338-1.38140.08614
27-0.137862-1.06790.144927
28-0.233217-1.80650.037929
29-0.125933-0.97550.166622
30-0.15098-1.16950.123416
31-0.180013-1.39440.084173
32-0.109252-0.84630.200384
33-0.017961-0.13910.44491
34-0.062874-0.4870.314008
35-0.11362-0.88010.19116
360.1094640.84790.19993
37-0.03085-0.2390.405973
38-0.03582-0.27750.391189
390.0417640.32350.373719
400.0604230.4680.320728
410.0485080.37570.354218
42-0.01554-0.12040.452295
430.0468110.36260.359091
440.0580630.44980.327255
450.028070.21740.414305
460.0504120.39050.348778
47-0.006122-0.04740.481166
480.037990.29430.384784
490.0628170.48660.314165
500.0021260.01650.493456
510.0652740.50560.307491
520.0111240.08620.46581
530.0239220.18530.426811
540.0107690.08340.4669
550.0018520.01430.4943
560.0179980.13940.444795
570.0197890.15330.439344
58-0.004381-0.03390.48652
590.0141590.10970.456516
60NANANA


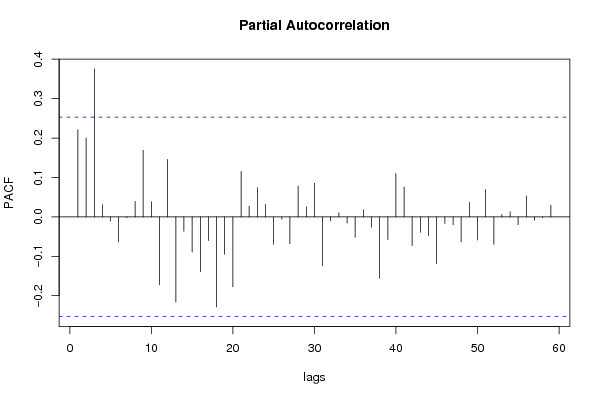
Partial Autocorrelation Function
Time lag kPACF(k)T-STATP-value
10.2211791.71320.045915
20.2003231.55170.062997
30.3752132.90640.002558
40.0310370.24040.405417
5-0.010275-0.07960.468414
6-0.063847-0.49460.31136
7-0.002103-0.01630.493529
80.0389370.30160.381999
90.1688171.30770.09799
100.0386010.2990.382987
11-0.172431-1.33560.093354
120.1456661.12830.131837
13-0.215784-1.67150.04992
14-0.036382-0.28180.389527
15-0.089316-0.69180.245853
16-0.13895-1.07630.14305
17-0.05997-0.46450.321977
18-0.22862-1.77090.04083
19-0.094692-0.73350.23306
20-0.177402-1.37420.087253
210.1152450.89270.187797
220.0271960.21070.416934
230.0739920.57310.284347
240.0314820.24390.404086
25-0.06961-0.53920.295875
26-0.006102-0.04730.481228
27-0.068345-0.52940.29924
280.0781750.60550.273551
290.0252060.19520.422931
300.0853360.6610.255569
31-0.1243-0.96280.16975
32-0.009653-0.07480.470321
330.0108020.08370.466798
34-0.015344-0.11890.452893
35-0.051604-0.39970.34539
360.0184040.14260.443558
37-0.026098-0.20220.420241
38-0.15549-1.20440.116578
39-0.057444-0.4450.328974
400.1092590.84630.200369
410.0757140.58650.279877
42-0.072704-0.56320.287711
43-0.039181-0.30350.381281
44-0.047206-0.36570.357954
45-0.118165-0.91530.181848
46-0.016564-0.12830.449168
47-0.02002-0.15510.438641
48-0.063078-0.48860.313452
490.0363710.28170.389559
50-0.058488-0.4530.326074
510.0691920.5360.296983
52-0.069609-0.53920.295876
530.0062770.04860.480691
540.0128560.09960.460503
55-0.019743-0.15290.439483
560.0528860.40970.34176
57-0.008797-0.06810.472948
58-0.002-0.01550.493844
590.0296640.22980.409525
60NANANA

\begin{tabular}{lllllllll}
\hline
Partial Autocorrelation Function \tabularnewline
Time lag k & PACF(k) & T-STAT & P-value \tabularnewline
1 & 0.221179 & 1.7132 & 0.045915 \tabularnewline
2 & 0.200323 & 1.5517 & 0.062997 \tabularnewline
3 & 0.375213 & 2.9064 & 0.002558 \tabularnewline
4 & 0.031037 & 0.2404 & 0.405417 \tabularnewline
5 & -0.010275 & -0.0796 & 0.468414 \tabularnewline
6 & -0.063847 & -0.4946 & 0.31136 \tabularnewline
7 & -0.002103 & -0.0163 & 0.493529 \tabularnewline
8 & 0.038937 & 0.3016 & 0.381999 \tabularnewline
9 & 0.168817 & 1.3077 & 0.09799 \tabularnewline
10 & 0.038601 & 0.299 & 0.382987 \tabularnewline
11 & -0.172431 & -1.3356 & 0.093354 \tabularnewline
12 & 0.145666 & 1.1283 & 0.131837 \tabularnewline
13 & -0.215784 & -1.6715 & 0.04992 \tabularnewline
14 & -0.036382 & -0.2818 & 0.389527 \tabularnewline
15 & -0.089316 & -0.6918 & 0.245853 \tabularnewline
16 & -0.13895 & -1.0763 & 0.14305 \tabularnewline
17 & -0.05997 & -0.4645 & 0.321977 \tabularnewline
18 & -0.22862 & -1.7709 & 0.04083 \tabularnewline
19 & -0.094692 & -0.7335 & 0.23306 \tabularnewline
20 & -0.177402 & -1.3742 & 0.087253 \tabularnewline
21 & 0.115245 & 0.8927 & 0.187797 \tabularnewline
22 & 0.027196 & 0.2107 & 0.416934 \tabularnewline
23 & 0.073992 & 0.5731 & 0.284347 \tabularnewline
24 & 0.031482 & 0.2439 & 0.404086 \tabularnewline
25 & -0.06961 & -0.5392 & 0.295875 \tabularnewline
26 & -0.006102 & -0.0473 & 0.481228 \tabularnewline
27 & -0.068345 & -0.5294 & 0.29924 \tabularnewline
28 & 0.078175 & 0.6055 & 0.273551 \tabularnewline
29 & 0.025206 & 0.1952 & 0.422931 \tabularnewline
30 & 0.085336 & 0.661 & 0.255569 \tabularnewline
31 & -0.1243 & -0.9628 & 0.16975 \tabularnewline
32 & -0.009653 & -0.0748 & 0.470321 \tabularnewline
33 & 0.010802 & 0.0837 & 0.466798 \tabularnewline
34 & -0.015344 & -0.1189 & 0.452893 \tabularnewline
35 & -0.051604 & -0.3997 & 0.34539 \tabularnewline
36 & 0.018404 & 0.1426 & 0.443558 \tabularnewline
37 & -0.026098 & -0.2022 & 0.420241 \tabularnewline
38 & -0.15549 & -1.2044 & 0.116578 \tabularnewline
39 & -0.057444 & -0.445 & 0.328974 \tabularnewline
40 & 0.109259 & 0.8463 & 0.200369 \tabularnewline
41 & 0.075714 & 0.5865 & 0.279877 \tabularnewline
42 & -0.072704 & -0.5632 & 0.287711 \tabularnewline
43 & -0.039181 & -0.3035 & 0.381281 \tabularnewline
44 & -0.047206 & -0.3657 & 0.357954 \tabularnewline
45 & -0.118165 & -0.9153 & 0.181848 \tabularnewline
46 & -0.016564 & -0.1283 & 0.449168 \tabularnewline
47 & -0.02002 & -0.1551 & 0.438641 \tabularnewline
48 & -0.063078 & -0.4886 & 0.313452 \tabularnewline
49 & 0.036371 & 0.2817 & 0.389559 \tabularnewline
50 & -0.058488 & -0.453 & 0.326074 \tabularnewline
51 & 0.069192 & 0.536 & 0.296983 \tabularnewline
52 & -0.069609 & -0.5392 & 0.295876 \tabularnewline
53 & 0.006277 & 0.0486 & 0.480691 \tabularnewline
54 & 0.012856 & 0.0996 & 0.460503 \tabularnewline
55 & -0.019743 & -0.1529 & 0.439483 \tabularnewline
56 & 0.052886 & 0.4097 & 0.34176 \tabularnewline
57 & -0.008797 & -0.0681 & 0.472948 \tabularnewline
58 & -0.002 & -0.0155 & 0.493844 \tabularnewline
59 & 0.029664 & 0.2298 & 0.409525 \tabularnewline
60 & NA & NA & NA \tabularnewline
\hline
\end{tabular}
%Source: https://freestatistics.org/blog/index.php?pk=35111&T=2

[TABLE]
[ROW][C]Partial Autocorrelation Function[/C][/ROW]
[ROW][C]Time lag k[/C][C]PACF(k)[/C][C]T-STAT[/C][C]P-value[/C][/ROW]
[ROW][C]1[/C][C]0.221179[/C][C]1.7132[/C][C]0.045915[/C][/ROW]
[ROW][C]2[/C][C]0.200323[/C][C]1.5517[/C][C]0.062997[/C][/ROW]
[ROW][C]3[/C][C]0.375213[/C][C]2.9064[/C][C]0.002558[/C][/ROW]
[ROW][C]4[/C][C]0.031037[/C][C]0.2404[/C][C]0.405417[/C][/ROW]
[ROW][C]5[/C][C]-0.010275[/C][C]-0.0796[/C][C]0.468414[/C][/ROW]
[ROW][C]6[/C][C]-0.063847[/C][C]-0.4946[/C][C]0.31136[/C][/ROW]
[ROW][C]7[/C][C]-0.002103[/C][C]-0.0163[/C][C]0.493529[/C][/ROW]
[ROW][C]8[/C][C]0.038937[/C][C]0.3016[/C][C]0.381999[/C][/ROW]
[ROW][C]9[/C][C]0.168817[/C][C]1.3077[/C][C]0.09799[/C][/ROW]
[ROW][C]10[/C][C]0.038601[/C][C]0.299[/C][C]0.382987[/C][/ROW]
[ROW][C]11[/C][C]-0.172431[/C][C]-1.3356[/C][C]0.093354[/C][/ROW]
[ROW][C]12[/C][C]0.145666[/C][C]1.1283[/C][C]0.131837[/C][/ROW]
[ROW][C]13[/C][C]-0.215784[/C][C]-1.6715[/C][C]0.04992[/C][/ROW]
[ROW][C]14[/C][C]-0.036382[/C][C]-0.2818[/C][C]0.389527[/C][/ROW]
[ROW][C]15[/C][C]-0.089316[/C][C]-0.6918[/C][C]0.245853[/C][/ROW]
[ROW][C]16[/C][C]-0.13895[/C][C]-1.0763[/C][C]0.14305[/C][/ROW]
[ROW][C]17[/C][C]-0.05997[/C][C]-0.4645[/C][C]0.321977[/C][/ROW]
[ROW][C]18[/C][C]-0.22862[/C][C]-1.7709[/C][C]0.04083[/C][/ROW]
[ROW][C]19[/C][C]-0.094692[/C][C]-0.7335[/C][C]0.23306[/C][/ROW]
[ROW][C]20[/C][C]-0.177402[/C][C]-1.3742[/C][C]0.087253[/C][/ROW]
[ROW][C]21[/C][C]0.115245[/C][C]0.8927[/C][C]0.187797[/C][/ROW]
[ROW][C]22[/C][C]0.027196[/C][C]0.2107[/C][C]0.416934[/C][/ROW]
[ROW][C]23[/C][C]0.073992[/C][C]0.5731[/C][C]0.284347[/C][/ROW]
[ROW][C]24[/C][C]0.031482[/C][C]0.2439[/C][C]0.404086[/C][/ROW]
[ROW][C]25[/C][C]-0.06961[/C][C]-0.5392[/C][C]0.295875[/C][/ROW]
[ROW][C]26[/C][C]-0.006102[/C][C]-0.0473[/C][C]0.481228[/C][/ROW]
[ROW][C]27[/C][C]-0.068345[/C][C]-0.5294[/C][C]0.29924[/C][/ROW]
[ROW][C]28[/C][C]0.078175[/C][C]0.6055[/C][C]0.273551[/C][/ROW]
[ROW][C]29[/C][C]0.025206[/C][C]0.1952[/C][C]0.422931[/C][/ROW]
[ROW][C]30[/C][C]0.085336[/C][C]0.661[/C][C]0.255569[/C][/ROW]
[ROW][C]31[/C][C]-0.1243[/C][C]-0.9628[/C][C]0.16975[/C][/ROW]
[ROW][C]32[/C][C]-0.009653[/C][C]-0.0748[/C][C]0.470321[/C][/ROW]
[ROW][C]33[/C][C]0.010802[/C][C]0.0837[/C][C]0.466798[/C][/ROW]
[ROW][C]34[/C][C]-0.015344[/C][C]-0.1189[/C][C]0.452893[/C][/ROW]
[ROW][C]35[/C][C]-0.051604[/C][C]-0.3997[/C][C]0.34539[/C][/ROW]
[ROW][C]36[/C][C]0.018404[/C][C]0.1426[/C][C]0.443558[/C][/ROW]
[ROW][C]37[/C][C]-0.026098[/C][C]-0.2022[/C][C]0.420241[/C][/ROW]
[ROW][C]38[/C][C]-0.15549[/C][C]-1.2044[/C][C]0.116578[/C][/ROW]
[ROW][C]39[/C][C]-0.057444[/C][C]-0.445[/C][C]0.328974[/C][/ROW]
[ROW][C]40[/C][C]0.109259[/C][C]0.8463[/C][C]0.200369[/C][/ROW]
[ROW][C]41[/C][C]0.075714[/C][C]0.5865[/C][C]0.279877[/C][/ROW]
[ROW][C]42[/C][C]-0.072704[/C][C]-0.5632[/C][C]0.287711[/C][/ROW]
[ROW][C]43[/C][C]-0.039181[/C][C]-0.3035[/C][C]0.381281[/C][/ROW]
[ROW][C]44[/C][C]-0.047206[/C][C]-0.3657[/C][C]0.357954[/C][/ROW]
[ROW][C]45[/C][C]-0.118165[/C][C]-0.9153[/C][C]0.181848[/C][/ROW]
[ROW][C]46[/C][C]-0.016564[/C][C]-0.1283[/C][C]0.449168[/C][/ROW]
[ROW][C]47[/C][C]-0.02002[/C][C]-0.1551[/C][C]0.438641[/C][/ROW]
[ROW][C]48[/C][C]-0.063078[/C][C]-0.4886[/C][C]0.313452[/C][/ROW]
[ROW][C]49[/C][C]0.036371[/C][C]0.2817[/C][C]0.389559[/C][/ROW]
[ROW][C]50[/C][C]-0.058488[/C][C]-0.453[/C][C]0.326074[/C][/ROW]
[ROW][C]51[/C][C]0.069192[/C][C]0.536[/C][C]0.296983[/C][/ROW]
[ROW][C]52[/C][C]-0.069609[/C][C]-0.5392[/C][C]0.295876[/C][/ROW]
[ROW][C]53[/C][C]0.006277[/C][C]0.0486[/C][C]0.480691[/C][/ROW]
[ROW][C]54[/C][C]0.012856[/C][C]0.0996[/C][C]0.460503[/C][/ROW]
[ROW][C]55[/C][C]-0.019743[/C][C]-0.1529[/C][C]0.439483[/C][/ROW]
[ROW][C]56[/C][C]0.052886[/C][C]0.4097[/C][C]0.34176[/C][/ROW]
[ROW][C]57[/C][C]-0.008797[/C][C]-0.0681[/C][C]0.472948[/C][/ROW]
[ROW][C]58[/C][C]-0.002[/C][C]-0.0155[/C][C]0.493844[/C][/ROW]
[ROW][C]59[/C][C]0.029664[/C][C]0.2298[/C][C]0.409525[/C][/ROW]
[ROW][C]60[/C][C]NA[/C][C]NA[/C][C]NA[/C][/ROW]
[/TABLE]
Source: https://freestatistics.org/blog/index.php?pk=35111&T=2

Globally Unique Identifier (entire table): ba.freestatistics.org/blog/index.php?pk=35111&T=2

As an alternative you can also use a QR Code:  

The GUIDs for individual cells are displayed in the table below:

Partial Autocorrelation Function
Time lag kPACF(k)T-STATP-value
10.2211791.71320.045915
20.2003231.55170.062997
30.3752132.90640.002558
40.0310370.24040.405417
5-0.010275-0.07960.468414
6-0.063847-0.49460.31136
7-0.002103-0.01630.493529
80.0389370.30160.381999
90.1688171.30770.09799
100.0386010.2990.382987
11-0.172431-1.33560.093354
120.1456661.12830.131837
13-0.215784-1.67150.04992
14-0.036382-0.28180.389527
15-0.089316-0.69180.245853
16-0.13895-1.07630.14305
17-0.05997-0.46450.321977
18-0.22862-1.77090.04083
19-0.094692-0.73350.23306
20-0.177402-1.37420.087253
210.1152450.89270.187797
220.0271960.21070.416934
230.0739920.57310.284347
240.0314820.24390.404086
25-0.06961-0.53920.295875
26-0.006102-0.04730.481228
27-0.068345-0.52940.29924
280.0781750.60550.273551
290.0252060.19520.422931
300.0853360.6610.255569
31-0.1243-0.96280.16975
32-0.009653-0.07480.470321
330.0108020.08370.466798
34-0.015344-0.11890.452893
35-0.051604-0.39970.34539
360.0184040.14260.443558
37-0.026098-0.20220.420241
38-0.15549-1.20440.116578
39-0.057444-0.4450.328974
400.1092590.84630.200369
410.0757140.58650.279877
42-0.072704-0.56320.287711
43-0.039181-0.30350.381281
44-0.047206-0.36570.357954
45-0.118165-0.91530.181848
46-0.016564-0.12830.449168
47-0.02002-0.15510.438641
48-0.063078-0.48860.313452
490.0363710.28170.389559
50-0.058488-0.4530.326074
510.0691920.5360.296983
52-0.069609-0.53920.295876
530.0062770.04860.480691
540.0128560.09960.460503
55-0.019743-0.15290.439483
560.0528860.40970.34176
57-0.008797-0.06810.472948
58-0.002-0.01550.493844
590.0296640.22980.409525
60NANANA


Parameters (Session):
par1 = 60 ; par2 = 1.0 ; par3 = 0 ; par4 = 0 ; par5 = 12 ;
Parameters (R input):
par1 = 60 ; par2 = 1.0 ; par3 = 0 ; par4 = 0 ; par5 = 12 ;
R code (references can be found in the software module):
if (par1 == 'Default') {
par1 = 10*log10(length(x))
} else {
par1 <- as.numeric(par1)
}
par2 <- as.numeric(par2)
par3 <- as.numeric(par3)
par4 <- as.numeric(par4)
par5 <- as.numeric(par5)
if (par2 == 0) {
x <- log(x)
} else {
x <- (x ^ par2 - 1) / par2
}
if (par3 > 0) x <- diff(x,lag=1,difference=par3)
if (par4 > 0) x <- diff(x,lag=par5,difference=par4)
bitmap(file='pic1.png')
racf <- acf(x,par1,main='Autocorrelation',xlab='lags',ylab='ACF')
dev.off()
bitmap(file='pic2.png')
rpacf <- pacf(x,par1,main='Partial Autocorrelation',xlab='lags',ylab='PACF')
dev.off()
(myacf <- c(racf$acf))
(mypacf <- c(rpacf$acf))
lengthx <- length(x)
sqrtn <- sqrt(lengthx)
load(file='createtable')
a<-table.start()
a<-table.row.start(a)
a<-table.element(a,'Autocorrelation Function',4,TRUE)
a<-table.row.end(a)
a<-table.row.start(a)
a<-table.element(a,'Time lag k',header=TRUE)
a<-table.element(a,hyperlink('basics.htm','ACF(k)','click here for more information about the Autocorrelation Function'),header=TRUE)
a<-table.element(a,'T-STAT',header=TRUE)
a<-table.element(a,'P-value',header=TRUE)
a<-table.row.end(a)
for (i in 2:(par1+1)) {
a<-table.row.start(a)
a<-table.element(a,i-1,header=TRUE)
a<-table.element(a,round(myacf[i],6))
mytstat <- myacf[i]*sqrtn
a<-table.element(a,round(mytstat,4))
a<-table.element(a,round(1-pt(abs(mytstat),lengthx),6))
a<-table.row.end(a)
}
a<-table.end(a)
table.save(a,file='mytable.tab')
a<-table.start()
a<-table.row.start(a)
a<-table.element(a,'Partial Autocorrelation Function',4,TRUE)
a<-table.row.end(a)
a<-table.row.start(a)
a<-table.element(a,'Time lag k',header=TRUE)
a<-table.element(a,hyperlink('basics.htm','PACF(k)','click here for more information about the Partial Autocorrelation Function'),header=TRUE)
a<-table.element(a,'T-STAT',header=TRUE)
a<-table.element(a,'P-value',header=TRUE)
a<-table.row.end(a)
for (i in 1:par1) {
a<-table.row.start(a)
a<-table.element(a,i,header=TRUE)
a<-table.element(a,round(mypacf[i],6))
mytstat <- mypacf[i]*sqrtn
a<-table.element(a,round(mytstat,4))
a<-table.element(a,round(1-pt(abs(mytstat),lengthx),6))
a<-table.row.end(a)
}
a<-table.end(a)
table.save(a,file='mytable1.tab')