Free Statistics

of Irreproducible Research!

Author's title

Author*The author of this computation has been verified*
R Software Modulerwasp_centraltendency.wasp
Title produced by softwareCentral Tendency
Date of computationFri, 19 Dec 2008 06:17:53 -0700
Cite this page as followsStatistical Computations at FreeStatistics.org, Office for Research Development and Education, URL https://freestatistics.org/blog/index.php?v=date/2008/Dec/19/t1229692712vu2gxtodw7cr8z2.htm/, Retrieved Thu, 16 May 2024 02:44:45 +0000
Statistical Computations at FreeStatistics.org, Office for Research Development and Education, URL https://freestatistics.org/blog/index.php?pk=35106, Retrieved Thu, 16 May 2024 02:44:45 +0000
QR Codes:

Original text written by user:
IsPrivate?No (this computation is public)
User-defined keywords
Estimated Impact154
Family? (F = Feedback message, R = changed R code, M = changed R Module, P = changed Parameters, D = changed Data)
-       [Central Tendency] [Central tendency ...] [2008-12-19 13:17:53] [9ba97de59bb4d2edf0cfeac4ca7d2b73] [Current]
Feedback Forum

Post a new message
Dataseries X:
467037
460070
447988
442867
436087
431328
484015
509673
512927
502831
470984
471067
476049
474605
470439
461251
454724
455626
516847
525192
522975
518585
509239
512238
519164
517009
509933
509127
500857
506971
569323
579714
577992
565464
547344
554788
562325
560854
555332
543599
536662
542722
593530
610763
612613
611324
594167
595454
590865
589379
584428
573100
567456
569028
620735
628884
628232
612117
595404
597141
593408
590072
579799
574205
572775
572942
619567
625809
619916
587625
565742
557274
560576
548854
531673
525919
511038
498662
555362
564591
541657
527070
509846
514258


Summary of computational transaction
Raw Inputview raw input (R code)
Raw Outputview raw output of R engine
Computing time1 seconds
R Server'George Udny Yule' @ 72.249.76.132

\begin{tabular}{lllllllll}
\hline
Summary of computational transaction \tabularnewline
Raw Input & view raw input (R code)  \tabularnewline
Raw Output & view raw output of R engine  \tabularnewline
Computing time & 1 seconds \tabularnewline
R Server & 'George Udny Yule' @ 72.249.76.132 \tabularnewline
\hline
\end{tabular}
%Source: https://freestatistics.org/blog/index.php?pk=35106&T=0

[TABLE]
[ROW][C]Summary of computational transaction[/C][/ROW]
[ROW][C]Raw Input[/C][C]view raw input (R code) [/C][/ROW]
[ROW][C]Raw Output[/C][C]view raw output of R engine [/C][/ROW]
[ROW][C]Computing time[/C][C]1 seconds[/C][/ROW]
[ROW][C]R Server[/C][C]'George Udny Yule' @ 72.249.76.132[/C][/ROW]
[/TABLE]
Source: https://freestatistics.org/blog/index.php?pk=35106&T=0

Globally Unique Identifier (entire table): ba.freestatistics.org/blog/index.php?pk=35106&T=0

As an alternative you can also use a QR Code:  

The GUIDs for individual cells are displayed in the table below:

Summary of computational transaction
Raw Inputview raw input (R code)
Raw Outputview raw output of R engine
Computing time1 seconds
R Server'George Udny Yule' @ 72.249.76.132


Central Tendency - Ungrouped Data
MeasureValueS.E.Value/S.E.
Arithmetic Mean541870.0476190485658.4219666679195.7634568102279
Geometric Mean539356.622085083
Harmonic Mean536784.861334912
Quadratic Mean544316.654950367
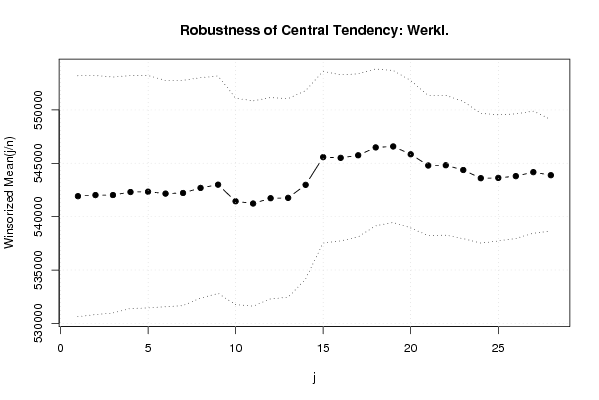
Winsorized Mean ( 1 / 28 )541918.9404761915643.920265708796.018177962006
Winsorized Mean ( 2 / 28 )542022.6785714295597.9389627661296.825399879601
Winsorized Mean ( 3 / 28 )542024.3571428575527.7876330737898.05448275542
Winsorized Mean ( 4 / 28 )542306.1190476195457.2063651329899.3743103637247
Winsorized Mean ( 5 / 28 )542339.0357142865443.3078699941899.6340917448172
Winsorized Mean ( 6 / 28 )542159.755300.9645077327102.275680059569
Winsorized Mean ( 7 / 28 )542216.8333333335276.07693519664102.768939875803
Winsorized Mean ( 8 / 28 )542692.3571428575164.40762236794105.083176392267
Winsorized Mean ( 9 / 28 )542996.755091.31038625516106.651668982098
Winsorized Mean ( 10 / 28 )541439.9642857144837.07816893688111.935334798345
Winsorized Mean ( 11 / 28 )541229.9166666674804.82351572578112.643037750558
Winsorized Mean ( 12 / 28 )541728.2023809524716.04064583247114.869281896388
Winsorized Mean ( 13 / 28 )541760.2380952384651.74204645201116.463946772038
Winsorized Mean ( 14 / 28 )542981.7380952384417.31430806634122.921236803031
Winsorized Mean ( 15 / 28 )545575.4880952384018.7429016914135.757748490359
Winsorized Mean ( 16 / 28 )545509.2023809523891.68502397249140.173009639952
Winsorized Mean ( 17 / 28 )545748.2142857143814.48749983838143.072487276164
Winsorized Mean ( 18 / 28 )546486.8571428573676.02892680726148.662284226772
Winsorized Mean ( 19 / 28 )546577.7857142863558.05323249124153.617090582871
Winsorized Mean ( 20 / 28 )545843.2619047623450.45617345999158.194521090645
Winsorized Mean ( 21 / 28 )544794.5119047623284.18149078256165.884410905363
Winsorized Mean ( 22 / 28 )544817.5595238093275.49017363978166.331611649562
Winsorized Mean ( 23 / 28 )544369.8809523813212.42592867428169.457566661166
Winsorized Mean ( 24 / 28 )543603.5952380953037.69486388819178.95266628008
Winsorized Mean ( 25 / 28 )543631.8690476192952.01034283314184.156491987720
Winsorized Mean ( 26 / 28 )543796.2261904762918.87801307892186.303169832323
Winsorized Mean ( 27 / 28 )544170.3690476192858.18171800804190.390402968104
Winsorized Mean ( 28 / 28 )543882.7023809522613.01179548958208.143990516908
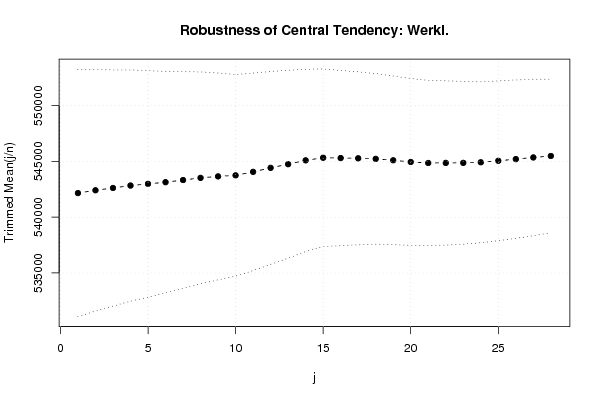
Trimmed Mean ( 1 / 28 )542156.9756097565534.2403331472197.9641184649173
Trimmed Mean ( 2 / 28 )542406.91255406.94009136809100.316797178117
Trimmed Mean ( 3 / 28 )542613.8076923085287.24937978295102.626861098536
Trimmed Mean ( 4 / 28 )542830.9736842115178.17988835180104.830458846224
Trimmed Mean ( 5 / 28 )542979.9189189195074.97719576045106.991597789349
Trimmed Mean ( 6 / 28 )543129.4583333334957.4231358502109.558825916155
Trimmed Mean ( 7 / 28 )543323.44856.17722701788111.882943022994
Trimmed Mean ( 8 / 28 )543518.6764705884741.6170028098114.627283508666
Trimmed Mean ( 9 / 28 )543650.1363636364630.49806661609117.4064060804
Trimmed Mean ( 10 / 28 )543745.4218754512.97456969004120.484929280766
Trimmed Mean ( 11 / 28 )544057.7741935484422.43626750547123.022185348627
Trimmed Mean ( 12 / 28 )544417.6833333334317.58791296176126.093016357338
Trimmed Mean ( 13 / 28 )544742.2758620694206.97197836343129.485596448870
Trimmed Mean ( 14 / 28 )545086.3571428574082.8838116103133.505233627472
Trimmed Mean ( 15 / 28 )545320.2037037043976.87083684594137.122935613418
Trimmed Mean ( 16 / 28 )545292.7115384623921.09689605829139.066369945262
Trimmed Mean ( 17 / 28 )545269.983871.56618263494140.839638089022
Trimmed Mean ( 18 / 28 )545220.753819.66648147434142.740407479124
Trimmed Mean ( 19 / 28 )545092.3043478263775.13814826972144.390028374898
Trimmed Mean ( 20 / 28 )544943.0454545453735.25567090303145.891765776451
Trimmed Mean ( 21 / 28 )544853.0238095243699.14282227850147.291697019127
Trimmed Mean ( 22 / 28 )544858.8753678.10585000352148.13572453318
Trimmed Mean ( 23 / 28 )544863.0263157893643.38679868692149.548498806703
Trimmed Mean ( 24 / 28 )544913.0555555563601.79564717917151.289275942770
Trimmed Mean ( 25 / 28 )545047.8529411773574.98475923415152.461587852458
Trimmed Mean ( 26 / 28 )545196.531253546.29836146324153.736791346864
Trimmed Mean ( 27 / 28 )545347.3333333333501.03536256943155.767445014637
Trimmed Mean ( 28 / 28 )545478.1071428573439.67358306576158.584265038509
Median548099
Midrange530106
Midmean - Weighted Average at Xnp544024.790697674
Midmean - Weighted Average at X(n+1)p544853.023809524
Midmean - Empirical Distribution Function544024.790697674
Midmean - Empirical Distribution Function - Averaging544853.023809524
Midmean - Empirical Distribution Function - Interpolation544853.023809524
Midmean - Closest Observation544024.790697674
Midmean - True Basic - Statistics Graphics Toolkit544853.023809524
Midmean - MS Excel (old versions)544943.045454545
Number of observations84

\begin{tabular}{lllllllll}
\hline
Central Tendency - Ungrouped Data \tabularnewline
Measure & Value & S.E. & Value/S.E. \tabularnewline
Arithmetic Mean & 541870.047619048 & 5658.42196666791 & 95.7634568102279 \tabularnewline
Geometric Mean & 539356.622085083 &  &  \tabularnewline
Harmonic Mean & 536784.861334912 &  &  \tabularnewline
Quadratic Mean & 544316.654950367 &  &  \tabularnewline
Winsorized Mean ( 1 / 28 ) & 541918.940476191 & 5643.9202657087 & 96.018177962006 \tabularnewline
Winsorized Mean ( 2 / 28 ) & 542022.678571429 & 5597.93896276612 & 96.825399879601 \tabularnewline
Winsorized Mean ( 3 / 28 ) & 542024.357142857 & 5527.78763307378 & 98.05448275542 \tabularnewline
Winsorized Mean ( 4 / 28 ) & 542306.119047619 & 5457.20636513298 & 99.3743103637247 \tabularnewline
Winsorized Mean ( 5 / 28 ) & 542339.035714286 & 5443.30786999418 & 99.6340917448172 \tabularnewline
Winsorized Mean ( 6 / 28 ) & 542159.75 & 5300.9645077327 & 102.275680059569 \tabularnewline
Winsorized Mean ( 7 / 28 ) & 542216.833333333 & 5276.07693519664 & 102.768939875803 \tabularnewline
Winsorized Mean ( 8 / 28 ) & 542692.357142857 & 5164.40762236794 & 105.083176392267 \tabularnewline
Winsorized Mean ( 9 / 28 ) & 542996.75 & 5091.31038625516 & 106.651668982098 \tabularnewline
Winsorized Mean ( 10 / 28 ) & 541439.964285714 & 4837.07816893688 & 111.935334798345 \tabularnewline
Winsorized Mean ( 11 / 28 ) & 541229.916666667 & 4804.82351572578 & 112.643037750558 \tabularnewline
Winsorized Mean ( 12 / 28 ) & 541728.202380952 & 4716.04064583247 & 114.869281896388 \tabularnewline
Winsorized Mean ( 13 / 28 ) & 541760.238095238 & 4651.74204645201 & 116.463946772038 \tabularnewline
Winsorized Mean ( 14 / 28 ) & 542981.738095238 & 4417.31430806634 & 122.921236803031 \tabularnewline
Winsorized Mean ( 15 / 28 ) & 545575.488095238 & 4018.7429016914 & 135.757748490359 \tabularnewline
Winsorized Mean ( 16 / 28 ) & 545509.202380952 & 3891.68502397249 & 140.173009639952 \tabularnewline
Winsorized Mean ( 17 / 28 ) & 545748.214285714 & 3814.48749983838 & 143.072487276164 \tabularnewline
Winsorized Mean ( 18 / 28 ) & 546486.857142857 & 3676.02892680726 & 148.662284226772 \tabularnewline
Winsorized Mean ( 19 / 28 ) & 546577.785714286 & 3558.05323249124 & 153.617090582871 \tabularnewline
Winsorized Mean ( 20 / 28 ) & 545843.261904762 & 3450.45617345999 & 158.194521090645 \tabularnewline
Winsorized Mean ( 21 / 28 ) & 544794.511904762 & 3284.18149078256 & 165.884410905363 \tabularnewline
Winsorized Mean ( 22 / 28 ) & 544817.559523809 & 3275.49017363978 & 166.331611649562 \tabularnewline
Winsorized Mean ( 23 / 28 ) & 544369.880952381 & 3212.42592867428 & 169.457566661166 \tabularnewline
Winsorized Mean ( 24 / 28 ) & 543603.595238095 & 3037.69486388819 & 178.95266628008 \tabularnewline
Winsorized Mean ( 25 / 28 ) & 543631.869047619 & 2952.01034283314 & 184.156491987720 \tabularnewline
Winsorized Mean ( 26 / 28 ) & 543796.226190476 & 2918.87801307892 & 186.303169832323 \tabularnewline
Winsorized Mean ( 27 / 28 ) & 544170.369047619 & 2858.18171800804 & 190.390402968104 \tabularnewline
Winsorized Mean ( 28 / 28 ) & 543882.702380952 & 2613.01179548958 & 208.143990516908 \tabularnewline
Trimmed Mean ( 1 / 28 ) & 542156.975609756 & 5534.24033314721 & 97.9641184649173 \tabularnewline
Trimmed Mean ( 2 / 28 ) & 542406.9125 & 5406.94009136809 & 100.316797178117 \tabularnewline
Trimmed Mean ( 3 / 28 ) & 542613.807692308 & 5287.24937978295 & 102.626861098536 \tabularnewline
Trimmed Mean ( 4 / 28 ) & 542830.973684211 & 5178.17988835180 & 104.830458846224 \tabularnewline
Trimmed Mean ( 5 / 28 ) & 542979.918918919 & 5074.97719576045 & 106.991597789349 \tabularnewline
Trimmed Mean ( 6 / 28 ) & 543129.458333333 & 4957.4231358502 & 109.558825916155 \tabularnewline
Trimmed Mean ( 7 / 28 ) & 543323.4 & 4856.17722701788 & 111.882943022994 \tabularnewline
Trimmed Mean ( 8 / 28 ) & 543518.676470588 & 4741.6170028098 & 114.627283508666 \tabularnewline
Trimmed Mean ( 9 / 28 ) & 543650.136363636 & 4630.49806661609 & 117.4064060804 \tabularnewline
Trimmed Mean ( 10 / 28 ) & 543745.421875 & 4512.97456969004 & 120.484929280766 \tabularnewline
Trimmed Mean ( 11 / 28 ) & 544057.774193548 & 4422.43626750547 & 123.022185348627 \tabularnewline
Trimmed Mean ( 12 / 28 ) & 544417.683333333 & 4317.58791296176 & 126.093016357338 \tabularnewline
Trimmed Mean ( 13 / 28 ) & 544742.275862069 & 4206.97197836343 & 129.485596448870 \tabularnewline
Trimmed Mean ( 14 / 28 ) & 545086.357142857 & 4082.8838116103 & 133.505233627472 \tabularnewline
Trimmed Mean ( 15 / 28 ) & 545320.203703704 & 3976.87083684594 & 137.122935613418 \tabularnewline
Trimmed Mean ( 16 / 28 ) & 545292.711538462 & 3921.09689605829 & 139.066369945262 \tabularnewline
Trimmed Mean ( 17 / 28 ) & 545269.98 & 3871.56618263494 & 140.839638089022 \tabularnewline
Trimmed Mean ( 18 / 28 ) & 545220.75 & 3819.66648147434 & 142.740407479124 \tabularnewline
Trimmed Mean ( 19 / 28 ) & 545092.304347826 & 3775.13814826972 & 144.390028374898 \tabularnewline
Trimmed Mean ( 20 / 28 ) & 544943.045454545 & 3735.25567090303 & 145.891765776451 \tabularnewline
Trimmed Mean ( 21 / 28 ) & 544853.023809524 & 3699.14282227850 & 147.291697019127 \tabularnewline
Trimmed Mean ( 22 / 28 ) & 544858.875 & 3678.10585000352 & 148.13572453318 \tabularnewline
Trimmed Mean ( 23 / 28 ) & 544863.026315789 & 3643.38679868692 & 149.548498806703 \tabularnewline
Trimmed Mean ( 24 / 28 ) & 544913.055555556 & 3601.79564717917 & 151.289275942770 \tabularnewline
Trimmed Mean ( 25 / 28 ) & 545047.852941177 & 3574.98475923415 & 152.461587852458 \tabularnewline
Trimmed Mean ( 26 / 28 ) & 545196.53125 & 3546.29836146324 & 153.736791346864 \tabularnewline
Trimmed Mean ( 27 / 28 ) & 545347.333333333 & 3501.03536256943 & 155.767445014637 \tabularnewline
Trimmed Mean ( 28 / 28 ) & 545478.107142857 & 3439.67358306576 & 158.584265038509 \tabularnewline
Median & 548099 &  &  \tabularnewline
Midrange & 530106 &  &  \tabularnewline
Midmean - Weighted Average at Xnp & 544024.790697674 &  &  \tabularnewline
Midmean - Weighted Average at X(n+1)p & 544853.023809524 &  &  \tabularnewline
Midmean - Empirical Distribution Function & 544024.790697674 &  &  \tabularnewline
Midmean - Empirical Distribution Function - Averaging & 544853.023809524 &  &  \tabularnewline
Midmean - Empirical Distribution Function - Interpolation & 544853.023809524 &  &  \tabularnewline
Midmean - Closest Observation & 544024.790697674 &  &  \tabularnewline
Midmean - True Basic - Statistics Graphics Toolkit & 544853.023809524 &  &  \tabularnewline
Midmean - MS Excel (old versions) & 544943.045454545 &  &  \tabularnewline
Number of observations & 84 &  &  \tabularnewline
\hline
\end{tabular}
%Source: https://freestatistics.org/blog/index.php?pk=35106&T=1

[TABLE]
[ROW][C]Central Tendency - Ungrouped Data[/C][/ROW]
[ROW][C]Measure[/C][C]Value[/C][C]S.E.[/C][C]Value/S.E.[/C][/ROW]
[ROW][C]Arithmetic Mean[/C][C]541870.047619048[/C][C]5658.42196666791[/C][C]95.7634568102279[/C][/ROW]
[ROW][C]Geometric Mean[/C][C]539356.622085083[/C][C][/C][C][/C][/ROW]
[ROW][C]Harmonic Mean[/C][C]536784.861334912[/C][C][/C][C][/C][/ROW]
[ROW][C]Quadratic Mean[/C][C]544316.654950367[/C][C][/C][C][/C][/ROW]
[ROW][C]Winsorized Mean ( 1 / 28 )[/C][C]541918.940476191[/C][C]5643.9202657087[/C][C]96.018177962006[/C][/ROW]
[ROW][C]Winsorized Mean ( 2 / 28 )[/C][C]542022.678571429[/C][C]5597.93896276612[/C][C]96.825399879601[/C][/ROW]
[ROW][C]Winsorized Mean ( 3 / 28 )[/C][C]542024.357142857[/C][C]5527.78763307378[/C][C]98.05448275542[/C][/ROW]
[ROW][C]Winsorized Mean ( 4 / 28 )[/C][C]542306.119047619[/C][C]5457.20636513298[/C][C]99.3743103637247[/C][/ROW]
[ROW][C]Winsorized Mean ( 5 / 28 )[/C][C]542339.035714286[/C][C]5443.30786999418[/C][C]99.6340917448172[/C][/ROW]
[ROW][C]Winsorized Mean ( 6 / 28 )[/C][C]542159.75[/C][C]5300.9645077327[/C][C]102.275680059569[/C][/ROW]
[ROW][C]Winsorized Mean ( 7 / 28 )[/C][C]542216.833333333[/C][C]5276.07693519664[/C][C]102.768939875803[/C][/ROW]
[ROW][C]Winsorized Mean ( 8 / 28 )[/C][C]542692.357142857[/C][C]5164.40762236794[/C][C]105.083176392267[/C][/ROW]
[ROW][C]Winsorized Mean ( 9 / 28 )[/C][C]542996.75[/C][C]5091.31038625516[/C][C]106.651668982098[/C][/ROW]
[ROW][C]Winsorized Mean ( 10 / 28 )[/C][C]541439.964285714[/C][C]4837.07816893688[/C][C]111.935334798345[/C][/ROW]
[ROW][C]Winsorized Mean ( 11 / 28 )[/C][C]541229.916666667[/C][C]4804.82351572578[/C][C]112.643037750558[/C][/ROW]
[ROW][C]Winsorized Mean ( 12 / 28 )[/C][C]541728.202380952[/C][C]4716.04064583247[/C][C]114.869281896388[/C][/ROW]
[ROW][C]Winsorized Mean ( 13 / 28 )[/C][C]541760.238095238[/C][C]4651.74204645201[/C][C]116.463946772038[/C][/ROW]
[ROW][C]Winsorized Mean ( 14 / 28 )[/C][C]542981.738095238[/C][C]4417.31430806634[/C][C]122.921236803031[/C][/ROW]
[ROW][C]Winsorized Mean ( 15 / 28 )[/C][C]545575.488095238[/C][C]4018.7429016914[/C][C]135.757748490359[/C][/ROW]
[ROW][C]Winsorized Mean ( 16 / 28 )[/C][C]545509.202380952[/C][C]3891.68502397249[/C][C]140.173009639952[/C][/ROW]
[ROW][C]Winsorized Mean ( 17 / 28 )[/C][C]545748.214285714[/C][C]3814.48749983838[/C][C]143.072487276164[/C][/ROW]
[ROW][C]Winsorized Mean ( 18 / 28 )[/C][C]546486.857142857[/C][C]3676.02892680726[/C][C]148.662284226772[/C][/ROW]
[ROW][C]Winsorized Mean ( 19 / 28 )[/C][C]546577.785714286[/C][C]3558.05323249124[/C][C]153.617090582871[/C][/ROW]
[ROW][C]Winsorized Mean ( 20 / 28 )[/C][C]545843.261904762[/C][C]3450.45617345999[/C][C]158.194521090645[/C][/ROW]
[ROW][C]Winsorized Mean ( 21 / 28 )[/C][C]544794.511904762[/C][C]3284.18149078256[/C][C]165.884410905363[/C][/ROW]
[ROW][C]Winsorized Mean ( 22 / 28 )[/C][C]544817.559523809[/C][C]3275.49017363978[/C][C]166.331611649562[/C][/ROW]
[ROW][C]Winsorized Mean ( 23 / 28 )[/C][C]544369.880952381[/C][C]3212.42592867428[/C][C]169.457566661166[/C][/ROW]
[ROW][C]Winsorized Mean ( 24 / 28 )[/C][C]543603.595238095[/C][C]3037.69486388819[/C][C]178.95266628008[/C][/ROW]
[ROW][C]Winsorized Mean ( 25 / 28 )[/C][C]543631.869047619[/C][C]2952.01034283314[/C][C]184.156491987720[/C][/ROW]
[ROW][C]Winsorized Mean ( 26 / 28 )[/C][C]543796.226190476[/C][C]2918.87801307892[/C][C]186.303169832323[/C][/ROW]
[ROW][C]Winsorized Mean ( 27 / 28 )[/C][C]544170.369047619[/C][C]2858.18171800804[/C][C]190.390402968104[/C][/ROW]
[ROW][C]Winsorized Mean ( 28 / 28 )[/C][C]543882.702380952[/C][C]2613.01179548958[/C][C]208.143990516908[/C][/ROW]
[ROW][C]Trimmed Mean ( 1 / 28 )[/C][C]542156.975609756[/C][C]5534.24033314721[/C][C]97.9641184649173[/C][/ROW]
[ROW][C]Trimmed Mean ( 2 / 28 )[/C][C]542406.9125[/C][C]5406.94009136809[/C][C]100.316797178117[/C][/ROW]
[ROW][C]Trimmed Mean ( 3 / 28 )[/C][C]542613.807692308[/C][C]5287.24937978295[/C][C]102.626861098536[/C][/ROW]
[ROW][C]Trimmed Mean ( 4 / 28 )[/C][C]542830.973684211[/C][C]5178.17988835180[/C][C]104.830458846224[/C][/ROW]
[ROW][C]Trimmed Mean ( 5 / 28 )[/C][C]542979.918918919[/C][C]5074.97719576045[/C][C]106.991597789349[/C][/ROW]
[ROW][C]Trimmed Mean ( 6 / 28 )[/C][C]543129.458333333[/C][C]4957.4231358502[/C][C]109.558825916155[/C][/ROW]
[ROW][C]Trimmed Mean ( 7 / 28 )[/C][C]543323.4[/C][C]4856.17722701788[/C][C]111.882943022994[/C][/ROW]
[ROW][C]Trimmed Mean ( 8 / 28 )[/C][C]543518.676470588[/C][C]4741.6170028098[/C][C]114.627283508666[/C][/ROW]
[ROW][C]Trimmed Mean ( 9 / 28 )[/C][C]543650.136363636[/C][C]4630.49806661609[/C][C]117.4064060804[/C][/ROW]
[ROW][C]Trimmed Mean ( 10 / 28 )[/C][C]543745.421875[/C][C]4512.97456969004[/C][C]120.484929280766[/C][/ROW]
[ROW][C]Trimmed Mean ( 11 / 28 )[/C][C]544057.774193548[/C][C]4422.43626750547[/C][C]123.022185348627[/C][/ROW]
[ROW][C]Trimmed Mean ( 12 / 28 )[/C][C]544417.683333333[/C][C]4317.58791296176[/C][C]126.093016357338[/C][/ROW]
[ROW][C]Trimmed Mean ( 13 / 28 )[/C][C]544742.275862069[/C][C]4206.97197836343[/C][C]129.485596448870[/C][/ROW]
[ROW][C]Trimmed Mean ( 14 / 28 )[/C][C]545086.357142857[/C][C]4082.8838116103[/C][C]133.505233627472[/C][/ROW]
[ROW][C]Trimmed Mean ( 15 / 28 )[/C][C]545320.203703704[/C][C]3976.87083684594[/C][C]137.122935613418[/C][/ROW]
[ROW][C]Trimmed Mean ( 16 / 28 )[/C][C]545292.711538462[/C][C]3921.09689605829[/C][C]139.066369945262[/C][/ROW]
[ROW][C]Trimmed Mean ( 17 / 28 )[/C][C]545269.98[/C][C]3871.56618263494[/C][C]140.839638089022[/C][/ROW]
[ROW][C]Trimmed Mean ( 18 / 28 )[/C][C]545220.75[/C][C]3819.66648147434[/C][C]142.740407479124[/C][/ROW]
[ROW][C]Trimmed Mean ( 19 / 28 )[/C][C]545092.304347826[/C][C]3775.13814826972[/C][C]144.390028374898[/C][/ROW]
[ROW][C]Trimmed Mean ( 20 / 28 )[/C][C]544943.045454545[/C][C]3735.25567090303[/C][C]145.891765776451[/C][/ROW]
[ROW][C]Trimmed Mean ( 21 / 28 )[/C][C]544853.023809524[/C][C]3699.14282227850[/C][C]147.291697019127[/C][/ROW]
[ROW][C]Trimmed Mean ( 22 / 28 )[/C][C]544858.875[/C][C]3678.10585000352[/C][C]148.13572453318[/C][/ROW]
[ROW][C]Trimmed Mean ( 23 / 28 )[/C][C]544863.026315789[/C][C]3643.38679868692[/C][C]149.548498806703[/C][/ROW]
[ROW][C]Trimmed Mean ( 24 / 28 )[/C][C]544913.055555556[/C][C]3601.79564717917[/C][C]151.289275942770[/C][/ROW]
[ROW][C]Trimmed Mean ( 25 / 28 )[/C][C]545047.852941177[/C][C]3574.98475923415[/C][C]152.461587852458[/C][/ROW]
[ROW][C]Trimmed Mean ( 26 / 28 )[/C][C]545196.53125[/C][C]3546.29836146324[/C][C]153.736791346864[/C][/ROW]
[ROW][C]Trimmed Mean ( 27 / 28 )[/C][C]545347.333333333[/C][C]3501.03536256943[/C][C]155.767445014637[/C][/ROW]
[ROW][C]Trimmed Mean ( 28 / 28 )[/C][C]545478.107142857[/C][C]3439.67358306576[/C][C]158.584265038509[/C][/ROW]
[ROW][C]Median[/C][C]548099[/C][C][/C][C][/C][/ROW]
[ROW][C]Midrange[/C][C]530106[/C][C][/C][C][/C][/ROW]
[ROW][C]Midmean - Weighted Average at Xnp[/C][C]544024.790697674[/C][C][/C][C][/C][/ROW]
[ROW][C]Midmean - Weighted Average at X(n+1)p[/C][C]544853.023809524[/C][C][/C][C][/C][/ROW]
[ROW][C]Midmean - Empirical Distribution Function[/C][C]544024.790697674[/C][C][/C][C][/C][/ROW]
[ROW][C]Midmean - Empirical Distribution Function - Averaging[/C][C]544853.023809524[/C][C][/C][C][/C][/ROW]
[ROW][C]Midmean - Empirical Distribution Function - Interpolation[/C][C]544853.023809524[/C][C][/C][C][/C][/ROW]
[ROW][C]Midmean - Closest Observation[/C][C]544024.790697674[/C][C][/C][C][/C][/ROW]
[ROW][C]Midmean - True Basic - Statistics Graphics Toolkit[/C][C]544853.023809524[/C][C][/C][C][/C][/ROW]
[ROW][C]Midmean - MS Excel (old versions)[/C][C]544943.045454545[/C][C][/C][C][/C][/ROW]
[ROW][C]Number of observations[/C][C]84[/C][C][/C][C][/C][/ROW]
[/TABLE]
Source: https://freestatistics.org/blog/index.php?pk=35106&T=1

Globally Unique Identifier (entire table): ba.freestatistics.org/blog/index.php?pk=35106&T=1

As an alternative you can also use a QR Code:  

The GUIDs for individual cells are displayed in the table below:

Central Tendency - Ungrouped Data
MeasureValueS.E.Value/S.E.
Arithmetic Mean541870.0476190485658.4219666679195.7634568102279
Geometric Mean539356.622085083
Harmonic Mean536784.861334912
Quadratic Mean544316.654950367
Winsorized Mean ( 1 / 28 )541918.9404761915643.920265708796.018177962006
Winsorized Mean ( 2 / 28 )542022.6785714295597.9389627661296.825399879601
Winsorized Mean ( 3 / 28 )542024.3571428575527.7876330737898.05448275542
Winsorized Mean ( 4 / 28 )542306.1190476195457.2063651329899.3743103637247
Winsorized Mean ( 5 / 28 )542339.0357142865443.3078699941899.6340917448172
Winsorized Mean ( 6 / 28 )542159.755300.9645077327102.275680059569
Winsorized Mean ( 7 / 28 )542216.8333333335276.07693519664102.768939875803
Winsorized Mean ( 8 / 28 )542692.3571428575164.40762236794105.083176392267
Winsorized Mean ( 9 / 28 )542996.755091.31038625516106.651668982098
Winsorized Mean ( 10 / 28 )541439.9642857144837.07816893688111.935334798345
Winsorized Mean ( 11 / 28 )541229.9166666674804.82351572578112.643037750558
Winsorized Mean ( 12 / 28 )541728.2023809524716.04064583247114.869281896388
Winsorized Mean ( 13 / 28 )541760.2380952384651.74204645201116.463946772038
Winsorized Mean ( 14 / 28 )542981.7380952384417.31430806634122.921236803031
Winsorized Mean ( 15 / 28 )545575.4880952384018.7429016914135.757748490359
Winsorized Mean ( 16 / 28 )545509.2023809523891.68502397249140.173009639952
Winsorized Mean ( 17 / 28 )545748.2142857143814.48749983838143.072487276164
Winsorized Mean ( 18 / 28 )546486.8571428573676.02892680726148.662284226772
Winsorized Mean ( 19 / 28 )546577.7857142863558.05323249124153.617090582871
Winsorized Mean ( 20 / 28 )545843.2619047623450.45617345999158.194521090645
Winsorized Mean ( 21 / 28 )544794.5119047623284.18149078256165.884410905363
Winsorized Mean ( 22 / 28 )544817.5595238093275.49017363978166.331611649562
Winsorized Mean ( 23 / 28 )544369.8809523813212.42592867428169.457566661166
Winsorized Mean ( 24 / 28 )543603.5952380953037.69486388819178.95266628008
Winsorized Mean ( 25 / 28 )543631.8690476192952.01034283314184.156491987720
Winsorized Mean ( 26 / 28 )543796.2261904762918.87801307892186.303169832323
Winsorized Mean ( 27 / 28 )544170.3690476192858.18171800804190.390402968104
Winsorized Mean ( 28 / 28 )543882.7023809522613.01179548958208.143990516908
Trimmed Mean ( 1 / 28 )542156.9756097565534.2403331472197.9641184649173
Trimmed Mean ( 2 / 28 )542406.91255406.94009136809100.316797178117
Trimmed Mean ( 3 / 28 )542613.8076923085287.24937978295102.626861098536
Trimmed Mean ( 4 / 28 )542830.9736842115178.17988835180104.830458846224
Trimmed Mean ( 5 / 28 )542979.9189189195074.97719576045106.991597789349
Trimmed Mean ( 6 / 28 )543129.4583333334957.4231358502109.558825916155
Trimmed Mean ( 7 / 28 )543323.44856.17722701788111.882943022994
Trimmed Mean ( 8 / 28 )543518.6764705884741.6170028098114.627283508666
Trimmed Mean ( 9 / 28 )543650.1363636364630.49806661609117.4064060804
Trimmed Mean ( 10 / 28 )543745.4218754512.97456969004120.484929280766
Trimmed Mean ( 11 / 28 )544057.7741935484422.43626750547123.022185348627
Trimmed Mean ( 12 / 28 )544417.6833333334317.58791296176126.093016357338
Trimmed Mean ( 13 / 28 )544742.2758620694206.97197836343129.485596448870
Trimmed Mean ( 14 / 28 )545086.3571428574082.8838116103133.505233627472
Trimmed Mean ( 15 / 28 )545320.2037037043976.87083684594137.122935613418
Trimmed Mean ( 16 / 28 )545292.7115384623921.09689605829139.066369945262
Trimmed Mean ( 17 / 28 )545269.983871.56618263494140.839638089022
Trimmed Mean ( 18 / 28 )545220.753819.66648147434142.740407479124
Trimmed Mean ( 19 / 28 )545092.3043478263775.13814826972144.390028374898
Trimmed Mean ( 20 / 28 )544943.0454545453735.25567090303145.891765776451
Trimmed Mean ( 21 / 28 )544853.0238095243699.14282227850147.291697019127
Trimmed Mean ( 22 / 28 )544858.8753678.10585000352148.13572453318
Trimmed Mean ( 23 / 28 )544863.0263157893643.38679868692149.548498806703
Trimmed Mean ( 24 / 28 )544913.0555555563601.79564717917151.289275942770
Trimmed Mean ( 25 / 28 )545047.8529411773574.98475923415152.461587852458
Trimmed Mean ( 26 / 28 )545196.531253546.29836146324153.736791346864
Trimmed Mean ( 27 / 28 )545347.3333333333501.03536256943155.767445014637
Trimmed Mean ( 28 / 28 )545478.1071428573439.67358306576158.584265038509
Median548099
Midrange530106
Midmean - Weighted Average at Xnp544024.790697674
Midmean - Weighted Average at X(n+1)p544853.023809524
Midmean - Empirical Distribution Function544024.790697674
Midmean - Empirical Distribution Function - Averaging544853.023809524
Midmean - Empirical Distribution Function - Interpolation544853.023809524
Midmean - Closest Observation544024.790697674
Midmean - True Basic - Statistics Graphics Toolkit544853.023809524
Midmean - MS Excel (old versions)544943.045454545
Number of observations84


Parameters (Session):
Parameters (R input):
R code (references can be found in the software module):
geomean <- function(x) {
return(exp(mean(log(x))))
}
harmean <- function(x) {
return(1/mean(1/x))
}
quamean <- function(x) {
return(sqrt(mean(x*x)))
}
winmean <- function(x) {
x <-sort(x[!is.na(x)])
n<-length(x)
denom <- 3
nodenom <- n/denom
if (nodenom>40) denom <- n/40
sqrtn = sqrt(n)
roundnodenom = floor(nodenom)
win <- array(NA,dim=c(roundnodenom,2))
for (j in 1:roundnodenom) {
win[j,1] <- (j*x[j+1]+sum(x[(j+1):(n-j)])+j*x[n-j])/n
win[j,2] <- sd(c(rep(x[j+1],j),x[(j+1):(n-j)],rep(x[n-j],j)))/sqrtn
}
return(win)
}
trimean <- function(x) {
x <-sort(x[!is.na(x)])
n<-length(x)
denom <- 3
nodenom <- n/denom
if (nodenom>40) denom <- n/40
sqrtn = sqrt(n)
roundnodenom = floor(nodenom)
tri <- array(NA,dim=c(roundnodenom,2))
for (j in 1:roundnodenom) {
tri[j,1] <- mean(x,trim=j/n)
tri[j,2] <- sd(x[(j+1):(n-j)]) / sqrt(n-j*2)
}
return(tri)
}
midrange <- function(x) {
return((max(x)+min(x))/2)
}
q1 <- function(data,n,p,i,f) {
np <- n*p;
i <<- floor(np)
f <<- np - i
qvalue <- (1-f)*data[i] + f*data[i+1]
}
q2 <- function(data,n,p,i,f) {
np <- (n+1)*p
i <<- floor(np)
f <<- np - i
qvalue <- (1-f)*data[i] + f*data[i+1]
}
q3 <- function(data,n,p,i,f) {
np <- n*p
i <<- floor(np)
f <<- np - i
if (f==0) {
qvalue <- data[i]
} else {
qvalue <- data[i+1]
}
}
q4 <- function(data,n,p,i,f) {
np <- n*p
i <<- floor(np)
f <<- np - i
if (f==0) {
qvalue <- (data[i]+data[i+1])/2
} else {
qvalue <- data[i+1]
}
}
q5 <- function(data,n,p,i,f) {
np <- (n-1)*p
i <<- floor(np)
f <<- np - i
if (f==0) {
qvalue <- data[i+1]
} else {
qvalue <- data[i+1] + f*(data[i+2]-data[i+1])
}
}
q6 <- function(data,n,p,i,f) {
np <- n*p+0.5
i <<- floor(np)
f <<- np - i
qvalue <- data[i]
}
q7 <- function(data,n,p,i,f) {
np <- (n+1)*p
i <<- floor(np)
f <<- np - i
if (f==0) {
qvalue <- data[i]
} else {
qvalue <- f*data[i] + (1-f)*data[i+1]
}
}
q8 <- function(data,n,p,i,f) {
np <- (n+1)*p
i <<- floor(np)
f <<- np - i
if (f==0) {
qvalue <- data[i]
} else {
if (f == 0.5) {
qvalue <- (data[i]+data[i+1])/2
} else {
if (f < 0.5) {
qvalue <- data[i]
} else {
qvalue <- data[i+1]
}
}
}
}
midmean <- function(x,def) {
x <-sort(x[!is.na(x)])
n<-length(x)
if (def==1) {
qvalue1 <- q1(x,n,0.25,i,f)
qvalue3 <- q1(x,n,0.75,i,f)
}
if (def==2) {
qvalue1 <- q2(x,n,0.25,i,f)
qvalue3 <- q2(x,n,0.75,i,f)
}
if (def==3) {
qvalue1 <- q3(x,n,0.25,i,f)
qvalue3 <- q3(x,n,0.75,i,f)
}
if (def==4) {
qvalue1 <- q4(x,n,0.25,i,f)
qvalue3 <- q4(x,n,0.75,i,f)
}
if (def==5) {
qvalue1 <- q5(x,n,0.25,i,f)
qvalue3 <- q5(x,n,0.75,i,f)
}
if (def==6) {
qvalue1 <- q6(x,n,0.25,i,f)
qvalue3 <- q6(x,n,0.75,i,f)
}
if (def==7) {
qvalue1 <- q7(x,n,0.25,i,f)
qvalue3 <- q7(x,n,0.75,i,f)
}
if (def==8) {
qvalue1 <- q8(x,n,0.25,i,f)
qvalue3 <- q8(x,n,0.75,i,f)
}
midm <- 0
myn <- 0
roundno4 <- round(n/4)
round3no4 <- round(3*n/4)
for (i in 1:n) {
if ((x[i]>=qvalue1) & (x[i]<=qvalue3)){
midm = midm + x[i]
myn = myn + 1
}
}
midm = midm / myn
return(midm)
}
(arm <- mean(x))
sqrtn <- sqrt(length(x))
(armse <- sd(x) / sqrtn)
(armose <- arm / armse)
(geo <- geomean(x))
(har <- harmean(x))
(qua <- quamean(x))
(win <- winmean(x))
(tri <- trimean(x))
(midr <- midrange(x))
midm <- array(NA,dim=8)
for (j in 1:8) midm[j] <- midmean(x,j)
midm
bitmap(file='test1.png')
lb <- win[,1] - 2*win[,2]
ub <- win[,1] + 2*win[,2]
if ((ylimmin == '') | (ylimmax == '')) plot(win[,1],type='b',main=main, xlab='j', pch=19, ylab='Winsorized Mean(j/n)', ylim=c(min(lb),max(ub))) else plot(win[,1],type='l',main=main, xlab='j', pch=19, ylab='Winsorized Mean(j/n)', ylim=c(ylimmin,ylimmax))
lines(ub,lty=3)
lines(lb,lty=3)
grid()
dev.off()
bitmap(file='test2.png')
lb <- tri[,1] - 2*tri[,2]
ub <- tri[,1] + 2*tri[,2]
if ((ylimmin == '') | (ylimmax == '')) plot(tri[,1],type='b',main=main, xlab='j', pch=19, ylab='Trimmed Mean(j/n)', ylim=c(min(lb),max(ub))) else plot(tri[,1],type='l',main=main, xlab='j', pch=19, ylab='Trimmed Mean(j/n)', ylim=c(ylimmin,ylimmax))
lines(ub,lty=3)
lines(lb,lty=3)
grid()
dev.off()
load(file='createtable')
a<-table.start()
a<-table.row.start(a)
a<-table.element(a,'Central Tendency - Ungrouped Data',4,TRUE)
a<-table.row.end(a)
a<-table.row.start(a)
a<-table.element(a,'Measure',header=TRUE)
a<-table.element(a,'Value',header=TRUE)
a<-table.element(a,'S.E.',header=TRUE)
a<-table.element(a,'Value/S.E.',header=TRUE)
a<-table.row.end(a)
a<-table.row.start(a)
a<-table.element(a,hyperlink('arithmetic_mean.htm', 'Arithmetic Mean', 'click to view the definition of the Arithmetic Mean'),header=TRUE)
a<-table.element(a,arm)
a<-table.element(a,hyperlink('arithmetic_mean_standard_error.htm', armse, 'click to view the definition of the Standard Error of the Arithmetic Mean'))
a<-table.element(a,armose)
a<-table.row.end(a)
a<-table.row.start(a)
a<-table.element(a,hyperlink('geometric_mean.htm', 'Geometric Mean', 'click to view the definition of the Geometric Mean'),header=TRUE)
a<-table.element(a,geo)
a<-table.element(a,'')
a<-table.row.end(a)
a<-table.row.start(a)
a<-table.element(a,hyperlink('harmonic_mean.htm', 'Harmonic Mean', 'click to view the definition of the Harmonic Mean'),header=TRUE)
a<-table.element(a,har)
a<-table.element(a,'')
a<-table.row.end(a)
a<-table.row.start(a)
a<-table.element(a,hyperlink('quadratic_mean.htm', 'Quadratic Mean', 'click to view the definition of the Quadratic Mean'),header=TRUE)
a<-table.element(a,qua)
a<-table.element(a,'')
a<-table.row.end(a)
for (j in 1:length(win[,1])) {
a<-table.row.start(a)
mylabel <- paste('Winsorized Mean (',j)
mylabel <- paste(mylabel,'/')
mylabel <- paste(mylabel,length(win[,1]))
mylabel <- paste(mylabel,')')
a<-table.element(a,hyperlink('winsorized_mean.htm', mylabel, 'click to view the definition of the Winsorized Mean'),header=TRUE)
a<-table.element(a,win[j,1])
a<-table.element(a,win[j,2])
a<-table.element(a,win[j,1]/win[j,2])
a<-table.row.end(a)
}
for (j in 1:length(tri[,1])) {
a<-table.row.start(a)
mylabel <- paste('Trimmed Mean (',j)
mylabel <- paste(mylabel,'/')
mylabel <- paste(mylabel,length(tri[,1]))
mylabel <- paste(mylabel,')')
a<-table.element(a,hyperlink('arithmetic_mean.htm', mylabel, 'click to view the definition of the Trimmed Mean'),header=TRUE)
a<-table.element(a,tri[j,1])
a<-table.element(a,tri[j,2])
a<-table.element(a,tri[j,1]/tri[j,2])
a<-table.row.end(a)
}
a<-table.row.start(a)
a<-table.element(a,hyperlink('median_1.htm', 'Median', 'click to view the definition of the Median'),header=TRUE)
a<-table.element(a,median(x))
a<-table.element(a,'')
a<-table.row.end(a)
a<-table.row.start(a)
a<-table.element(a,hyperlink('midrange.htm', 'Midrange', 'click to view the definition of the Midrange'),header=TRUE)
a<-table.element(a,midr)
a<-table.element(a,'')
a<-table.row.end(a)
a<-table.row.start(a)
mymid <- hyperlink('midmean.htm', 'Midmean', 'click to view the definition of the Midmean')
mylabel <- paste(mymid,hyperlink('method_1.htm','Weighted Average at Xnp',''),sep=' - ')
a<-table.element(a,mylabel,header=TRUE)
a<-table.element(a,midm[1])
a<-table.element(a,'')
a<-table.row.end(a)
a<-table.row.start(a)
mymid <- hyperlink('midmean.htm', 'Midmean', 'click to view the definition of the Midmean')
mylabel <- paste(mymid,hyperlink('method_2.htm','Weighted Average at X(n+1)p',''),sep=' - ')
a<-table.element(a,mylabel,header=TRUE)
a<-table.element(a,midm[2])
a<-table.element(a,'')
a<-table.row.end(a)
a<-table.row.start(a)
mymid <- hyperlink('midmean.htm', 'Midmean', 'click to view the definition of the Midmean')
mylabel <- paste(mymid,hyperlink('method_3.htm','Empirical Distribution Function',''),sep=' - ')
a<-table.element(a,mylabel,header=TRUE)
a<-table.element(a,midm[3])
a<-table.element(a,'')
a<-table.row.end(a)
a<-table.row.start(a)
mymid <- hyperlink('midmean.htm', 'Midmean', 'click to view the definition of the Midmean')
mylabel <- paste(mymid,hyperlink('method_4.htm','Empirical Distribution Function - Averaging',''),sep=' - ')
a<-table.element(a,mylabel,header=TRUE)
a<-table.element(a,midm[4])
a<-table.element(a,'')
a<-table.row.end(a)
a<-table.row.start(a)
mymid <- hyperlink('midmean.htm', 'Midmean', 'click to view the definition of the Midmean')
mylabel <- paste(mymid,hyperlink('method_5.htm','Empirical Distribution Function - Interpolation',''),sep=' - ')
a<-table.element(a,mylabel,header=TRUE)
a<-table.element(a,midm[5])
a<-table.element(a,'')
a<-table.row.end(a)
a<-table.row.start(a)
mymid <- hyperlink('midmean.htm', 'Midmean', 'click to view the definition of the Midmean')
mylabel <- paste(mymid,hyperlink('method_6.htm','Closest Observation',''),sep=' - ')
a<-table.element(a,mylabel,header=TRUE)
a<-table.element(a,midm[6])
a<-table.element(a,'')
a<-table.row.end(a)
a<-table.row.start(a)
mymid <- hyperlink('midmean.htm', 'Midmean', 'click to view the definition of the Midmean')
mylabel <- paste(mymid,hyperlink('method_7.htm','True Basic - Statistics Graphics Toolkit',''),sep=' - ')
a<-table.element(a,mylabel,header=TRUE)
a<-table.element(a,midm[7])
a<-table.element(a,'')
a<-table.row.end(a)
a<-table.row.start(a)
mymid <- hyperlink('midmean.htm', 'Midmean', 'click to view the definition of the Midmean')
mylabel <- paste(mymid,hyperlink('method_8.htm','MS Excel (old versions)',''),sep=' - ')
a<-table.element(a,mylabel,header=TRUE)
a<-table.element(a,midm[8])
a<-table.element(a,'')
a<-table.row.end(a)
a<-table.row.start(a)
a<-table.element(a,'Number of observations',header=TRUE)
a<-table.element(a,length(x))
a<-table.element(a,'')
a<-table.row.end(a)
a<-table.end(a)
table.save(a,file='mytable.tab')