Free Statistics

of Irreproducible Research!

Author's title

Author*Unverified author*
R Software Modulerwasp_autocorrelation.wasp
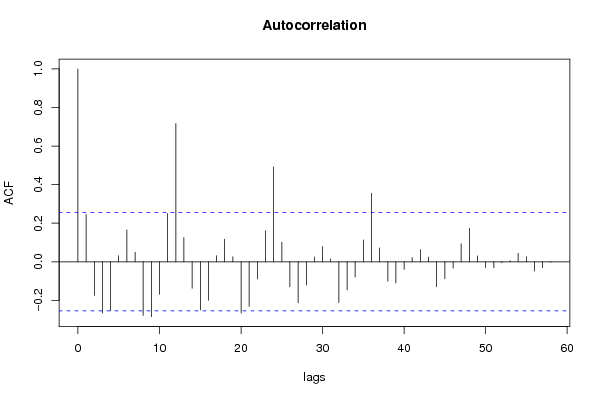
Title produced by software(Partial) Autocorrelation Function
Date of computationFri, 19 Dec 2008 06:14:16 -0700
Cite this page as followsStatistical Computations at FreeStatistics.org, Office for Research Development and Education, URL https://freestatistics.org/blog/index.php?v=date/2008/Dec/19/t1229692581lyzs6i840qm1rp8.htm/, Retrieved Wed, 15 May 2024 17:50:35 +0000
Statistical Computations at FreeStatistics.org, Office for Research Development and Education, URL https://freestatistics.org/blog/index.php?pk=35105, Retrieved Wed, 15 May 2024 17:50:35 +0000
QR Codes:

Original text written by user:
IsPrivate?No (this computation is public)
User-defined keywords
Estimated Impact208
Family? (F = Feedback message, R = changed R code, M = changed R Module, P = changed Parameters, D = changed Data)
-     [Standard Deviation-Mean Plot] [Paper2] [2008-12-19 12:57:19] [8ac58ef7b35dc5a117bc162cf16850e9]
- RMPD    [(Partial) Autocorrelation Function] [Paper8] [2008-12-19 13:14:16] [acca1d0ee7cc95ffc080d0867a313954] [Current]
-           [(Partial) Autocorrelation Function] [Paper 8] [2008-12-24 11:57:58] [74be16979710d4c4e7c6647856088456]
Feedback Forum

Post a new message
Dataseries X:
528
478
469
490
493
508
517
514
510
527
542
565
555
499
511
526
532
549
561
557
566
588
620
626
620
573
573
574
580
590
593
597
595
612
628
629
621
569
567
573
584
589
591
595
594
611
613
611
594
543
537
544
555
561
562
555
547
565
578
580


Summary of computational transaction
Raw Inputview raw input (R code)
Raw Outputview raw output of R engine
Computing time3 seconds
R Server'Sir Ronald Aylmer Fisher' @ 193.190.124.24

\begin{tabular}{lllllllll}
\hline
Summary of computational transaction \tabularnewline
Raw Input & view raw input (R code)  \tabularnewline
Raw Output & view raw output of R engine  \tabularnewline
Computing time & 3 seconds \tabularnewline
R Server & 'Sir Ronald Aylmer Fisher' @ 193.190.124.24 \tabularnewline
\hline
\end{tabular}
%Source: https://freestatistics.org/blog/index.php?pk=35105&T=0

[TABLE]
[ROW][C]Summary of computational transaction[/C][/ROW]
[ROW][C]Raw Input[/C][C]view raw input (R code) [/C][/ROW]
[ROW][C]Raw Output[/C][C]view raw output of R engine [/C][/ROW]
[ROW][C]Computing time[/C][C]3 seconds[/C][/ROW]
[ROW][C]R Server[/C][C]'Sir Ronald Aylmer Fisher' @ 193.190.124.24[/C][/ROW]
[/TABLE]
Source: https://freestatistics.org/blog/index.php?pk=35105&T=0

Globally Unique Identifier (entire table): ba.freestatistics.org/blog/index.php?pk=35105&T=0

As an alternative you can also use a QR Code:  

The GUIDs for individual cells are displayed in the table below:

Summary of computational transaction
Raw Inputview raw input (R code)
Raw Outputview raw output of R engine
Computing time3 seconds
R Server'Sir Ronald Aylmer Fisher' @ 193.190.124.24


Autocorrelation Function
Time lag kACF(k)T-STATP-value
10.244591.87870.032612
2-0.174356-1.33930.092813
3-0.265865-2.04210.022807
4-0.25445-1.95450.027695
50.0316030.24270.404521
60.1651971.26890.10473
70.0495570.38070.352414
8-0.278317-2.13780.018344
9-0.284683-2.18670.016371
10-0.168593-1.2950.100184
110.2502171.9220.029722
120.7165625.5040
130.1254320.96350.169625
14-0.137284-1.05450.147978
15-0.250551-1.92450.029558
16-0.199687-1.53380.065209
170.0312670.24020.405518
180.1172460.90060.185735
190.0258130.19830.421757
20-0.265822-2.04180.022824
21-0.231306-1.77670.040387
22-0.088802-0.68210.248922
230.1610051.23670.110548
240.4918863.77820.000185
250.1010720.77630.220322
26-0.12928-0.9930.162378
27-0.212833-1.63480.053708
28-0.121007-0.92950.178215
290.0244850.18810.425733
300.0795830.61130.271678
310.0142620.10960.456569
32-0.211928-1.62790.054443
33-0.145976-1.12130.133359
34-0.079563-0.61110.271728
350.1130760.86860.194305
360.3552612.72880.004181
370.071850.55190.291555
38-0.101567-0.78010.219211
39-0.110352-0.84760.200036
40-0.038724-0.29740.383585
410.022090.16970.432921
420.0628740.48290.31546
430.0235520.18090.428531
44-0.129962-0.99830.161115
45-0.088736-0.68160.249081
46-0.032737-0.25150.401166
470.0934770.7180.237793
480.1731641.33010.094303
490.0301210.23140.408915
50-0.029882-0.22950.409625
51-0.030861-0.2370.40672
52-0.005151-0.03960.484287
530.0054680.0420.48332
540.0436320.33510.369354
550.0263850.20270.420046
56-0.048302-0.3710.355979
57-0.031311-0.24050.405386
58-0.002839-0.02180.491337
59NANANA
60NANANA

\begin{tabular}{lllllllll}
\hline
Autocorrelation Function \tabularnewline
Time lag k & ACF(k) & T-STAT & P-value \tabularnewline
1 & 0.24459 & 1.8787 & 0.032612 \tabularnewline
2 & -0.174356 & -1.3393 & 0.092813 \tabularnewline
3 & -0.265865 & -2.0421 & 0.022807 \tabularnewline
4 & -0.25445 & -1.9545 & 0.027695 \tabularnewline
5 & 0.031603 & 0.2427 & 0.404521 \tabularnewline
6 & 0.165197 & 1.2689 & 0.10473 \tabularnewline
7 & 0.049557 & 0.3807 & 0.352414 \tabularnewline
8 & -0.278317 & -2.1378 & 0.018344 \tabularnewline
9 & -0.284683 & -2.1867 & 0.016371 \tabularnewline
10 & -0.168593 & -1.295 & 0.100184 \tabularnewline
11 & 0.250217 & 1.922 & 0.029722 \tabularnewline
12 & 0.716562 & 5.504 & 0 \tabularnewline
13 & 0.125432 & 0.9635 & 0.169625 \tabularnewline
14 & -0.137284 & -1.0545 & 0.147978 \tabularnewline
15 & -0.250551 & -1.9245 & 0.029558 \tabularnewline
16 & -0.199687 & -1.5338 & 0.065209 \tabularnewline
17 & 0.031267 & 0.2402 & 0.405518 \tabularnewline
18 & 0.117246 & 0.9006 & 0.185735 \tabularnewline
19 & 0.025813 & 0.1983 & 0.421757 \tabularnewline
20 & -0.265822 & -2.0418 & 0.022824 \tabularnewline
21 & -0.231306 & -1.7767 & 0.040387 \tabularnewline
22 & -0.088802 & -0.6821 & 0.248922 \tabularnewline
23 & 0.161005 & 1.2367 & 0.110548 \tabularnewline
24 & 0.491886 & 3.7782 & 0.000185 \tabularnewline
25 & 0.101072 & 0.7763 & 0.220322 \tabularnewline
26 & -0.12928 & -0.993 & 0.162378 \tabularnewline
27 & -0.212833 & -1.6348 & 0.053708 \tabularnewline
28 & -0.121007 & -0.9295 & 0.178215 \tabularnewline
29 & 0.024485 & 0.1881 & 0.425733 \tabularnewline
30 & 0.079583 & 0.6113 & 0.271678 \tabularnewline
31 & 0.014262 & 0.1096 & 0.456569 \tabularnewline
32 & -0.211928 & -1.6279 & 0.054443 \tabularnewline
33 & -0.145976 & -1.1213 & 0.133359 \tabularnewline
34 & -0.079563 & -0.6111 & 0.271728 \tabularnewline
35 & 0.113076 & 0.8686 & 0.194305 \tabularnewline
36 & 0.355261 & 2.7288 & 0.004181 \tabularnewline
37 & 0.07185 & 0.5519 & 0.291555 \tabularnewline
38 & -0.101567 & -0.7801 & 0.219211 \tabularnewline
39 & -0.110352 & -0.8476 & 0.200036 \tabularnewline
40 & -0.038724 & -0.2974 & 0.383585 \tabularnewline
41 & 0.02209 & 0.1697 & 0.432921 \tabularnewline
42 & 0.062874 & 0.4829 & 0.31546 \tabularnewline
43 & 0.023552 & 0.1809 & 0.428531 \tabularnewline
44 & -0.129962 & -0.9983 & 0.161115 \tabularnewline
45 & -0.088736 & -0.6816 & 0.249081 \tabularnewline
46 & -0.032737 & -0.2515 & 0.401166 \tabularnewline
47 & 0.093477 & 0.718 & 0.237793 \tabularnewline
48 & 0.173164 & 1.3301 & 0.094303 \tabularnewline
49 & 0.030121 & 0.2314 & 0.408915 \tabularnewline
50 & -0.029882 & -0.2295 & 0.409625 \tabularnewline
51 & -0.030861 & -0.237 & 0.40672 \tabularnewline
52 & -0.005151 & -0.0396 & 0.484287 \tabularnewline
53 & 0.005468 & 0.042 & 0.48332 \tabularnewline
54 & 0.043632 & 0.3351 & 0.369354 \tabularnewline
55 & 0.026385 & 0.2027 & 0.420046 \tabularnewline
56 & -0.048302 & -0.371 & 0.355979 \tabularnewline
57 & -0.031311 & -0.2405 & 0.405386 \tabularnewline
58 & -0.002839 & -0.0218 & 0.491337 \tabularnewline
59 & NA & NA & NA \tabularnewline
60 & NA & NA & NA \tabularnewline
\hline
\end{tabular}
%Source: https://freestatistics.org/blog/index.php?pk=35105&T=1

[TABLE]
[ROW][C]Autocorrelation Function[/C][/ROW]
[ROW][C]Time lag k[/C][C]ACF(k)[/C][C]T-STAT[/C][C]P-value[/C][/ROW]
[ROW][C]1[/C][C]0.24459[/C][C]1.8787[/C][C]0.032612[/C][/ROW]
[ROW][C]2[/C][C]-0.174356[/C][C]-1.3393[/C][C]0.092813[/C][/ROW]
[ROW][C]3[/C][C]-0.265865[/C][C]-2.0421[/C][C]0.022807[/C][/ROW]
[ROW][C]4[/C][C]-0.25445[/C][C]-1.9545[/C][C]0.027695[/C][/ROW]
[ROW][C]5[/C][C]0.031603[/C][C]0.2427[/C][C]0.404521[/C][/ROW]
[ROW][C]6[/C][C]0.165197[/C][C]1.2689[/C][C]0.10473[/C][/ROW]
[ROW][C]7[/C][C]0.049557[/C][C]0.3807[/C][C]0.352414[/C][/ROW]
[ROW][C]8[/C][C]-0.278317[/C][C]-2.1378[/C][C]0.018344[/C][/ROW]
[ROW][C]9[/C][C]-0.284683[/C][C]-2.1867[/C][C]0.016371[/C][/ROW]
[ROW][C]10[/C][C]-0.168593[/C][C]-1.295[/C][C]0.100184[/C][/ROW]
[ROW][C]11[/C][C]0.250217[/C][C]1.922[/C][C]0.029722[/C][/ROW]
[ROW][C]12[/C][C]0.716562[/C][C]5.504[/C][C]0[/C][/ROW]
[ROW][C]13[/C][C]0.125432[/C][C]0.9635[/C][C]0.169625[/C][/ROW]
[ROW][C]14[/C][C]-0.137284[/C][C]-1.0545[/C][C]0.147978[/C][/ROW]
[ROW][C]15[/C][C]-0.250551[/C][C]-1.9245[/C][C]0.029558[/C][/ROW]
[ROW][C]16[/C][C]-0.199687[/C][C]-1.5338[/C][C]0.065209[/C][/ROW]
[ROW][C]17[/C][C]0.031267[/C][C]0.2402[/C][C]0.405518[/C][/ROW]
[ROW][C]18[/C][C]0.117246[/C][C]0.9006[/C][C]0.185735[/C][/ROW]
[ROW][C]19[/C][C]0.025813[/C][C]0.1983[/C][C]0.421757[/C][/ROW]
[ROW][C]20[/C][C]-0.265822[/C][C]-2.0418[/C][C]0.022824[/C][/ROW]
[ROW][C]21[/C][C]-0.231306[/C][C]-1.7767[/C][C]0.040387[/C][/ROW]
[ROW][C]22[/C][C]-0.088802[/C][C]-0.6821[/C][C]0.248922[/C][/ROW]
[ROW][C]23[/C][C]0.161005[/C][C]1.2367[/C][C]0.110548[/C][/ROW]
[ROW][C]24[/C][C]0.491886[/C][C]3.7782[/C][C]0.000185[/C][/ROW]
[ROW][C]25[/C][C]0.101072[/C][C]0.7763[/C][C]0.220322[/C][/ROW]
[ROW][C]26[/C][C]-0.12928[/C][C]-0.993[/C][C]0.162378[/C][/ROW]
[ROW][C]27[/C][C]-0.212833[/C][C]-1.6348[/C][C]0.053708[/C][/ROW]
[ROW][C]28[/C][C]-0.121007[/C][C]-0.9295[/C][C]0.178215[/C][/ROW]
[ROW][C]29[/C][C]0.024485[/C][C]0.1881[/C][C]0.425733[/C][/ROW]
[ROW][C]30[/C][C]0.079583[/C][C]0.6113[/C][C]0.271678[/C][/ROW]
[ROW][C]31[/C][C]0.014262[/C][C]0.1096[/C][C]0.456569[/C][/ROW]
[ROW][C]32[/C][C]-0.211928[/C][C]-1.6279[/C][C]0.054443[/C][/ROW]
[ROW][C]33[/C][C]-0.145976[/C][C]-1.1213[/C][C]0.133359[/C][/ROW]
[ROW][C]34[/C][C]-0.079563[/C][C]-0.6111[/C][C]0.271728[/C][/ROW]
[ROW][C]35[/C][C]0.113076[/C][C]0.8686[/C][C]0.194305[/C][/ROW]
[ROW][C]36[/C][C]0.355261[/C][C]2.7288[/C][C]0.004181[/C][/ROW]
[ROW][C]37[/C][C]0.07185[/C][C]0.5519[/C][C]0.291555[/C][/ROW]
[ROW][C]38[/C][C]-0.101567[/C][C]-0.7801[/C][C]0.219211[/C][/ROW]
[ROW][C]39[/C][C]-0.110352[/C][C]-0.8476[/C][C]0.200036[/C][/ROW]
[ROW][C]40[/C][C]-0.038724[/C][C]-0.2974[/C][C]0.383585[/C][/ROW]
[ROW][C]41[/C][C]0.02209[/C][C]0.1697[/C][C]0.432921[/C][/ROW]
[ROW][C]42[/C][C]0.062874[/C][C]0.4829[/C][C]0.31546[/C][/ROW]
[ROW][C]43[/C][C]0.023552[/C][C]0.1809[/C][C]0.428531[/C][/ROW]
[ROW][C]44[/C][C]-0.129962[/C][C]-0.9983[/C][C]0.161115[/C][/ROW]
[ROW][C]45[/C][C]-0.088736[/C][C]-0.6816[/C][C]0.249081[/C][/ROW]
[ROW][C]46[/C][C]-0.032737[/C][C]-0.2515[/C][C]0.401166[/C][/ROW]
[ROW][C]47[/C][C]0.093477[/C][C]0.718[/C][C]0.237793[/C][/ROW]
[ROW][C]48[/C][C]0.173164[/C][C]1.3301[/C][C]0.094303[/C][/ROW]
[ROW][C]49[/C][C]0.030121[/C][C]0.2314[/C][C]0.408915[/C][/ROW]
[ROW][C]50[/C][C]-0.029882[/C][C]-0.2295[/C][C]0.409625[/C][/ROW]
[ROW][C]51[/C][C]-0.030861[/C][C]-0.237[/C][C]0.40672[/C][/ROW]
[ROW][C]52[/C][C]-0.005151[/C][C]-0.0396[/C][C]0.484287[/C][/ROW]
[ROW][C]53[/C][C]0.005468[/C][C]0.042[/C][C]0.48332[/C][/ROW]
[ROW][C]54[/C][C]0.043632[/C][C]0.3351[/C][C]0.369354[/C][/ROW]
[ROW][C]55[/C][C]0.026385[/C][C]0.2027[/C][C]0.420046[/C][/ROW]
[ROW][C]56[/C][C]-0.048302[/C][C]-0.371[/C][C]0.355979[/C][/ROW]
[ROW][C]57[/C][C]-0.031311[/C][C]-0.2405[/C][C]0.405386[/C][/ROW]
[ROW][C]58[/C][C]-0.002839[/C][C]-0.0218[/C][C]0.491337[/C][/ROW]
[ROW][C]59[/C][C]NA[/C][C]NA[/C][C]NA[/C][/ROW]
[ROW][C]60[/C][C]NA[/C][C]NA[/C][C]NA[/C][/ROW]
[/TABLE]
Source: https://freestatistics.org/blog/index.php?pk=35105&T=1

Globally Unique Identifier (entire table): ba.freestatistics.org/blog/index.php?pk=35105&T=1

As an alternative you can also use a QR Code:  

The GUIDs for individual cells are displayed in the table below:

Autocorrelation Function
Time lag kACF(k)T-STATP-value
10.244591.87870.032612
2-0.174356-1.33930.092813
3-0.265865-2.04210.022807
4-0.25445-1.95450.027695
50.0316030.24270.404521
60.1651971.26890.10473
70.0495570.38070.352414
8-0.278317-2.13780.018344
9-0.284683-2.18670.016371
10-0.168593-1.2950.100184
110.2502171.9220.029722
120.7165625.5040
130.1254320.96350.169625
14-0.137284-1.05450.147978
15-0.250551-1.92450.029558
16-0.199687-1.53380.065209
170.0312670.24020.405518
180.1172460.90060.185735
190.0258130.19830.421757
20-0.265822-2.04180.022824
21-0.231306-1.77670.040387
22-0.088802-0.68210.248922
230.1610051.23670.110548
240.4918863.77820.000185
250.1010720.77630.220322
26-0.12928-0.9930.162378
27-0.212833-1.63480.053708
28-0.121007-0.92950.178215
290.0244850.18810.425733
300.0795830.61130.271678
310.0142620.10960.456569
32-0.211928-1.62790.054443
33-0.145976-1.12130.133359
34-0.079563-0.61110.271728
350.1130760.86860.194305
360.3552612.72880.004181
370.071850.55190.291555
38-0.101567-0.78010.219211
39-0.110352-0.84760.200036
40-0.038724-0.29740.383585
410.022090.16970.432921
420.0628740.48290.31546
430.0235520.18090.428531
44-0.129962-0.99830.161115
45-0.088736-0.68160.249081
46-0.032737-0.25150.401166
470.0934770.7180.237793
480.1731641.33010.094303
490.0301210.23140.408915
50-0.029882-0.22950.409625
51-0.030861-0.2370.40672
52-0.005151-0.03960.484287
530.0054680.0420.48332
540.0436320.33510.369354
550.0263850.20270.420046
56-0.048302-0.3710.355979
57-0.031311-0.24050.405386
58-0.002839-0.02180.491337
59NANANA
60NANANA


Partial Autocorrelation Function
Time lag kPACF(k)T-STATP-value
10.244591.87870.032612
2-0.249081-1.91320.030288
3-0.171996-1.32110.09578
4-0.206616-1.5870.058924
50.0687970.52840.299588
60.0205460.15780.43757
7-0.073606-0.56540.286981
8-0.33346-2.56140.006501
9-0.156069-1.19880.117701
10-0.223323-1.71540.045762
110.1795011.37880.086586
120.5640264.33242.9e-05
13-0.220456-1.69340.047831
140.0817610.6280.266207
15-0.075493-0.57990.282104
160.038160.29310.385233
17-0.082143-0.6310.265253
18-0.126849-0.97430.166932
19-0.031467-0.24170.404925
20-0.026518-0.20370.419649
210.0317840.24410.403987
220.0395570.30380.381157
23-0.264177-2.02920.02348
240.0494850.38010.352616
250.0104120.080.468264
26-0.113729-0.87360.192947
27-0.018274-0.14040.444425
28-0.063263-0.48590.314408
29-0.022348-0.17170.432146
30-0.020229-0.15540.438525
31-0.086565-0.66490.254347
320.012160.09340.462951
33-0.048805-0.37490.354546
34-0.117705-0.90410.184806
350.0382440.29380.384987
36-0.13882-1.06630.145317
370.0029610.02270.490964
38-0.055882-0.42920.334656
390.0413040.31730.376084
400.0138760.10660.45774
41-0.057473-0.44150.330249
42-0.009475-0.07280.471116
430.0147170.1130.455189
44-0.015999-0.12290.451306
450.0246340.18920.425285
460.0093950.07220.471357
47-0.023686-0.18190.428128
48-0.141121-1.0840.141393
490.0174390.1340.446948
500.0532270.40880.342068
51-0.031745-0.24380.404101
52-0.038498-0.29570.384246
53-0.037451-0.28770.387305
540.0458250.3520.36305
550.020490.15740.437738
560.0525520.40370.343961
57-0.044921-0.3450.365643
580.0008390.00640.497439
59NANANA
60NANANA

\begin{tabular}{lllllllll}
\hline
Partial Autocorrelation Function \tabularnewline
Time lag k & PACF(k) & T-STAT & P-value \tabularnewline
1 & 0.24459 & 1.8787 & 0.032612 \tabularnewline
2 & -0.249081 & -1.9132 & 0.030288 \tabularnewline
3 & -0.171996 & -1.3211 & 0.09578 \tabularnewline
4 & -0.206616 & -1.587 & 0.058924 \tabularnewline
5 & 0.068797 & 0.5284 & 0.299588 \tabularnewline
6 & 0.020546 & 0.1578 & 0.43757 \tabularnewline
7 & -0.073606 & -0.5654 & 0.286981 \tabularnewline
8 & -0.33346 & -2.5614 & 0.006501 \tabularnewline
9 & -0.156069 & -1.1988 & 0.117701 \tabularnewline
10 & -0.223323 & -1.7154 & 0.045762 \tabularnewline
11 & 0.179501 & 1.3788 & 0.086586 \tabularnewline
12 & 0.564026 & 4.3324 & 2.9e-05 \tabularnewline
13 & -0.220456 & -1.6934 & 0.047831 \tabularnewline
14 & 0.081761 & 0.628 & 0.266207 \tabularnewline
15 & -0.075493 & -0.5799 & 0.282104 \tabularnewline
16 & 0.03816 & 0.2931 & 0.385233 \tabularnewline
17 & -0.082143 & -0.631 & 0.265253 \tabularnewline
18 & -0.126849 & -0.9743 & 0.166932 \tabularnewline
19 & -0.031467 & -0.2417 & 0.404925 \tabularnewline
20 & -0.026518 & -0.2037 & 0.419649 \tabularnewline
21 & 0.031784 & 0.2441 & 0.403987 \tabularnewline
22 & 0.039557 & 0.3038 & 0.381157 \tabularnewline
23 & -0.264177 & -2.0292 & 0.02348 \tabularnewline
24 & 0.049485 & 0.3801 & 0.352616 \tabularnewline
25 & 0.010412 & 0.08 & 0.468264 \tabularnewline
26 & -0.113729 & -0.8736 & 0.192947 \tabularnewline
27 & -0.018274 & -0.1404 & 0.444425 \tabularnewline
28 & -0.063263 & -0.4859 & 0.314408 \tabularnewline
29 & -0.022348 & -0.1717 & 0.432146 \tabularnewline
30 & -0.020229 & -0.1554 & 0.438525 \tabularnewline
31 & -0.086565 & -0.6649 & 0.254347 \tabularnewline
32 & 0.01216 & 0.0934 & 0.462951 \tabularnewline
33 & -0.048805 & -0.3749 & 0.354546 \tabularnewline
34 & -0.117705 & -0.9041 & 0.184806 \tabularnewline
35 & 0.038244 & 0.2938 & 0.384987 \tabularnewline
36 & -0.13882 & -1.0663 & 0.145317 \tabularnewline
37 & 0.002961 & 0.0227 & 0.490964 \tabularnewline
38 & -0.055882 & -0.4292 & 0.334656 \tabularnewline
39 & 0.041304 & 0.3173 & 0.376084 \tabularnewline
40 & 0.013876 & 0.1066 & 0.45774 \tabularnewline
41 & -0.057473 & -0.4415 & 0.330249 \tabularnewline
42 & -0.009475 & -0.0728 & 0.471116 \tabularnewline
43 & 0.014717 & 0.113 & 0.455189 \tabularnewline
44 & -0.015999 & -0.1229 & 0.451306 \tabularnewline
45 & 0.024634 & 0.1892 & 0.425285 \tabularnewline
46 & 0.009395 & 0.0722 & 0.471357 \tabularnewline
47 & -0.023686 & -0.1819 & 0.428128 \tabularnewline
48 & -0.141121 & -1.084 & 0.141393 \tabularnewline
49 & 0.017439 & 0.134 & 0.446948 \tabularnewline
50 & 0.053227 & 0.4088 & 0.342068 \tabularnewline
51 & -0.031745 & -0.2438 & 0.404101 \tabularnewline
52 & -0.038498 & -0.2957 & 0.384246 \tabularnewline
53 & -0.037451 & -0.2877 & 0.387305 \tabularnewline
54 & 0.045825 & 0.352 & 0.36305 \tabularnewline
55 & 0.02049 & 0.1574 & 0.437738 \tabularnewline
56 & 0.052552 & 0.4037 & 0.343961 \tabularnewline
57 & -0.044921 & -0.345 & 0.365643 \tabularnewline
58 & 0.000839 & 0.0064 & 0.497439 \tabularnewline
59 & NA & NA & NA \tabularnewline
60 & NA & NA & NA \tabularnewline
\hline
\end{tabular}
%Source: https://freestatistics.org/blog/index.php?pk=35105&T=2

[TABLE]
[ROW][C]Partial Autocorrelation Function[/C][/ROW]
[ROW][C]Time lag k[/C][C]PACF(k)[/C][C]T-STAT[/C][C]P-value[/C][/ROW]
[ROW][C]1[/C][C]0.24459[/C][C]1.8787[/C][C]0.032612[/C][/ROW]
[ROW][C]2[/C][C]-0.249081[/C][C]-1.9132[/C][C]0.030288[/C][/ROW]
[ROW][C]3[/C][C]-0.171996[/C][C]-1.3211[/C][C]0.09578[/C][/ROW]
[ROW][C]4[/C][C]-0.206616[/C][C]-1.587[/C][C]0.058924[/C][/ROW]
[ROW][C]5[/C][C]0.068797[/C][C]0.5284[/C][C]0.299588[/C][/ROW]
[ROW][C]6[/C][C]0.020546[/C][C]0.1578[/C][C]0.43757[/C][/ROW]
[ROW][C]7[/C][C]-0.073606[/C][C]-0.5654[/C][C]0.286981[/C][/ROW]
[ROW][C]8[/C][C]-0.33346[/C][C]-2.5614[/C][C]0.006501[/C][/ROW]
[ROW][C]9[/C][C]-0.156069[/C][C]-1.1988[/C][C]0.117701[/C][/ROW]
[ROW][C]10[/C][C]-0.223323[/C][C]-1.7154[/C][C]0.045762[/C][/ROW]
[ROW][C]11[/C][C]0.179501[/C][C]1.3788[/C][C]0.086586[/C][/ROW]
[ROW][C]12[/C][C]0.564026[/C][C]4.3324[/C][C]2.9e-05[/C][/ROW]
[ROW][C]13[/C][C]-0.220456[/C][C]-1.6934[/C][C]0.047831[/C][/ROW]
[ROW][C]14[/C][C]0.081761[/C][C]0.628[/C][C]0.266207[/C][/ROW]
[ROW][C]15[/C][C]-0.075493[/C][C]-0.5799[/C][C]0.282104[/C][/ROW]
[ROW][C]16[/C][C]0.03816[/C][C]0.2931[/C][C]0.385233[/C][/ROW]
[ROW][C]17[/C][C]-0.082143[/C][C]-0.631[/C][C]0.265253[/C][/ROW]
[ROW][C]18[/C][C]-0.126849[/C][C]-0.9743[/C][C]0.166932[/C][/ROW]
[ROW][C]19[/C][C]-0.031467[/C][C]-0.2417[/C][C]0.404925[/C][/ROW]
[ROW][C]20[/C][C]-0.026518[/C][C]-0.2037[/C][C]0.419649[/C][/ROW]
[ROW][C]21[/C][C]0.031784[/C][C]0.2441[/C][C]0.403987[/C][/ROW]
[ROW][C]22[/C][C]0.039557[/C][C]0.3038[/C][C]0.381157[/C][/ROW]
[ROW][C]23[/C][C]-0.264177[/C][C]-2.0292[/C][C]0.02348[/C][/ROW]
[ROW][C]24[/C][C]0.049485[/C][C]0.3801[/C][C]0.352616[/C][/ROW]
[ROW][C]25[/C][C]0.010412[/C][C]0.08[/C][C]0.468264[/C][/ROW]
[ROW][C]26[/C][C]-0.113729[/C][C]-0.8736[/C][C]0.192947[/C][/ROW]
[ROW][C]27[/C][C]-0.018274[/C][C]-0.1404[/C][C]0.444425[/C][/ROW]
[ROW][C]28[/C][C]-0.063263[/C][C]-0.4859[/C][C]0.314408[/C][/ROW]
[ROW][C]29[/C][C]-0.022348[/C][C]-0.1717[/C][C]0.432146[/C][/ROW]
[ROW][C]30[/C][C]-0.020229[/C][C]-0.1554[/C][C]0.438525[/C][/ROW]
[ROW][C]31[/C][C]-0.086565[/C][C]-0.6649[/C][C]0.254347[/C][/ROW]
[ROW][C]32[/C][C]0.01216[/C][C]0.0934[/C][C]0.462951[/C][/ROW]
[ROW][C]33[/C][C]-0.048805[/C][C]-0.3749[/C][C]0.354546[/C][/ROW]
[ROW][C]34[/C][C]-0.117705[/C][C]-0.9041[/C][C]0.184806[/C][/ROW]
[ROW][C]35[/C][C]0.038244[/C][C]0.2938[/C][C]0.384987[/C][/ROW]
[ROW][C]36[/C][C]-0.13882[/C][C]-1.0663[/C][C]0.145317[/C][/ROW]
[ROW][C]37[/C][C]0.002961[/C][C]0.0227[/C][C]0.490964[/C][/ROW]
[ROW][C]38[/C][C]-0.055882[/C][C]-0.4292[/C][C]0.334656[/C][/ROW]
[ROW][C]39[/C][C]0.041304[/C][C]0.3173[/C][C]0.376084[/C][/ROW]
[ROW][C]40[/C][C]0.013876[/C][C]0.1066[/C][C]0.45774[/C][/ROW]
[ROW][C]41[/C][C]-0.057473[/C][C]-0.4415[/C][C]0.330249[/C][/ROW]
[ROW][C]42[/C][C]-0.009475[/C][C]-0.0728[/C][C]0.471116[/C][/ROW]
[ROW][C]43[/C][C]0.014717[/C][C]0.113[/C][C]0.455189[/C][/ROW]
[ROW][C]44[/C][C]-0.015999[/C][C]-0.1229[/C][C]0.451306[/C][/ROW]
[ROW][C]45[/C][C]0.024634[/C][C]0.1892[/C][C]0.425285[/C][/ROW]
[ROW][C]46[/C][C]0.009395[/C][C]0.0722[/C][C]0.471357[/C][/ROW]
[ROW][C]47[/C][C]-0.023686[/C][C]-0.1819[/C][C]0.428128[/C][/ROW]
[ROW][C]48[/C][C]-0.141121[/C][C]-1.084[/C][C]0.141393[/C][/ROW]
[ROW][C]49[/C][C]0.017439[/C][C]0.134[/C][C]0.446948[/C][/ROW]
[ROW][C]50[/C][C]0.053227[/C][C]0.4088[/C][C]0.342068[/C][/ROW]
[ROW][C]51[/C][C]-0.031745[/C][C]-0.2438[/C][C]0.404101[/C][/ROW]
[ROW][C]52[/C][C]-0.038498[/C][C]-0.2957[/C][C]0.384246[/C][/ROW]
[ROW][C]53[/C][C]-0.037451[/C][C]-0.2877[/C][C]0.387305[/C][/ROW]
[ROW][C]54[/C][C]0.045825[/C][C]0.352[/C][C]0.36305[/C][/ROW]
[ROW][C]55[/C][C]0.02049[/C][C]0.1574[/C][C]0.437738[/C][/ROW]
[ROW][C]56[/C][C]0.052552[/C][C]0.4037[/C][C]0.343961[/C][/ROW]
[ROW][C]57[/C][C]-0.044921[/C][C]-0.345[/C][C]0.365643[/C][/ROW]
[ROW][C]58[/C][C]0.000839[/C][C]0.0064[/C][C]0.497439[/C][/ROW]
[ROW][C]59[/C][C]NA[/C][C]NA[/C][C]NA[/C][/ROW]
[ROW][C]60[/C][C]NA[/C][C]NA[/C][C]NA[/C][/ROW]
[/TABLE]
Source: https://freestatistics.org/blog/index.php?pk=35105&T=2

Globally Unique Identifier (entire table): ba.freestatistics.org/blog/index.php?pk=35105&T=2

As an alternative you can also use a QR Code:  

The GUIDs for individual cells are displayed in the table below:

Partial Autocorrelation Function
Time lag kPACF(k)T-STATP-value
10.244591.87870.032612
2-0.249081-1.91320.030288
3-0.171996-1.32110.09578
4-0.206616-1.5870.058924
50.0687970.52840.299588
60.0205460.15780.43757
7-0.073606-0.56540.286981
8-0.33346-2.56140.006501
9-0.156069-1.19880.117701
10-0.223323-1.71540.045762
110.1795011.37880.086586
120.5640264.33242.9e-05
13-0.220456-1.69340.047831
140.0817610.6280.266207
15-0.075493-0.57990.282104
160.038160.29310.385233
17-0.082143-0.6310.265253
18-0.126849-0.97430.166932
19-0.031467-0.24170.404925
20-0.026518-0.20370.419649
210.0317840.24410.403987
220.0395570.30380.381157
23-0.264177-2.02920.02348
240.0494850.38010.352616
250.0104120.080.468264
26-0.113729-0.87360.192947
27-0.018274-0.14040.444425
28-0.063263-0.48590.314408
29-0.022348-0.17170.432146
30-0.020229-0.15540.438525
31-0.086565-0.66490.254347
320.012160.09340.462951
33-0.048805-0.37490.354546
34-0.117705-0.90410.184806
350.0382440.29380.384987
36-0.13882-1.06630.145317
370.0029610.02270.490964
38-0.055882-0.42920.334656
390.0413040.31730.376084
400.0138760.10660.45774
41-0.057473-0.44150.330249
42-0.009475-0.07280.471116
430.0147170.1130.455189
44-0.015999-0.12290.451306
450.0246340.18920.425285
460.0093950.07220.471357
47-0.023686-0.18190.428128
48-0.141121-1.0840.141393
490.0174390.1340.446948
500.0532270.40880.342068
51-0.031745-0.24380.404101
52-0.038498-0.29570.384246
53-0.037451-0.28770.387305
540.0458250.3520.36305
550.020490.15740.437738
560.0525520.40370.343961
57-0.044921-0.3450.365643
580.0008390.00640.497439
59NANANA
60NANANA


Parameters (Session):
par1 = 60 ; par2 = 1 ; par3 = 1 ; par4 = 0 ; par5 = 12 ;
Parameters (R input):
par1 = 60 ; par2 = 1 ; par3 = 1 ; par4 = 0 ; par5 = 12 ;
R code (references can be found in the software module):
if (par1 == 'Default') {
par1 = 10*log10(length(x))
} else {
par1 <- as.numeric(par1)
}
par2 <- as.numeric(par2)
par3 <- as.numeric(par3)
par4 <- as.numeric(par4)
par5 <- as.numeric(par5)
if (par2 == 0) {
x <- log(x)
} else {
x <- (x ^ par2 - 1) / par2
}
if (par3 > 0) x <- diff(x,lag=1,difference=par3)
if (par4 > 0) x <- diff(x,lag=par5,difference=par4)
bitmap(file='pic1.png')
racf <- acf(x,par1,main='Autocorrelation',xlab='lags',ylab='ACF')
dev.off()
bitmap(file='pic2.png')
rpacf <- pacf(x,par1,main='Partial Autocorrelation',xlab='lags',ylab='PACF')
dev.off()
(myacf <- c(racf$acf))
(mypacf <- c(rpacf$acf))
lengthx <- length(x)
sqrtn <- sqrt(lengthx)
load(file='createtable')
a<-table.start()
a<-table.row.start(a)
a<-table.element(a,'Autocorrelation Function',4,TRUE)
a<-table.row.end(a)
a<-table.row.start(a)
a<-table.element(a,'Time lag k',header=TRUE)
a<-table.element(a,hyperlink('basics.htm','ACF(k)','click here for more information about the Autocorrelation Function'),header=TRUE)
a<-table.element(a,'T-STAT',header=TRUE)
a<-table.element(a,'P-value',header=TRUE)
a<-table.row.end(a)
for (i in 2:(par1+1)) {
a<-table.row.start(a)
a<-table.element(a,i-1,header=TRUE)
a<-table.element(a,round(myacf[i],6))
mytstat <- myacf[i]*sqrtn
a<-table.element(a,round(mytstat,4))
a<-table.element(a,round(1-pt(abs(mytstat),lengthx),6))
a<-table.row.end(a)
}
a<-table.end(a)
table.save(a,file='mytable.tab')
a<-table.start()
a<-table.row.start(a)
a<-table.element(a,'Partial Autocorrelation Function',4,TRUE)
a<-table.row.end(a)
a<-table.row.start(a)
a<-table.element(a,'Time lag k',header=TRUE)
a<-table.element(a,hyperlink('basics.htm','PACF(k)','click here for more information about the Partial Autocorrelation Function'),header=TRUE)
a<-table.element(a,'T-STAT',header=TRUE)
a<-table.element(a,'P-value',header=TRUE)
a<-table.row.end(a)
for (i in 1:par1) {
a<-table.row.start(a)
a<-table.element(a,i,header=TRUE)
a<-table.element(a,round(mypacf[i],6))
mytstat <- mypacf[i]*sqrtn
a<-table.element(a,round(mytstat,4))
a<-table.element(a,round(1-pt(abs(mytstat),lengthx),6))
a<-table.row.end(a)
}
a<-table.end(a)
table.save(a,file='mytable1.tab')