Free Statistics

of Irreproducible Research!

Author's title

Author*Unverified author*
R Software Modulerwasp_autocorrelation.wasp
Title produced by software(Partial) Autocorrelation Function
Date of computationFri, 19 Dec 2008 06:10:38 -0700
Cite this page as followsStatistical Computations at FreeStatistics.org, Office for Research Development and Education, URL https://freestatistics.org/blog/index.php?v=date/2008/Dec/19/t1229692279rmp6njwcn9b7she.htm/, Retrieved Wed, 15 May 2024 01:27:57 +0000
Statistical Computations at FreeStatistics.org, Office for Research Development and Education, URL https://freestatistics.org/blog/index.php?pk=35103, Retrieved Wed, 15 May 2024 01:27:57 +0000
QR Codes:

Original text written by user:
IsPrivate?No (this computation is public)
User-defined keywords
Estimated Impact192
Family? (F = Feedback message, R = changed R code, M = changed R Module, P = changed Parameters, D = changed Data)
-     [Standard Deviation-Mean Plot] [Paper2] [2008-12-19 12:57:19] [8ac58ef7b35dc5a117bc162cf16850e9]
- RMPD    [(Partial) Autocorrelation Function] [Paper7] [2008-12-19 13:10:38] [acca1d0ee7cc95ffc080d0867a313954] [Current]
-           [(Partial) Autocorrelation Function] [Paper 7] [2008-12-24 11:55:02] [74be16979710d4c4e7c6647856088456]
Feedback Forum

Post a new message
Dataseries X:
528
478
469
490
493
508
517
514
510
527
542
565
555
499
511
526
532
549
561
557
566
588
620
626
620
573
573
574
580
590
593
597
595
612
628
629
621
569
567
573
584
589
591
595
594
611
613
611
594
543
537
544
555
561
562
555
547
565
578
580


Summary of computational transaction
Raw Inputview raw input (R code)
Raw Outputview raw output of R engine
Computing time1 seconds
R Server'George Udny Yule' @ 72.249.76.132

\begin{tabular}{lllllllll}
\hline
Summary of computational transaction \tabularnewline
Raw Input & view raw input (R code)  \tabularnewline
Raw Output & view raw output of R engine  \tabularnewline
Computing time & 1 seconds \tabularnewline
R Server & 'George Udny Yule' @ 72.249.76.132 \tabularnewline
\hline
\end{tabular}
%Source: https://freestatistics.org/blog/index.php?pk=35103&T=0

[TABLE]
[ROW][C]Summary of computational transaction[/C][/ROW]
[ROW][C]Raw Input[/C][C]view raw input (R code) [/C][/ROW]
[ROW][C]Raw Output[/C][C]view raw output of R engine [/C][/ROW]
[ROW][C]Computing time[/C][C]1 seconds[/C][/ROW]
[ROW][C]R Server[/C][C]'George Udny Yule' @ 72.249.76.132[/C][/ROW]
[/TABLE]
Source: https://freestatistics.org/blog/index.php?pk=35103&T=0

Globally Unique Identifier (entire table): ba.freestatistics.org/blog/index.php?pk=35103&T=0

As an alternative you can also use a QR Code:  

The GUIDs for individual cells are displayed in the table below:

Summary of computational transaction
Raw Inputview raw input (R code)
Raw Outputview raw output of R engine
Computing time1 seconds
R Server'George Udny Yule' @ 72.249.76.132


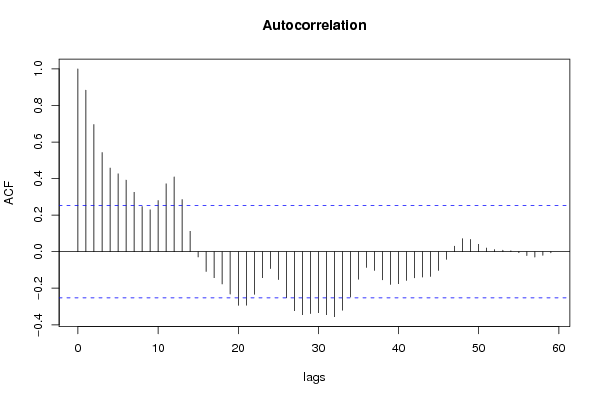
Autocorrelation Function
Time lag kACF(k)T-STATP-value
10.8840376.84770
20.6956795.38871e-06
30.5426374.20324.4e-05
40.4573383.54250.000387
50.425863.29870.000818
60.3916053.03340.001785
70.3250282.51770.007251
80.2472391.91510.030125
90.2292161.77550.040443
100.2799362.16840.017053
110.371522.87780.00277
120.409033.16830.001206
130.285182.2090.015502
140.1113060.86220.196013
15-0.029172-0.2260.410997
16-0.107884-0.83570.203329
17-0.142286-1.10210.1374
18-0.176713-1.36880.08808
19-0.231782-1.79540.038815
20-0.293486-2.27330.0133
21-0.292951-2.26920.013433
22-0.233198-1.80630.03794
23-0.1421-1.10070.137711
24-0.092402-0.71570.238462
25-0.152357-1.18020.121298
26-0.252666-1.95710.027494
27-0.323023-2.50210.007544
28-0.344759-2.67050.004866
29-0.338928-2.62530.005483
30-0.334089-2.58780.006048
31-0.344898-2.67160.004853
32-0.355603-2.75450.003885
33-0.32058-2.48320.007917
34-0.247387-1.91630.03005
35-0.150708-1.16740.123838
36-0.086254-0.66810.253309
37-0.102586-0.79460.21498
38-0.154117-1.19380.11863
39-0.17959-1.39110.084667
40-0.175508-1.35950.089542
41-0.157398-1.21920.11377
42-0.142878-1.10670.136414
43-0.138979-1.07650.143
44-0.135431-1.0490.149183
45-0.103034-0.79810.21398
46-0.041874-0.32440.373399
470.0298540.23120.408955
480.0712040.55150.291655
490.0669590.51870.302953
500.040190.31130.378323
510.0197980.15340.439316
520.0115610.08950.464472
530.0079260.06140.475623
540.0048820.03780.484979
55-0.005537-0.04290.482965
56-0.021603-0.16730.433835
57-0.029779-0.23070.409178
58-0.020247-0.15680.437951
59-0.006195-0.0480.480944
60NANANA

\begin{tabular}{lllllllll}
\hline
Autocorrelation Function \tabularnewline
Time lag k & ACF(k) & T-STAT & P-value \tabularnewline
1 & 0.884037 & 6.8477 & 0 \tabularnewline
2 & 0.695679 & 5.3887 & 1e-06 \tabularnewline
3 & 0.542637 & 4.2032 & 4.4e-05 \tabularnewline
4 & 0.457338 & 3.5425 & 0.000387 \tabularnewline
5 & 0.42586 & 3.2987 & 0.000818 \tabularnewline
6 & 0.391605 & 3.0334 & 0.001785 \tabularnewline
7 & 0.325028 & 2.5177 & 0.007251 \tabularnewline
8 & 0.247239 & 1.9151 & 0.030125 \tabularnewline
9 & 0.229216 & 1.7755 & 0.040443 \tabularnewline
10 & 0.279936 & 2.1684 & 0.017053 \tabularnewline
11 & 0.37152 & 2.8778 & 0.00277 \tabularnewline
12 & 0.40903 & 3.1683 & 0.001206 \tabularnewline
13 & 0.28518 & 2.209 & 0.015502 \tabularnewline
14 & 0.111306 & 0.8622 & 0.196013 \tabularnewline
15 & -0.029172 & -0.226 & 0.410997 \tabularnewline
16 & -0.107884 & -0.8357 & 0.203329 \tabularnewline
17 & -0.142286 & -1.1021 & 0.1374 \tabularnewline
18 & -0.176713 & -1.3688 & 0.08808 \tabularnewline
19 & -0.231782 & -1.7954 & 0.038815 \tabularnewline
20 & -0.293486 & -2.2733 & 0.0133 \tabularnewline
21 & -0.292951 & -2.2692 & 0.013433 \tabularnewline
22 & -0.233198 & -1.8063 & 0.03794 \tabularnewline
23 & -0.1421 & -1.1007 & 0.137711 \tabularnewline
24 & -0.092402 & -0.7157 & 0.238462 \tabularnewline
25 & -0.152357 & -1.1802 & 0.121298 \tabularnewline
26 & -0.252666 & -1.9571 & 0.027494 \tabularnewline
27 & -0.323023 & -2.5021 & 0.007544 \tabularnewline
28 & -0.344759 & -2.6705 & 0.004866 \tabularnewline
29 & -0.338928 & -2.6253 & 0.005483 \tabularnewline
30 & -0.334089 & -2.5878 & 0.006048 \tabularnewline
31 & -0.344898 & -2.6716 & 0.004853 \tabularnewline
32 & -0.355603 & -2.7545 & 0.003885 \tabularnewline
33 & -0.32058 & -2.4832 & 0.007917 \tabularnewline
34 & -0.247387 & -1.9163 & 0.03005 \tabularnewline
35 & -0.150708 & -1.1674 & 0.123838 \tabularnewline
36 & -0.086254 & -0.6681 & 0.253309 \tabularnewline
37 & -0.102586 & -0.7946 & 0.21498 \tabularnewline
38 & -0.154117 & -1.1938 & 0.11863 \tabularnewline
39 & -0.17959 & -1.3911 & 0.084667 \tabularnewline
40 & -0.175508 & -1.3595 & 0.089542 \tabularnewline
41 & -0.157398 & -1.2192 & 0.11377 \tabularnewline
42 & -0.142878 & -1.1067 & 0.136414 \tabularnewline
43 & -0.138979 & -1.0765 & 0.143 \tabularnewline
44 & -0.135431 & -1.049 & 0.149183 \tabularnewline
45 & -0.103034 & -0.7981 & 0.21398 \tabularnewline
46 & -0.041874 & -0.3244 & 0.373399 \tabularnewline
47 & 0.029854 & 0.2312 & 0.408955 \tabularnewline
48 & 0.071204 & 0.5515 & 0.291655 \tabularnewline
49 & 0.066959 & 0.5187 & 0.302953 \tabularnewline
50 & 0.04019 & 0.3113 & 0.378323 \tabularnewline
51 & 0.019798 & 0.1534 & 0.439316 \tabularnewline
52 & 0.011561 & 0.0895 & 0.464472 \tabularnewline
53 & 0.007926 & 0.0614 & 0.475623 \tabularnewline
54 & 0.004882 & 0.0378 & 0.484979 \tabularnewline
55 & -0.005537 & -0.0429 & 0.482965 \tabularnewline
56 & -0.021603 & -0.1673 & 0.433835 \tabularnewline
57 & -0.029779 & -0.2307 & 0.409178 \tabularnewline
58 & -0.020247 & -0.1568 & 0.437951 \tabularnewline
59 & -0.006195 & -0.048 & 0.480944 \tabularnewline
60 & NA & NA & NA \tabularnewline
\hline
\end{tabular}
%Source: https://freestatistics.org/blog/index.php?pk=35103&T=1

[TABLE]
[ROW][C]Autocorrelation Function[/C][/ROW]
[ROW][C]Time lag k[/C][C]ACF(k)[/C][C]T-STAT[/C][C]P-value[/C][/ROW]
[ROW][C]1[/C][C]0.884037[/C][C]6.8477[/C][C]0[/C][/ROW]
[ROW][C]2[/C][C]0.695679[/C][C]5.3887[/C][C]1e-06[/C][/ROW]
[ROW][C]3[/C][C]0.542637[/C][C]4.2032[/C][C]4.4e-05[/C][/ROW]
[ROW][C]4[/C][C]0.457338[/C][C]3.5425[/C][C]0.000387[/C][/ROW]
[ROW][C]5[/C][C]0.42586[/C][C]3.2987[/C][C]0.000818[/C][/ROW]
[ROW][C]6[/C][C]0.391605[/C][C]3.0334[/C][C]0.001785[/C][/ROW]
[ROW][C]7[/C][C]0.325028[/C][C]2.5177[/C][C]0.007251[/C][/ROW]
[ROW][C]8[/C][C]0.247239[/C][C]1.9151[/C][C]0.030125[/C][/ROW]
[ROW][C]9[/C][C]0.229216[/C][C]1.7755[/C][C]0.040443[/C][/ROW]
[ROW][C]10[/C][C]0.279936[/C][C]2.1684[/C][C]0.017053[/C][/ROW]
[ROW][C]11[/C][C]0.37152[/C][C]2.8778[/C][C]0.00277[/C][/ROW]
[ROW][C]12[/C][C]0.40903[/C][C]3.1683[/C][C]0.001206[/C][/ROW]
[ROW][C]13[/C][C]0.28518[/C][C]2.209[/C][C]0.015502[/C][/ROW]
[ROW][C]14[/C][C]0.111306[/C][C]0.8622[/C][C]0.196013[/C][/ROW]
[ROW][C]15[/C][C]-0.029172[/C][C]-0.226[/C][C]0.410997[/C][/ROW]
[ROW][C]16[/C][C]-0.107884[/C][C]-0.8357[/C][C]0.203329[/C][/ROW]
[ROW][C]17[/C][C]-0.142286[/C][C]-1.1021[/C][C]0.1374[/C][/ROW]
[ROW][C]18[/C][C]-0.176713[/C][C]-1.3688[/C][C]0.08808[/C][/ROW]
[ROW][C]19[/C][C]-0.231782[/C][C]-1.7954[/C][C]0.038815[/C][/ROW]
[ROW][C]20[/C][C]-0.293486[/C][C]-2.2733[/C][C]0.0133[/C][/ROW]
[ROW][C]21[/C][C]-0.292951[/C][C]-2.2692[/C][C]0.013433[/C][/ROW]
[ROW][C]22[/C][C]-0.233198[/C][C]-1.8063[/C][C]0.03794[/C][/ROW]
[ROW][C]23[/C][C]-0.1421[/C][C]-1.1007[/C][C]0.137711[/C][/ROW]
[ROW][C]24[/C][C]-0.092402[/C][C]-0.7157[/C][C]0.238462[/C][/ROW]
[ROW][C]25[/C][C]-0.152357[/C][C]-1.1802[/C][C]0.121298[/C][/ROW]
[ROW][C]26[/C][C]-0.252666[/C][C]-1.9571[/C][C]0.027494[/C][/ROW]
[ROW][C]27[/C][C]-0.323023[/C][C]-2.5021[/C][C]0.007544[/C][/ROW]
[ROW][C]28[/C][C]-0.344759[/C][C]-2.6705[/C][C]0.004866[/C][/ROW]
[ROW][C]29[/C][C]-0.338928[/C][C]-2.6253[/C][C]0.005483[/C][/ROW]
[ROW][C]30[/C][C]-0.334089[/C][C]-2.5878[/C][C]0.006048[/C][/ROW]
[ROW][C]31[/C][C]-0.344898[/C][C]-2.6716[/C][C]0.004853[/C][/ROW]
[ROW][C]32[/C][C]-0.355603[/C][C]-2.7545[/C][C]0.003885[/C][/ROW]
[ROW][C]33[/C][C]-0.32058[/C][C]-2.4832[/C][C]0.007917[/C][/ROW]
[ROW][C]34[/C][C]-0.247387[/C][C]-1.9163[/C][C]0.03005[/C][/ROW]
[ROW][C]35[/C][C]-0.150708[/C][C]-1.1674[/C][C]0.123838[/C][/ROW]
[ROW][C]36[/C][C]-0.086254[/C][C]-0.6681[/C][C]0.253309[/C][/ROW]
[ROW][C]37[/C][C]-0.102586[/C][C]-0.7946[/C][C]0.21498[/C][/ROW]
[ROW][C]38[/C][C]-0.154117[/C][C]-1.1938[/C][C]0.11863[/C][/ROW]
[ROW][C]39[/C][C]-0.17959[/C][C]-1.3911[/C][C]0.084667[/C][/ROW]
[ROW][C]40[/C][C]-0.175508[/C][C]-1.3595[/C][C]0.089542[/C][/ROW]
[ROW][C]41[/C][C]-0.157398[/C][C]-1.2192[/C][C]0.11377[/C][/ROW]
[ROW][C]42[/C][C]-0.142878[/C][C]-1.1067[/C][C]0.136414[/C][/ROW]
[ROW][C]43[/C][C]-0.138979[/C][C]-1.0765[/C][C]0.143[/C][/ROW]
[ROW][C]44[/C][C]-0.135431[/C][C]-1.049[/C][C]0.149183[/C][/ROW]
[ROW][C]45[/C][C]-0.103034[/C][C]-0.7981[/C][C]0.21398[/C][/ROW]
[ROW][C]46[/C][C]-0.041874[/C][C]-0.3244[/C][C]0.373399[/C][/ROW]
[ROW][C]47[/C][C]0.029854[/C][C]0.2312[/C][C]0.408955[/C][/ROW]
[ROW][C]48[/C][C]0.071204[/C][C]0.5515[/C][C]0.291655[/C][/ROW]
[ROW][C]49[/C][C]0.066959[/C][C]0.5187[/C][C]0.302953[/C][/ROW]
[ROW][C]50[/C][C]0.04019[/C][C]0.3113[/C][C]0.378323[/C][/ROW]
[ROW][C]51[/C][C]0.019798[/C][C]0.1534[/C][C]0.439316[/C][/ROW]
[ROW][C]52[/C][C]0.011561[/C][C]0.0895[/C][C]0.464472[/C][/ROW]
[ROW][C]53[/C][C]0.007926[/C][C]0.0614[/C][C]0.475623[/C][/ROW]
[ROW][C]54[/C][C]0.004882[/C][C]0.0378[/C][C]0.484979[/C][/ROW]
[ROW][C]55[/C][C]-0.005537[/C][C]-0.0429[/C][C]0.482965[/C][/ROW]
[ROW][C]56[/C][C]-0.021603[/C][C]-0.1673[/C][C]0.433835[/C][/ROW]
[ROW][C]57[/C][C]-0.029779[/C][C]-0.2307[/C][C]0.409178[/C][/ROW]
[ROW][C]58[/C][C]-0.020247[/C][C]-0.1568[/C][C]0.437951[/C][/ROW]
[ROW][C]59[/C][C]-0.006195[/C][C]-0.048[/C][C]0.480944[/C][/ROW]
[ROW][C]60[/C][C]NA[/C][C]NA[/C][C]NA[/C][/ROW]
[/TABLE]
Source: https://freestatistics.org/blog/index.php?pk=35103&T=1

Globally Unique Identifier (entire table): ba.freestatistics.org/blog/index.php?pk=35103&T=1

As an alternative you can also use a QR Code:  

The GUIDs for individual cells are displayed in the table below:

Autocorrelation Function
Time lag kACF(k)T-STATP-value
10.8840376.84770
20.6956795.38871e-06
30.5426374.20324.4e-05
40.4573383.54250.000387
50.425863.29870.000818
60.3916053.03340.001785
70.3250282.51770.007251
80.2472391.91510.030125
90.2292161.77550.040443
100.2799362.16840.017053
110.371522.87780.00277
120.409033.16830.001206
130.285182.2090.015502
140.1113060.86220.196013
15-0.029172-0.2260.410997
16-0.107884-0.83570.203329
17-0.142286-1.10210.1374
18-0.176713-1.36880.08808
19-0.231782-1.79540.038815
20-0.293486-2.27330.0133
21-0.292951-2.26920.013433
22-0.233198-1.80630.03794
23-0.1421-1.10070.137711
24-0.092402-0.71570.238462
25-0.152357-1.18020.121298
26-0.252666-1.95710.027494
27-0.323023-2.50210.007544
28-0.344759-2.67050.004866
29-0.338928-2.62530.005483
30-0.334089-2.58780.006048
31-0.344898-2.67160.004853
32-0.355603-2.75450.003885
33-0.32058-2.48320.007917
34-0.247387-1.91630.03005
35-0.150708-1.16740.123838
36-0.086254-0.66810.253309
37-0.102586-0.79460.21498
38-0.154117-1.19380.11863
39-0.17959-1.39110.084667
40-0.175508-1.35950.089542
41-0.157398-1.21920.11377
42-0.142878-1.10670.136414
43-0.138979-1.07650.143
44-0.135431-1.0490.149183
45-0.103034-0.79810.21398
46-0.041874-0.32440.373399
470.0298540.23120.408955
480.0712040.55150.291655
490.0669590.51870.302953
500.040190.31130.378323
510.0197980.15340.439316
520.0115610.08950.464472
530.0079260.06140.475623
540.0048820.03780.484979
55-0.005537-0.04290.482965
56-0.021603-0.16730.433835
57-0.029779-0.23070.409178
58-0.020247-0.15680.437951
59-0.006195-0.0480.480944
60NANANA


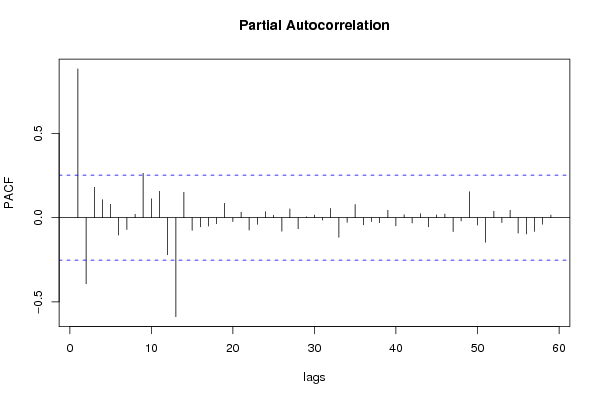
Partial Autocorrelation Function
Time lag kPACF(k)T-STATP-value
10.8840376.84770
2-0.392907-3.04340.001734
30.1804361.39770.083682
40.1066890.82640.205923
50.0795740.61640.269988
6-0.103382-0.80080.213205
7-0.070371-0.54510.293857
80.0197290.15280.439526
90.2637482.0430.022727
100.1123770.87050.193758
110.1565671.21280.114987
12-0.21974-1.70210.046957
13-0.588417-4.55791.3e-05
140.150841.16840.123633
15-0.075507-0.58490.280412
16-0.05411-0.41910.338309
17-0.050067-0.38780.34976
18-0.03615-0.280.390214
190.0851780.65980.255958
20-0.022876-0.17720.429975
210.0329920.25560.399585
22-0.073916-0.57260.284543
23-0.03922-0.30380.381166
240.0355750.27560.391914
250.0146780.11370.45493
26-0.080275-0.62180.268212
270.0519960.40280.344278
28-0.065482-0.50720.306931
290.0049270.03820.484842
300.0155490.12040.452267
31-0.014114-0.10930.456653
320.0549940.4260.335823
33-0.116535-0.90270.185153
34-0.027481-0.21290.416078
350.0778490.6030.274385
36-0.042281-0.32750.372213
37-0.022975-0.1780.429677
38-0.030098-0.23310.408224
390.0440250.3410.367141
40-0.048273-0.37390.354891
410.0168620.13060.448259
42-0.03167-0.24530.403526
430.0227830.17650.430257
44-0.054382-0.42120.337542
450.0159520.12360.451037
460.0212150.16430.435012
47-0.082815-0.64150.261825
48-0.019651-0.15220.439764
490.1538141.19140.119086
50-0.044007-0.34090.367193
51-0.145546-1.12740.132033
520.0385260.29840.383207
53-0.028579-0.22140.412778
540.0440220.3410.367151
55-0.091218-0.70660.241283
56-0.096852-0.75020.22803
57-0.081808-0.63370.264348
58-0.038581-0.29880.383046
590.0156650.12130.451912
60NANANA

\begin{tabular}{lllllllll}
\hline
Partial Autocorrelation Function \tabularnewline
Time lag k & PACF(k) & T-STAT & P-value \tabularnewline
1 & 0.884037 & 6.8477 & 0 \tabularnewline
2 & -0.392907 & -3.0434 & 0.001734 \tabularnewline
3 & 0.180436 & 1.3977 & 0.083682 \tabularnewline
4 & 0.106689 & 0.8264 & 0.205923 \tabularnewline
5 & 0.079574 & 0.6164 & 0.269988 \tabularnewline
6 & -0.103382 & -0.8008 & 0.213205 \tabularnewline
7 & -0.070371 & -0.5451 & 0.293857 \tabularnewline
8 & 0.019729 & 0.1528 & 0.439526 \tabularnewline
9 & 0.263748 & 2.043 & 0.022727 \tabularnewline
10 & 0.112377 & 0.8705 & 0.193758 \tabularnewline
11 & 0.156567 & 1.2128 & 0.114987 \tabularnewline
12 & -0.21974 & -1.7021 & 0.046957 \tabularnewline
13 & -0.588417 & -4.5579 & 1.3e-05 \tabularnewline
14 & 0.15084 & 1.1684 & 0.123633 \tabularnewline
15 & -0.075507 & -0.5849 & 0.280412 \tabularnewline
16 & -0.05411 & -0.4191 & 0.338309 \tabularnewline
17 & -0.050067 & -0.3878 & 0.34976 \tabularnewline
18 & -0.03615 & -0.28 & 0.390214 \tabularnewline
19 & 0.085178 & 0.6598 & 0.255958 \tabularnewline
20 & -0.022876 & -0.1772 & 0.429975 \tabularnewline
21 & 0.032992 & 0.2556 & 0.399585 \tabularnewline
22 & -0.073916 & -0.5726 & 0.284543 \tabularnewline
23 & -0.03922 & -0.3038 & 0.381166 \tabularnewline
24 & 0.035575 & 0.2756 & 0.391914 \tabularnewline
25 & 0.014678 & 0.1137 & 0.45493 \tabularnewline
26 & -0.080275 & -0.6218 & 0.268212 \tabularnewline
27 & 0.051996 & 0.4028 & 0.344278 \tabularnewline
28 & -0.065482 & -0.5072 & 0.306931 \tabularnewline
29 & 0.004927 & 0.0382 & 0.484842 \tabularnewline
30 & 0.015549 & 0.1204 & 0.452267 \tabularnewline
31 & -0.014114 & -0.1093 & 0.456653 \tabularnewline
32 & 0.054994 & 0.426 & 0.335823 \tabularnewline
33 & -0.116535 & -0.9027 & 0.185153 \tabularnewline
34 & -0.027481 & -0.2129 & 0.416078 \tabularnewline
35 & 0.077849 & 0.603 & 0.274385 \tabularnewline
36 & -0.042281 & -0.3275 & 0.372213 \tabularnewline
37 & -0.022975 & -0.178 & 0.429677 \tabularnewline
38 & -0.030098 & -0.2331 & 0.408224 \tabularnewline
39 & 0.044025 & 0.341 & 0.367141 \tabularnewline
40 & -0.048273 & -0.3739 & 0.354891 \tabularnewline
41 & 0.016862 & 0.1306 & 0.448259 \tabularnewline
42 & -0.03167 & -0.2453 & 0.403526 \tabularnewline
43 & 0.022783 & 0.1765 & 0.430257 \tabularnewline
44 & -0.054382 & -0.4212 & 0.337542 \tabularnewline
45 & 0.015952 & 0.1236 & 0.451037 \tabularnewline
46 & 0.021215 & 0.1643 & 0.435012 \tabularnewline
47 & -0.082815 & -0.6415 & 0.261825 \tabularnewline
48 & -0.019651 & -0.1522 & 0.439764 \tabularnewline
49 & 0.153814 & 1.1914 & 0.119086 \tabularnewline
50 & -0.044007 & -0.3409 & 0.367193 \tabularnewline
51 & -0.145546 & -1.1274 & 0.132033 \tabularnewline
52 & 0.038526 & 0.2984 & 0.383207 \tabularnewline
53 & -0.028579 & -0.2214 & 0.412778 \tabularnewline
54 & 0.044022 & 0.341 & 0.367151 \tabularnewline
55 & -0.091218 & -0.7066 & 0.241283 \tabularnewline
56 & -0.096852 & -0.7502 & 0.22803 \tabularnewline
57 & -0.081808 & -0.6337 & 0.264348 \tabularnewline
58 & -0.038581 & -0.2988 & 0.383046 \tabularnewline
59 & 0.015665 & 0.1213 & 0.451912 \tabularnewline
60 & NA & NA & NA \tabularnewline
\hline
\end{tabular}
%Source: https://freestatistics.org/blog/index.php?pk=35103&T=2

[TABLE]
[ROW][C]Partial Autocorrelation Function[/C][/ROW]
[ROW][C]Time lag k[/C][C]PACF(k)[/C][C]T-STAT[/C][C]P-value[/C][/ROW]
[ROW][C]1[/C][C]0.884037[/C][C]6.8477[/C][C]0[/C][/ROW]
[ROW][C]2[/C][C]-0.392907[/C][C]-3.0434[/C][C]0.001734[/C][/ROW]
[ROW][C]3[/C][C]0.180436[/C][C]1.3977[/C][C]0.083682[/C][/ROW]
[ROW][C]4[/C][C]0.106689[/C][C]0.8264[/C][C]0.205923[/C][/ROW]
[ROW][C]5[/C][C]0.079574[/C][C]0.6164[/C][C]0.269988[/C][/ROW]
[ROW][C]6[/C][C]-0.103382[/C][C]-0.8008[/C][C]0.213205[/C][/ROW]
[ROW][C]7[/C][C]-0.070371[/C][C]-0.5451[/C][C]0.293857[/C][/ROW]
[ROW][C]8[/C][C]0.019729[/C][C]0.1528[/C][C]0.439526[/C][/ROW]
[ROW][C]9[/C][C]0.263748[/C][C]2.043[/C][C]0.022727[/C][/ROW]
[ROW][C]10[/C][C]0.112377[/C][C]0.8705[/C][C]0.193758[/C][/ROW]
[ROW][C]11[/C][C]0.156567[/C][C]1.2128[/C][C]0.114987[/C][/ROW]
[ROW][C]12[/C][C]-0.21974[/C][C]-1.7021[/C][C]0.046957[/C][/ROW]
[ROW][C]13[/C][C]-0.588417[/C][C]-4.5579[/C][C]1.3e-05[/C][/ROW]
[ROW][C]14[/C][C]0.15084[/C][C]1.1684[/C][C]0.123633[/C][/ROW]
[ROW][C]15[/C][C]-0.075507[/C][C]-0.5849[/C][C]0.280412[/C][/ROW]
[ROW][C]16[/C][C]-0.05411[/C][C]-0.4191[/C][C]0.338309[/C][/ROW]
[ROW][C]17[/C][C]-0.050067[/C][C]-0.3878[/C][C]0.34976[/C][/ROW]
[ROW][C]18[/C][C]-0.03615[/C][C]-0.28[/C][C]0.390214[/C][/ROW]
[ROW][C]19[/C][C]0.085178[/C][C]0.6598[/C][C]0.255958[/C][/ROW]
[ROW][C]20[/C][C]-0.022876[/C][C]-0.1772[/C][C]0.429975[/C][/ROW]
[ROW][C]21[/C][C]0.032992[/C][C]0.2556[/C][C]0.399585[/C][/ROW]
[ROW][C]22[/C][C]-0.073916[/C][C]-0.5726[/C][C]0.284543[/C][/ROW]
[ROW][C]23[/C][C]-0.03922[/C][C]-0.3038[/C][C]0.381166[/C][/ROW]
[ROW][C]24[/C][C]0.035575[/C][C]0.2756[/C][C]0.391914[/C][/ROW]
[ROW][C]25[/C][C]0.014678[/C][C]0.1137[/C][C]0.45493[/C][/ROW]
[ROW][C]26[/C][C]-0.080275[/C][C]-0.6218[/C][C]0.268212[/C][/ROW]
[ROW][C]27[/C][C]0.051996[/C][C]0.4028[/C][C]0.344278[/C][/ROW]
[ROW][C]28[/C][C]-0.065482[/C][C]-0.5072[/C][C]0.306931[/C][/ROW]
[ROW][C]29[/C][C]0.004927[/C][C]0.0382[/C][C]0.484842[/C][/ROW]
[ROW][C]30[/C][C]0.015549[/C][C]0.1204[/C][C]0.452267[/C][/ROW]
[ROW][C]31[/C][C]-0.014114[/C][C]-0.1093[/C][C]0.456653[/C][/ROW]
[ROW][C]32[/C][C]0.054994[/C][C]0.426[/C][C]0.335823[/C][/ROW]
[ROW][C]33[/C][C]-0.116535[/C][C]-0.9027[/C][C]0.185153[/C][/ROW]
[ROW][C]34[/C][C]-0.027481[/C][C]-0.2129[/C][C]0.416078[/C][/ROW]
[ROW][C]35[/C][C]0.077849[/C][C]0.603[/C][C]0.274385[/C][/ROW]
[ROW][C]36[/C][C]-0.042281[/C][C]-0.3275[/C][C]0.372213[/C][/ROW]
[ROW][C]37[/C][C]-0.022975[/C][C]-0.178[/C][C]0.429677[/C][/ROW]
[ROW][C]38[/C][C]-0.030098[/C][C]-0.2331[/C][C]0.408224[/C][/ROW]
[ROW][C]39[/C][C]0.044025[/C][C]0.341[/C][C]0.367141[/C][/ROW]
[ROW][C]40[/C][C]-0.048273[/C][C]-0.3739[/C][C]0.354891[/C][/ROW]
[ROW][C]41[/C][C]0.016862[/C][C]0.1306[/C][C]0.448259[/C][/ROW]
[ROW][C]42[/C][C]-0.03167[/C][C]-0.2453[/C][C]0.403526[/C][/ROW]
[ROW][C]43[/C][C]0.022783[/C][C]0.1765[/C][C]0.430257[/C][/ROW]
[ROW][C]44[/C][C]-0.054382[/C][C]-0.4212[/C][C]0.337542[/C][/ROW]
[ROW][C]45[/C][C]0.015952[/C][C]0.1236[/C][C]0.451037[/C][/ROW]
[ROW][C]46[/C][C]0.021215[/C][C]0.1643[/C][C]0.435012[/C][/ROW]
[ROW][C]47[/C][C]-0.082815[/C][C]-0.6415[/C][C]0.261825[/C][/ROW]
[ROW][C]48[/C][C]-0.019651[/C][C]-0.1522[/C][C]0.439764[/C][/ROW]
[ROW][C]49[/C][C]0.153814[/C][C]1.1914[/C][C]0.119086[/C][/ROW]
[ROW][C]50[/C][C]-0.044007[/C][C]-0.3409[/C][C]0.367193[/C][/ROW]
[ROW][C]51[/C][C]-0.145546[/C][C]-1.1274[/C][C]0.132033[/C][/ROW]
[ROW][C]52[/C][C]0.038526[/C][C]0.2984[/C][C]0.383207[/C][/ROW]
[ROW][C]53[/C][C]-0.028579[/C][C]-0.2214[/C][C]0.412778[/C][/ROW]
[ROW][C]54[/C][C]0.044022[/C][C]0.341[/C][C]0.367151[/C][/ROW]
[ROW][C]55[/C][C]-0.091218[/C][C]-0.7066[/C][C]0.241283[/C][/ROW]
[ROW][C]56[/C][C]-0.096852[/C][C]-0.7502[/C][C]0.22803[/C][/ROW]
[ROW][C]57[/C][C]-0.081808[/C][C]-0.6337[/C][C]0.264348[/C][/ROW]
[ROW][C]58[/C][C]-0.038581[/C][C]-0.2988[/C][C]0.383046[/C][/ROW]
[ROW][C]59[/C][C]0.015665[/C][C]0.1213[/C][C]0.451912[/C][/ROW]
[ROW][C]60[/C][C]NA[/C][C]NA[/C][C]NA[/C][/ROW]
[/TABLE]
Source: https://freestatistics.org/blog/index.php?pk=35103&T=2

Globally Unique Identifier (entire table): ba.freestatistics.org/blog/index.php?pk=35103&T=2

As an alternative you can also use a QR Code:  

The GUIDs for individual cells are displayed in the table below:

Partial Autocorrelation Function
Time lag kPACF(k)T-STATP-value
10.8840376.84770
2-0.392907-3.04340.001734
30.1804361.39770.083682
40.1066890.82640.205923
50.0795740.61640.269988
6-0.103382-0.80080.213205
7-0.070371-0.54510.293857
80.0197290.15280.439526
90.2637482.0430.022727
100.1123770.87050.193758
110.1565671.21280.114987
12-0.21974-1.70210.046957
13-0.588417-4.55791.3e-05
140.150841.16840.123633
15-0.075507-0.58490.280412
16-0.05411-0.41910.338309
17-0.050067-0.38780.34976
18-0.03615-0.280.390214
190.0851780.65980.255958
20-0.022876-0.17720.429975
210.0329920.25560.399585
22-0.073916-0.57260.284543
23-0.03922-0.30380.381166
240.0355750.27560.391914
250.0146780.11370.45493
26-0.080275-0.62180.268212
270.0519960.40280.344278
28-0.065482-0.50720.306931
290.0049270.03820.484842
300.0155490.12040.452267
31-0.014114-0.10930.456653
320.0549940.4260.335823
33-0.116535-0.90270.185153
34-0.027481-0.21290.416078
350.0778490.6030.274385
36-0.042281-0.32750.372213
37-0.022975-0.1780.429677
38-0.030098-0.23310.408224
390.0440250.3410.367141
40-0.048273-0.37390.354891
410.0168620.13060.448259
42-0.03167-0.24530.403526
430.0227830.17650.430257
44-0.054382-0.42120.337542
450.0159520.12360.451037
460.0212150.16430.435012
47-0.082815-0.64150.261825
48-0.019651-0.15220.439764
490.1538141.19140.119086
50-0.044007-0.34090.367193
51-0.145546-1.12740.132033
520.0385260.29840.383207
53-0.028579-0.22140.412778
540.0440220.3410.367151
55-0.091218-0.70660.241283
56-0.096852-0.75020.22803
57-0.081808-0.63370.264348
58-0.038581-0.29880.383046
590.0156650.12130.451912
60NANANA


Parameters (Session):
par1 = 60 ; par2 = 1 ; par3 = 0 ; par4 = 0 ; par5 = 12 ;
Parameters (R input):
par1 = 60 ; par2 = 1 ; par3 = 0 ; par4 = 0 ; par5 = 12 ;
R code (references can be found in the software module):
if (par1 == 'Default') {
par1 = 10*log10(length(x))
} else {
par1 <- as.numeric(par1)
}
par2 <- as.numeric(par2)
par3 <- as.numeric(par3)
par4 <- as.numeric(par4)
par5 <- as.numeric(par5)
if (par2 == 0) {
x <- log(x)
} else {
x <- (x ^ par2 - 1) / par2
}
if (par3 > 0) x <- diff(x,lag=1,difference=par3)
if (par4 > 0) x <- diff(x,lag=par5,difference=par4)
bitmap(file='pic1.png')
racf <- acf(x,par1,main='Autocorrelation',xlab='lags',ylab='ACF')
dev.off()
bitmap(file='pic2.png')
rpacf <- pacf(x,par1,main='Partial Autocorrelation',xlab='lags',ylab='PACF')
dev.off()
(myacf <- c(racf$acf))
(mypacf <- c(rpacf$acf))
lengthx <- length(x)
sqrtn <- sqrt(lengthx)
load(file='createtable')
a<-table.start()
a<-table.row.start(a)
a<-table.element(a,'Autocorrelation Function',4,TRUE)
a<-table.row.end(a)
a<-table.row.start(a)
a<-table.element(a,'Time lag k',header=TRUE)
a<-table.element(a,hyperlink('basics.htm','ACF(k)','click here for more information about the Autocorrelation Function'),header=TRUE)
a<-table.element(a,'T-STAT',header=TRUE)
a<-table.element(a,'P-value',header=TRUE)
a<-table.row.end(a)
for (i in 2:(par1+1)) {
a<-table.row.start(a)
a<-table.element(a,i-1,header=TRUE)
a<-table.element(a,round(myacf[i],6))
mytstat <- myacf[i]*sqrtn
a<-table.element(a,round(mytstat,4))
a<-table.element(a,round(1-pt(abs(mytstat),lengthx),6))
a<-table.row.end(a)
}
a<-table.end(a)
table.save(a,file='mytable.tab')
a<-table.start()
a<-table.row.start(a)
a<-table.element(a,'Partial Autocorrelation Function',4,TRUE)
a<-table.row.end(a)
a<-table.row.start(a)
a<-table.element(a,'Time lag k',header=TRUE)
a<-table.element(a,hyperlink('basics.htm','PACF(k)','click here for more information about the Partial Autocorrelation Function'),header=TRUE)
a<-table.element(a,'T-STAT',header=TRUE)
a<-table.element(a,'P-value',header=TRUE)
a<-table.row.end(a)
for (i in 1:par1) {
a<-table.row.start(a)
a<-table.element(a,i,header=TRUE)
a<-table.element(a,round(mypacf[i],6))
mytstat <- mypacf[i]*sqrtn
a<-table.element(a,round(mytstat,4))
a<-table.element(a,round(1-pt(abs(mytstat),lengthx),6))
a<-table.row.end(a)
}
a<-table.end(a)
table.save(a,file='mytable1.tab')