Free Statistics

of Irreproducible Research!

Author's title

Author*The author of this computation has been verified*
R Software Modulerwasp_arimaforecasting.wasp
Title produced by softwareARIMA Forecasting
Date of computationFri, 19 Dec 2008 05:58:39 -0700
Cite this page as followsStatistical Computations at FreeStatistics.org, Office for Research Development and Education, URL https://freestatistics.org/blog/index.php?v=date/2008/Dec/19/t1229691549h10zdl53ys8s9y3.htm/, Retrieved Wed, 15 May 2024 08:30:00 +0000
Statistical Computations at FreeStatistics.org, Office for Research Development and Education, URL https://freestatistics.org/blog/index.php?pk=35094, Retrieved Wed, 15 May 2024 08:30:00 +0000
QR Codes:

Original text written by user:
IsPrivate?No (this computation is public)
User-defined keywords
Estimated Impact254
Family? (F = Feedback message, R = changed R code, M = changed R Module, P = changed Parameters, D = changed Data)
F     [ARIMA Forecasting] [ARIMA Forecasting] [2008-12-15 12:59:24] [1ce0d16c8f4225c977b42c8fa93bc163]
F       [ARIMA Forecasting] [ARIMA] [2008-12-15 22:45:01] [76963dc1903f0f612b6153510a3818cf]
-   PD      [ARIMA Forecasting] [feedback op blog] [2008-12-19 12:58:39] [f4b2017b314c03698059f43b95818e67] [Current]
Feedback Forum

Post a new message
Dataseries X:
14211
13646.8
12224.6
15916.4
16535.9
15796
14418.6
15044.5
14944.2
16754.8
14254
15454.9
15644.8
14568.3
12520.2
14803
15873.2
14755.3
12875.1
14291.1
14205.3
15859.4
15258.9
15498.6
15106.5
15023.6
12083
15761.3
16943
15070.3
13659.6
14768.9
14725.1
15998.1
15370.6
14956.9
15469.7
15101.8
11703.7
16283.6
16726.5
14968.9
14861
14583.3
15305.8
17903.9
16379.4
15420.3
17870.5
15912.8
13866.5
17823.2
17872
17420.4
16704.4
15991.2
16583.6
19123.5
17838.7
17209.4
18586.5
16258.1
15141.6
19202.1
17746.5
19090.1
18040.3
17515.5
17751.8
21072.4
17170
19439.5
19795.4
17574.9
16165.4
19464.6
19932.1
19961.2
17343.4
18924.2
18574.1
21350.6
18594.6
19823.1
20844.4
19640.2
17735.4
19813.6
22238.5
20682.2
17818.6
21872.1
22117
21865.9
23451.3
20953.7
22497.3


Summary of computational transaction
Raw Inputview raw input (R code)
Raw Outputview raw output of R engine
Computing time3 seconds
R Server'Gwilym Jenkins' @ 72.249.127.135

\begin{tabular}{lllllllll}
\hline
Summary of computational transaction \tabularnewline
Raw Input & view raw input (R code)  \tabularnewline
Raw Output & view raw output of R engine  \tabularnewline
Computing time & 3 seconds \tabularnewline
R Server & 'Gwilym Jenkins' @ 72.249.127.135 \tabularnewline
\hline
\end{tabular}
%Source: https://freestatistics.org/blog/index.php?pk=35094&T=0

[TABLE]
[ROW][C]Summary of computational transaction[/C][/ROW]
[ROW][C]Raw Input[/C][C]view raw input (R code) [/C][/ROW]
[ROW][C]Raw Output[/C][C]view raw output of R engine [/C][/ROW]
[ROW][C]Computing time[/C][C]3 seconds[/C][/ROW]
[ROW][C]R Server[/C][C]'Gwilym Jenkins' @ 72.249.127.135[/C][/ROW]
[/TABLE]
Source: https://freestatistics.org/blog/index.php?pk=35094&T=0

Globally Unique Identifier (entire table): ba.freestatistics.org/blog/index.php?pk=35094&T=0

As an alternative you can also use a QR Code:  

The GUIDs for individual cells are displayed in the table below:

Summary of computational transaction
Raw Inputview raw input (R code)
Raw Outputview raw output of R engine
Computing time3 seconds
R Server'Gwilym Jenkins' @ 72.249.127.135


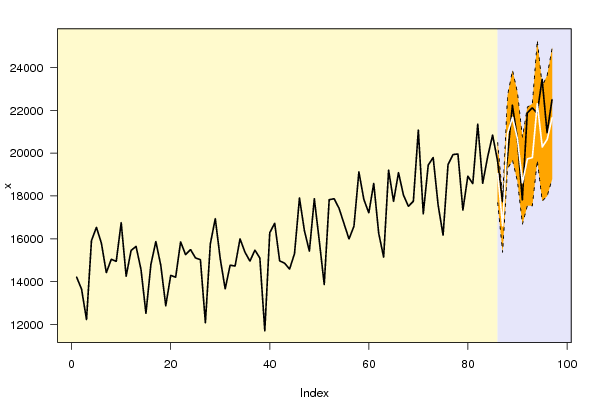
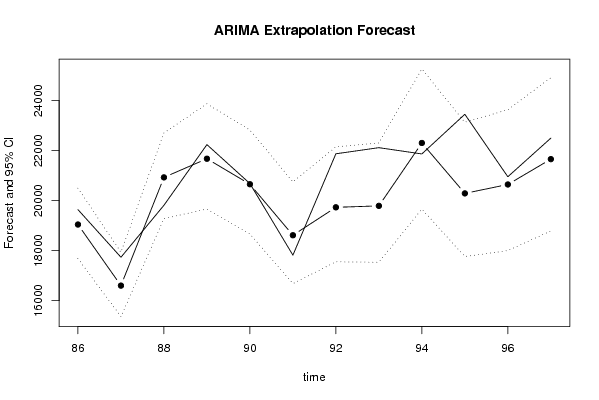
Univariate ARIMA Extrapolation Forecast
timeY[t]F[t]95% LB95% UBp-value(H0: Y[t] = F[t])P(F[t]>Y[t-1])P(F[t]>Y[t-s])P(F[t]>Y[85])
7319795.4-------
7417574.9-------
7516165.4000000000-------
7619464.6000000000-------
7719932.1-------
7819961.2-------
7917343.4000000000-------
8018924.2-------
8118574.1-------
8221350.6-------
8318594.6-------
8419823.1-------
8520844.4000000000-------
8619640.219044.068917683.427920498.21980.21080.00760.97620.0076
8717735.416601.589815360.352717932.38010.047500.73970
8819813.620928.006119279.250722702.59470.10920.99980.9470.5368
8922238.521674.794419663.751223869.08630.30730.95180.94020.7709
9020682.220653.909418669.448822826.23590.48980.07640.7340.4318
9117818.618615.084116683.063520746.19110.23190.02860.87890.0202
9221872.119731.537117552.977122150.49650.04140.93940.74350.1836
932211719789.901217534.742522302.81750.03480.05220.82850.2054
9421865.922304.534219660.943525263.84060.38570.54940.73620.8332
9523451.320288.515317763.166323132.5130.01460.13850.87850.3508
9620953.720645.22718000.577723634.57630.41990.03290.70510.448
9722497.321657.750118788.202524915.88730.30680.6640.68770.6877

\begin{tabular}{lllllllll}
\hline
Univariate ARIMA Extrapolation Forecast \tabularnewline
time & Y[t] & F[t] & 95% LB & 95% UB & p-value(H0: Y[t] = F[t]) & P(F[t]>Y[t-1]) & P(F[t]>Y[t-s]) & P(F[t]>Y[85]) \tabularnewline
73 & 19795.4 & - & - & - & - & - & - & - \tabularnewline
74 & 17574.9 & - & - & - & - & - & - & - \tabularnewline
75 & 16165.4000000000 & - & - & - & - & - & - & - \tabularnewline
76 & 19464.6000000000 & - & - & - & - & - & - & - \tabularnewline
77 & 19932.1 & - & - & - & - & - & - & - \tabularnewline
78 & 19961.2 & - & - & - & - & - & - & - \tabularnewline
79 & 17343.4000000000 & - & - & - & - & - & - & - \tabularnewline
80 & 18924.2 & - & - & - & - & - & - & - \tabularnewline
81 & 18574.1 & - & - & - & - & - & - & - \tabularnewline
82 & 21350.6 & - & - & - & - & - & - & - \tabularnewline
83 & 18594.6 & - & - & - & - & - & - & - \tabularnewline
84 & 19823.1 & - & - & - & - & - & - & - \tabularnewline
85 & 20844.4000000000 & - & - & - & - & - & - & - \tabularnewline
86 & 19640.2 & 19044.0689 & 17683.4279 & 20498.2198 & 0.2108 & 0.0076 & 0.9762 & 0.0076 \tabularnewline
87 & 17735.4 & 16601.5898 & 15360.3527 & 17932.3801 & 0.0475 & 0 & 0.7397 & 0 \tabularnewline
88 & 19813.6 & 20928.0061 & 19279.2507 & 22702.5947 & 0.1092 & 0.9998 & 0.947 & 0.5368 \tabularnewline
89 & 22238.5 & 21674.7944 & 19663.7512 & 23869.0863 & 0.3073 & 0.9518 & 0.9402 & 0.7709 \tabularnewline
90 & 20682.2 & 20653.9094 & 18669.4488 & 22826.2359 & 0.4898 & 0.0764 & 0.734 & 0.4318 \tabularnewline
91 & 17818.6 & 18615.0841 & 16683.0635 & 20746.1911 & 0.2319 & 0.0286 & 0.8789 & 0.0202 \tabularnewline
92 & 21872.1 & 19731.5371 & 17552.9771 & 22150.4965 & 0.0414 & 0.9394 & 0.7435 & 0.1836 \tabularnewline
93 & 22117 & 19789.9012 & 17534.7425 & 22302.8175 & 0.0348 & 0.0522 & 0.8285 & 0.2054 \tabularnewline
94 & 21865.9 & 22304.5342 & 19660.9435 & 25263.8406 & 0.3857 & 0.5494 & 0.7362 & 0.8332 \tabularnewline
95 & 23451.3 & 20288.5153 & 17763.1663 & 23132.513 & 0.0146 & 0.1385 & 0.8785 & 0.3508 \tabularnewline
96 & 20953.7 & 20645.227 & 18000.5777 & 23634.5763 & 0.4199 & 0.0329 & 0.7051 & 0.448 \tabularnewline
97 & 22497.3 & 21657.7501 & 18788.2025 & 24915.8873 & 0.3068 & 0.664 & 0.6877 & 0.6877 \tabularnewline
\hline
\end{tabular}
%Source: https://freestatistics.org/blog/index.php?pk=35094&T=1

[TABLE]
[ROW][C]Univariate ARIMA Extrapolation Forecast[/C][/ROW]
[ROW][C]time[/C][C]Y[t][/C][C]F[t][/C][C]95% LB[/C][C]95% UB[/C][C]p-value(H0: Y[t] = F[t])[/C][C]P(F[t]>Y[t-1])[/C][C]P(F[t]>Y[t-s])[/C][C]P(F[t]>Y[85])[/C][/ROW]
[ROW][C]73[/C][C]19795.4[/C][C]-[/C][C]-[/C][C]-[/C][C]-[/C][C]-[/C][C]-[/C][C]-[/C][/ROW]
[ROW][C]74[/C][C]17574.9[/C][C]-[/C][C]-[/C][C]-[/C][C]-[/C][C]-[/C][C]-[/C][C]-[/C][/ROW]
[ROW][C]75[/C][C]16165.4000000000[/C][C]-[/C][C]-[/C][C]-[/C][C]-[/C][C]-[/C][C]-[/C][C]-[/C][/ROW]
[ROW][C]76[/C][C]19464.6000000000[/C][C]-[/C][C]-[/C][C]-[/C][C]-[/C][C]-[/C][C]-[/C][C]-[/C][/ROW]
[ROW][C]77[/C][C]19932.1[/C][C]-[/C][C]-[/C][C]-[/C][C]-[/C][C]-[/C][C]-[/C][C]-[/C][/ROW]
[ROW][C]78[/C][C]19961.2[/C][C]-[/C][C]-[/C][C]-[/C][C]-[/C][C]-[/C][C]-[/C][C]-[/C][/ROW]
[ROW][C]79[/C][C]17343.4000000000[/C][C]-[/C][C]-[/C][C]-[/C][C]-[/C][C]-[/C][C]-[/C][C]-[/C][/ROW]
[ROW][C]80[/C][C]18924.2[/C][C]-[/C][C]-[/C][C]-[/C][C]-[/C][C]-[/C][C]-[/C][C]-[/C][/ROW]
[ROW][C]81[/C][C]18574.1[/C][C]-[/C][C]-[/C][C]-[/C][C]-[/C][C]-[/C][C]-[/C][C]-[/C][/ROW]
[ROW][C]82[/C][C]21350.6[/C][C]-[/C][C]-[/C][C]-[/C][C]-[/C][C]-[/C][C]-[/C][C]-[/C][/ROW]
[ROW][C]83[/C][C]18594.6[/C][C]-[/C][C]-[/C][C]-[/C][C]-[/C][C]-[/C][C]-[/C][C]-[/C][/ROW]
[ROW][C]84[/C][C]19823.1[/C][C]-[/C][C]-[/C][C]-[/C][C]-[/C][C]-[/C][C]-[/C][C]-[/C][/ROW]
[ROW][C]85[/C][C]20844.4000000000[/C][C]-[/C][C]-[/C][C]-[/C][C]-[/C][C]-[/C][C]-[/C][C]-[/C][/ROW]
[ROW][C]86[/C][C]19640.2[/C][C]19044.0689[/C][C]17683.4279[/C][C]20498.2198[/C][C]0.2108[/C][C]0.0076[/C][C]0.9762[/C][C]0.0076[/C][/ROW]
[ROW][C]87[/C][C]17735.4[/C][C]16601.5898[/C][C]15360.3527[/C][C]17932.3801[/C][C]0.0475[/C][C]0[/C][C]0.7397[/C][C]0[/C][/ROW]
[ROW][C]88[/C][C]19813.6[/C][C]20928.0061[/C][C]19279.2507[/C][C]22702.5947[/C][C]0.1092[/C][C]0.9998[/C][C]0.947[/C][C]0.5368[/C][/ROW]
[ROW][C]89[/C][C]22238.5[/C][C]21674.7944[/C][C]19663.7512[/C][C]23869.0863[/C][C]0.3073[/C][C]0.9518[/C][C]0.9402[/C][C]0.7709[/C][/ROW]
[ROW][C]90[/C][C]20682.2[/C][C]20653.9094[/C][C]18669.4488[/C][C]22826.2359[/C][C]0.4898[/C][C]0.0764[/C][C]0.734[/C][C]0.4318[/C][/ROW]
[ROW][C]91[/C][C]17818.6[/C][C]18615.0841[/C][C]16683.0635[/C][C]20746.1911[/C][C]0.2319[/C][C]0.0286[/C][C]0.8789[/C][C]0.0202[/C][/ROW]
[ROW][C]92[/C][C]21872.1[/C][C]19731.5371[/C][C]17552.9771[/C][C]22150.4965[/C][C]0.0414[/C][C]0.9394[/C][C]0.7435[/C][C]0.1836[/C][/ROW]
[ROW][C]93[/C][C]22117[/C][C]19789.9012[/C][C]17534.7425[/C][C]22302.8175[/C][C]0.0348[/C][C]0.0522[/C][C]0.8285[/C][C]0.2054[/C][/ROW]
[ROW][C]94[/C][C]21865.9[/C][C]22304.5342[/C][C]19660.9435[/C][C]25263.8406[/C][C]0.3857[/C][C]0.5494[/C][C]0.7362[/C][C]0.8332[/C][/ROW]
[ROW][C]95[/C][C]23451.3[/C][C]20288.5153[/C][C]17763.1663[/C][C]23132.513[/C][C]0.0146[/C][C]0.1385[/C][C]0.8785[/C][C]0.3508[/C][/ROW]
[ROW][C]96[/C][C]20953.7[/C][C]20645.227[/C][C]18000.5777[/C][C]23634.5763[/C][C]0.4199[/C][C]0.0329[/C][C]0.7051[/C][C]0.448[/C][/ROW]
[ROW][C]97[/C][C]22497.3[/C][C]21657.7501[/C][C]18788.2025[/C][C]24915.8873[/C][C]0.3068[/C][C]0.664[/C][C]0.6877[/C][C]0.6877[/C][/ROW]
[/TABLE]
Source: https://freestatistics.org/blog/index.php?pk=35094&T=1

Globally Unique Identifier (entire table): ba.freestatistics.org/blog/index.php?pk=35094&T=1

As an alternative you can also use a QR Code:  

The GUIDs for individual cells are displayed in the table below:

Univariate ARIMA Extrapolation Forecast
timeY[t]F[t]95% LB95% UBp-value(H0: Y[t] = F[t])P(F[t]>Y[t-1])P(F[t]>Y[t-s])P(F[t]>Y[85])
7319795.4-------
7417574.9-------
7516165.4000000000-------
7619464.6000000000-------
7719932.1-------
7819961.2-------
7917343.4000000000-------
8018924.2-------
8118574.1-------
8221350.6-------
8318594.6-------
8419823.1-------
8520844.4000000000-------
8619640.219044.068917683.427920498.21980.21080.00760.97620.0076
8717735.416601.589815360.352717932.38010.047500.73970
8819813.620928.006119279.250722702.59470.10920.99980.9470.5368
8922238.521674.794419663.751223869.08630.30730.95180.94020.7709
9020682.220653.909418669.448822826.23590.48980.07640.7340.4318
9117818.618615.084116683.063520746.19110.23190.02860.87890.0202
9221872.119731.537117552.977122150.49650.04140.93940.74350.1836
932211719789.901217534.742522302.81750.03480.05220.82850.2054
9421865.922304.534219660.943525263.84060.38570.54940.73620.8332
9523451.320288.515317763.166323132.5130.01460.13850.87850.3508
9620953.720645.22718000.577723634.57630.41990.03290.70510.448
9722497.321657.750118788.202524915.88730.30680.6640.68770.6877


Univariate ARIMA Extrapolation Forecast Performance
time% S.E.PEMAPESq.EMSERMSE
860.0390.03130.0026355372.297329614.3581172.0882
870.04090.06830.00571285525.5389107127.1282327.3028
880.0433-0.05320.00441241901.0124103491.751321.7013
890.05170.0260.0022317763.956526480.3297162.7278
900.05370.00141e-04800.359166.69668.1668
910.0584-0.04280.0036634386.862852865.5719229.9251
920.06250.10850.0094582009.7193381834.1433617.9273
930.06480.11760.00985415389.0489451282.4207671.7756
940.0677-0.01970.0016192400.000216033.3333126.6228
950.07150.15590.01310003207.2428833600.6036913.0173
960.07390.01490.001295155.6027929.633589.0485
970.07680.03880.0032704844.078658737.0065242.3572

\begin{tabular}{lllllllll}
\hline
Univariate ARIMA Extrapolation Forecast Performance \tabularnewline
time & % S.E. & PE & MAPE & Sq.E & MSE & RMSE \tabularnewline
86 & 0.039 & 0.0313 & 0.0026 & 355372.2973 & 29614.3581 & 172.0882 \tabularnewline
87 & 0.0409 & 0.0683 & 0.0057 & 1285525.5389 & 107127.1282 & 327.3028 \tabularnewline
88 & 0.0433 & -0.0532 & 0.0044 & 1241901.0124 & 103491.751 & 321.7013 \tabularnewline
89 & 0.0517 & 0.026 & 0.0022 & 317763.9565 & 26480.3297 & 162.7278 \tabularnewline
90 & 0.0537 & 0.0014 & 1e-04 & 800.3591 & 66.6966 & 8.1668 \tabularnewline
91 & 0.0584 & -0.0428 & 0.0036 & 634386.8628 & 52865.5719 & 229.9251 \tabularnewline
92 & 0.0625 & 0.1085 & 0.009 & 4582009.7193 & 381834.1433 & 617.9273 \tabularnewline
93 & 0.0648 & 0.1176 & 0.0098 & 5415389.0489 & 451282.4207 & 671.7756 \tabularnewline
94 & 0.0677 & -0.0197 & 0.0016 & 192400.0002 & 16033.3333 & 126.6228 \tabularnewline
95 & 0.0715 & 0.1559 & 0.013 & 10003207.2428 & 833600.6036 & 913.0173 \tabularnewline
96 & 0.0739 & 0.0149 & 0.0012 & 95155.602 & 7929.6335 & 89.0485 \tabularnewline
97 & 0.0768 & 0.0388 & 0.0032 & 704844.0786 & 58737.0065 & 242.3572 \tabularnewline
\hline
\end{tabular}
%Source: https://freestatistics.org/blog/index.php?pk=35094&T=2

[TABLE]
[ROW][C]Univariate ARIMA Extrapolation Forecast Performance[/C][/ROW]
[ROW][C]time[/C][C]% S.E.[/C][C]PE[/C][C]MAPE[/C][C]Sq.E[/C][C]MSE[/C][C]RMSE[/C][/ROW]
[ROW][C]86[/C][C]0.039[/C][C]0.0313[/C][C]0.0026[/C][C]355372.2973[/C][C]29614.3581[/C][C]172.0882[/C][/ROW]
[ROW][C]87[/C][C]0.0409[/C][C]0.0683[/C][C]0.0057[/C][C]1285525.5389[/C][C]107127.1282[/C][C]327.3028[/C][/ROW]
[ROW][C]88[/C][C]0.0433[/C][C]-0.0532[/C][C]0.0044[/C][C]1241901.0124[/C][C]103491.751[/C][C]321.7013[/C][/ROW]
[ROW][C]89[/C][C]0.0517[/C][C]0.026[/C][C]0.0022[/C][C]317763.9565[/C][C]26480.3297[/C][C]162.7278[/C][/ROW]
[ROW][C]90[/C][C]0.0537[/C][C]0.0014[/C][C]1e-04[/C][C]800.3591[/C][C]66.6966[/C][C]8.1668[/C][/ROW]
[ROW][C]91[/C][C]0.0584[/C][C]-0.0428[/C][C]0.0036[/C][C]634386.8628[/C][C]52865.5719[/C][C]229.9251[/C][/ROW]
[ROW][C]92[/C][C]0.0625[/C][C]0.1085[/C][C]0.009[/C][C]4582009.7193[/C][C]381834.1433[/C][C]617.9273[/C][/ROW]
[ROW][C]93[/C][C]0.0648[/C][C]0.1176[/C][C]0.0098[/C][C]5415389.0489[/C][C]451282.4207[/C][C]671.7756[/C][/ROW]
[ROW][C]94[/C][C]0.0677[/C][C]-0.0197[/C][C]0.0016[/C][C]192400.0002[/C][C]16033.3333[/C][C]126.6228[/C][/ROW]
[ROW][C]95[/C][C]0.0715[/C][C]0.1559[/C][C]0.013[/C][C]10003207.2428[/C][C]833600.6036[/C][C]913.0173[/C][/ROW]
[ROW][C]96[/C][C]0.0739[/C][C]0.0149[/C][C]0.0012[/C][C]95155.602[/C][C]7929.6335[/C][C]89.0485[/C][/ROW]
[ROW][C]97[/C][C]0.0768[/C][C]0.0388[/C][C]0.0032[/C][C]704844.0786[/C][C]58737.0065[/C][C]242.3572[/C][/ROW]
[/TABLE]
Source: https://freestatistics.org/blog/index.php?pk=35094&T=2

Globally Unique Identifier (entire table): ba.freestatistics.org/blog/index.php?pk=35094&T=2

As an alternative you can also use a QR Code:  

The GUIDs for individual cells are displayed in the table below:

Univariate ARIMA Extrapolation Forecast Performance
time% S.E.PEMAPESq.EMSERMSE
860.0390.03130.0026355372.297329614.3581172.0882
870.04090.06830.00571285525.5389107127.1282327.3028
880.0433-0.05320.00441241901.0124103491.751321.7013
890.05170.0260.0022317763.956526480.3297162.7278
900.05370.00141e-04800.359166.69668.1668
910.0584-0.04280.0036634386.862852865.5719229.9251
920.06250.10850.0094582009.7193381834.1433617.9273
930.06480.11760.00985415389.0489451282.4207671.7756
940.0677-0.01970.0016192400.000216033.3333126.6228
950.07150.15590.01310003207.2428833600.6036913.0173
960.07390.01490.001295155.6027929.633589.0485
970.07680.03880.0032704844.078658737.0065242.3572


Parameters (Session):
par1 = FALSE ; par2 = 0.1 ; par3 = 0 ; par4 = 1 ; par5 = 12 ; par6 = 3 ; par7 = 0 ; par8 = 2 ; par9 = 0 ;
Parameters (R input):
par1 = 12 ; par2 = 0.1 ; par3 = 1 ; par4 = 1 ; par5 = 12 ; par6 = 3 ; par7 = 0 ; par8 = 2 ; par9 = 1 ; par10 = FALSE ;
R code (references can be found in the software module):
par1 <- as.numeric(par1) #cut off periods
par2 <- as.numeric(par2) #lambda
par3 <- as.numeric(par3) #degree of non-seasonal differencing
par4 <- as.numeric(par4) #degree of seasonal differencing
par5 <- as.numeric(par5) #seasonal period
par6 <- as.numeric(par6) #p
par7 <- as.numeric(par7) #q
par8 <- as.numeric(par8) #P
par9 <- as.numeric(par9) #Q
if (par10 == 'TRUE') par10 <- TRUE
if (par10 == 'FALSE') par10 <- FALSE
if (par2 == 0) x <- log(x)
if (par2 != 0) x <- x^par2
lx <- length(x)
first <- lx - 2*par1
nx <- lx - par1
nx1 <- nx + 1
fx <- lx - nx
if (fx < 1) {
fx <- par5
nx1 <- lx + fx - 1
first <- lx - 2*fx
}
first <- 1
if (fx < 3) fx <- round(lx/10,0)
(arima.out <- arima(x[1:nx], order=c(par6,par3,par7), seasonal=list(order=c(par8,par4,par9), period=par5), include.mean=par10, method='ML'))
(forecast <- predict(arima.out,fx))
(lb <- forecast$pred - 1.96 * forecast$se)
(ub <- forecast$pred + 1.96 * forecast$se)
if (par2 == 0) {
x <- exp(x)
forecast$pred <- exp(forecast$pred)
lb <- exp(lb)
ub <- exp(ub)
}
if (par2 != 0) {
x <- x^(1/par2)
forecast$pred <- forecast$pred^(1/par2)
lb <- lb^(1/par2)
ub <- ub^(1/par2)
}
if (par2 < 0) {
olb <- lb
lb <- ub
ub <- olb
}
(actandfor <- c(x[1:nx], forecast$pred))
(perc.se <- (ub-forecast$pred)/1.96/forecast$pred)
bitmap(file='test1.png')
opar <- par(mar=c(4,4,2,2),las=1)
ylim <- c( min(x[first:nx],lb), max(x[first:nx],ub))
plot(x,ylim=ylim,type='n',xlim=c(first,lx))
usr <- par('usr')
rect(usr[1],usr[3],nx+1,usr[4],border=NA,col='lemonchiffon')
rect(nx1,usr[3],usr[2],usr[4],border=NA,col='lavender')
abline(h= (-3:3)*2 , col ='gray', lty =3)
polygon( c(nx1:lx,lx:nx1), c(lb,rev(ub)), col = 'orange', lty=2,border=NA)
lines(nx1:lx, lb , lty=2)
lines(nx1:lx, ub , lty=2)
lines(x, lwd=2)
lines(nx1:lx, forecast$pred , lwd=2 , col ='white')
box()
par(opar)
dev.off()
prob.dec <- array(NA, dim=fx)
prob.sdec <- array(NA, dim=fx)
prob.ldec <- array(NA, dim=fx)
prob.pval <- array(NA, dim=fx)
perf.pe <- array(0, dim=fx)
perf.mape <- array(0, dim=fx)
perf.se <- array(0, dim=fx)
perf.mse <- array(0, dim=fx)
perf.rmse <- array(0, dim=fx)
for (i in 1:fx) {
locSD <- (ub[i] - forecast$pred[i]) / 1.96
perf.pe[i] = (x[nx+i] - forecast$pred[i]) / forecast$pred[i]
perf.mape[i] = perf.mape[i] + abs(perf.pe[i])
perf.se[i] = (x[nx+i] - forecast$pred[i])^2
perf.mse[i] = perf.mse[i] + perf.se[i]
prob.dec[i] = pnorm((x[nx+i-1] - forecast$pred[i]) / locSD)
prob.sdec[i] = pnorm((x[nx+i-par5] - forecast$pred[i]) / locSD)
prob.ldec[i] = pnorm((x[nx] - forecast$pred[i]) / locSD)
prob.pval[i] = pnorm(abs(x[nx+i] - forecast$pred[i]) / locSD)
}
perf.mape = perf.mape / fx
perf.mse = perf.mse / fx
perf.rmse = sqrt(perf.mse)
bitmap(file='test2.png')
plot(forecast$pred, pch=19, type='b',main='ARIMA Extrapolation Forecast', ylab='Forecast and 95% CI', xlab='time',ylim=c(min(lb),max(ub)))
dum <- forecast$pred
dum[1:12] <- x[(nx+1):lx]
lines(dum, lty=1)
lines(ub,lty=3)
lines(lb,lty=3)
dev.off()
load(file='createtable')
a<-table.start()
a<-table.row.start(a)
a<-table.element(a,'Univariate ARIMA Extrapolation Forecast',9,TRUE)
a<-table.row.end(a)
a<-table.row.start(a)
a<-table.element(a,'time',1,header=TRUE)
a<-table.element(a,'Y[t]',1,header=TRUE)
a<-table.element(a,'F[t]',1,header=TRUE)
a<-table.element(a,'95% LB',1,header=TRUE)
a<-table.element(a,'95% UB',1,header=TRUE)
a<-table.element(a,'p-value
(H0: Y[t] = F[t])',1,header=TRUE)
a<-table.element(a,'P(F[t]>Y[t-1])',1,header=TRUE)
a<-table.element(a,'P(F[t]>Y[t-s])',1,header=TRUE)
mylab <- paste('P(F[t]>Y[',nx,sep='')
mylab <- paste(mylab,'])',sep='')
a<-table.element(a,mylab,1,header=TRUE)
a<-table.row.end(a)
for (i in (nx-par5):nx) {
a<-table.row.start(a)
a<-table.element(a,i,header=TRUE)
a<-table.element(a,x[i])
a<-table.element(a,'-')
a<-table.row.end(a)
}
for (i in 1:fx) {
a<-table.row.start(a)
a<-table.element(a,nx+i,header=TRUE)
a<-table.element(a,round(x[nx+i],4))
a<-table.element(a,round(forecast$pred[i],4))
a<-table.element(a,round(lb[i],4))
a<-table.element(a,round(ub[i],4))
a<-table.element(a,round((1-prob.pval[i]),4))
a<-table.element(a,round((1-prob.dec[i]),4))
a<-table.element(a,round((1-prob.sdec[i]),4))
a<-table.element(a,round((1-prob.ldec[i]),4))
a<-table.row.end(a)
}
a<-table.end(a)
table.save(a,file='mytable.tab')
a<-table.start()
a<-table.row.start(a)
a<-table.element(a,'Univariate ARIMA Extrapolation Forecast Performance',7,TRUE)
a<-table.row.end(a)
a<-table.row.start(a)
a<-table.element(a,'time',1,header=TRUE)
a<-table.element(a,'% S.E.',1,header=TRUE)
a<-table.element(a,'PE',1,header=TRUE)
a<-table.element(a,'MAPE',1,header=TRUE)
a<-table.element(a,'Sq.E',1,header=TRUE)
a<-table.element(a,'MSE',1,header=TRUE)
a<-table.element(a,'RMSE',1,header=TRUE)
a<-table.row.end(a)
for (i in 1:fx) {
a<-table.row.start(a)
a<-table.element(a,nx+i,header=TRUE)
a<-table.element(a,round(perc.se[i],4))
a<-table.element(a,round(perf.pe[i],4))
a<-table.element(a,round(perf.mape[i],4))
a<-table.element(a,round(perf.se[i],4))
a<-table.element(a,round(perf.mse[i],4))
a<-table.element(a,round(perf.rmse[i],4))
a<-table.row.end(a)
}
a<-table.end(a)
table.save(a,file='mytable1.tab')