Free Statistics

of Irreproducible Research!

Author's title

Author*Unverified author*
R Software Modulerwasp_autocorrelation.wasp
Title produced by software(Partial) Autocorrelation Function
Date of computationFri, 19 Dec 2008 03:57:15 -0700
Cite this page as followsStatistical Computations at FreeStatistics.org, Office for Research Development and Education, URL https://freestatistics.org/blog/index.php?v=date/2008/Dec/19/t1229684300vxloqzvukyy1zn7.htm/, Retrieved Wed, 15 May 2024 17:56:04 +0000
Statistical Computations at FreeStatistics.org, Office for Research Development and Education, URL https://freestatistics.org/blog/index.php?pk=35046, Retrieved Wed, 15 May 2024 17:56:04 +0000
QR Codes:

Original text written by user:
IsPrivate?No (this computation is public)
User-defined keywords
Estimated Impact198
Family? (F = Feedback message, R = changed R code, M = changed R Module, P = changed Parameters, D = changed Data)
-     [Univariate Data Series] [] [2008-12-13 14:41:57] [996314793dac993597edc1ca2281ff39]
- RMPD    [(Partial) Autocorrelation Function] [] [2008-12-19 10:57:15] [e02910eed3830f1815f587e12f46cbdb] [Current]
Feedback Forum

Post a new message
Dataseries X:
101.7
101.9
102
102.2
102.4
102.6
102.6
102.5
102.5
102.6
102.7
102.9
103.1
103.2
103.2
103
102.8
102.6
102.4
102.2
101.9
101.6
101.3
101.2
111.7
111.4
111.1
111.1
111.3
111.9
112.4
112.9
113
113
112.7
112.4
112.3
112.5
112.8
113.2
114
114.9
115.6
115.5
115
114.9
115.2
115.4
115
114.6
114.5
114.4
113.9
113.2
112.7
112.6
112.5
112.3
112
111.7
119.2


Summary of computational transaction
Raw Inputview raw input (R code)
Raw Outputview raw output of R engine
Computing time1 seconds
R Server'George Udny Yule' @ 72.249.76.132

\begin{tabular}{lllllllll}
\hline
Summary of computational transaction \tabularnewline
Raw Input & view raw input (R code)  \tabularnewline
Raw Output & view raw output of R engine  \tabularnewline
Computing time & 1 seconds \tabularnewline
R Server & 'George Udny Yule' @ 72.249.76.132 \tabularnewline
\hline
\end{tabular}
%Source: https://freestatistics.org/blog/index.php?pk=35046&T=0

[TABLE]
[ROW][C]Summary of computational transaction[/C][/ROW]
[ROW][C]Raw Input[/C][C]view raw input (R code) [/C][/ROW]
[ROW][C]Raw Output[/C][C]view raw output of R engine [/C][/ROW]
[ROW][C]Computing time[/C][C]1 seconds[/C][/ROW]
[ROW][C]R Server[/C][C]'George Udny Yule' @ 72.249.76.132[/C][/ROW]
[/TABLE]
Source: https://freestatistics.org/blog/index.php?pk=35046&T=0

Globally Unique Identifier (entire table): ba.freestatistics.org/blog/index.php?pk=35046&T=0

As an alternative you can also use a QR Code:  

The GUIDs for individual cells are displayed in the table below:

Summary of computational transaction
Raw Inputview raw input (R code)
Raw Outputview raw output of R engine
Computing time1 seconds
R Server'George Udny Yule' @ 72.249.76.132


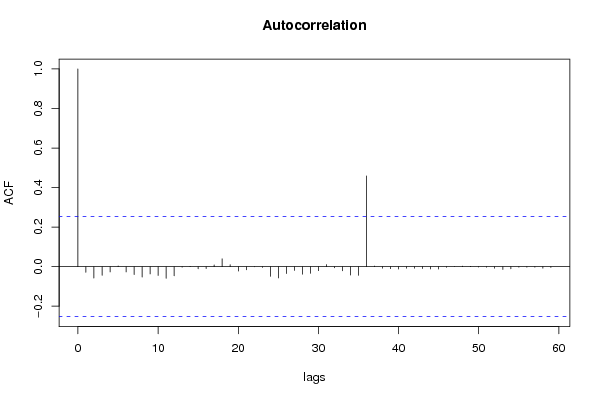
Autocorrelation Function
Time lag kACF(k)T-STATP-value
1-0.028771-0.22290.4122
2-0.05796-0.4490.327539
3-0.043968-0.34060.367307
4-0.026819-0.20770.418068
50.0033880.02620.489575
6-0.026999-0.20910.417527
7-0.039884-0.30890.37922
8-0.053062-0.4110.341264
9-0.036668-0.2840.388682
10-0.044453-0.34430.3659
11-0.058804-0.45550.325199
12-0.046596-0.36090.359709
13-0.002948-0.02280.490928
140.0013060.01010.49598
15-0.010778-0.08350.466872
16-0.010077-0.07810.46902
170.0085380.06610.473746
180.0394210.30540.380577
190.009660.07480.4703
20-0.022193-0.17190.432045
21-0.016044-0.12430.450754
22-0.000929-0.00720.497142
23-0.004309-0.03340.486741
24-0.048952-0.37920.352945
25-0.056896-0.44070.330501
26-0.035005-0.27110.393604
27-0.019034-0.14740.44164
28-0.038401-0.29750.383574
29-0.033515-0.25960.398028
30-0.020711-0.16040.436542
310.0104060.08060.468013
32-0.006122-0.04740.481167
33-0.021433-0.1660.43435
34-0.042504-0.32920.371561
35-0.043698-0.33850.368091
360.458663.55280.000375
370.0031510.02440.490304
38-0.007686-0.05950.476363
39-0.010644-0.08240.467283
40-0.012369-0.09580.461995
41-0.007776-0.06020.476084
42-0.007891-0.06110.475732
43-0.009577-0.07420.470557
44-0.011362-0.0880.465082
45-0.012272-0.09510.462294
46-0.003658-0.02830.488746
47-0.000298-0.00230.499083
480.002610.02020.49197
490.0019330.0150.494051
50-0.002397-0.01860.492625
51-0.002546-0.01970.492165
52-0.007985-0.06180.475444
53-0.014124-0.10940.456623
54-0.010963-0.08490.466304
55-0.002518-0.01950.492251
56-0.002673-0.02070.491776
57-0.002941-0.02280.490949
58-0.007918-0.06130.47565
59-0.003941-0.03050.487873
60NANANA

\begin{tabular}{lllllllll}
\hline
Autocorrelation Function \tabularnewline
Time lag k & ACF(k) & T-STAT & P-value \tabularnewline
1 & -0.028771 & -0.2229 & 0.4122 \tabularnewline
2 & -0.05796 & -0.449 & 0.327539 \tabularnewline
3 & -0.043968 & -0.3406 & 0.367307 \tabularnewline
4 & -0.026819 & -0.2077 & 0.418068 \tabularnewline
5 & 0.003388 & 0.0262 & 0.489575 \tabularnewline
6 & -0.026999 & -0.2091 & 0.417527 \tabularnewline
7 & -0.039884 & -0.3089 & 0.37922 \tabularnewline
8 & -0.053062 & -0.411 & 0.341264 \tabularnewline
9 & -0.036668 & -0.284 & 0.388682 \tabularnewline
10 & -0.044453 & -0.3443 & 0.3659 \tabularnewline
11 & -0.058804 & -0.4555 & 0.325199 \tabularnewline
12 & -0.046596 & -0.3609 & 0.359709 \tabularnewline
13 & -0.002948 & -0.0228 & 0.490928 \tabularnewline
14 & 0.001306 & 0.0101 & 0.49598 \tabularnewline
15 & -0.010778 & -0.0835 & 0.466872 \tabularnewline
16 & -0.010077 & -0.0781 & 0.46902 \tabularnewline
17 & 0.008538 & 0.0661 & 0.473746 \tabularnewline
18 & 0.039421 & 0.3054 & 0.380577 \tabularnewline
19 & 0.00966 & 0.0748 & 0.4703 \tabularnewline
20 & -0.022193 & -0.1719 & 0.432045 \tabularnewline
21 & -0.016044 & -0.1243 & 0.450754 \tabularnewline
22 & -0.000929 & -0.0072 & 0.497142 \tabularnewline
23 & -0.004309 & -0.0334 & 0.486741 \tabularnewline
24 & -0.048952 & -0.3792 & 0.352945 \tabularnewline
25 & -0.056896 & -0.4407 & 0.330501 \tabularnewline
26 & -0.035005 & -0.2711 & 0.393604 \tabularnewline
27 & -0.019034 & -0.1474 & 0.44164 \tabularnewline
28 & -0.038401 & -0.2975 & 0.383574 \tabularnewline
29 & -0.033515 & -0.2596 & 0.398028 \tabularnewline
30 & -0.020711 & -0.1604 & 0.436542 \tabularnewline
31 & 0.010406 & 0.0806 & 0.468013 \tabularnewline
32 & -0.006122 & -0.0474 & 0.481167 \tabularnewline
33 & -0.021433 & -0.166 & 0.43435 \tabularnewline
34 & -0.042504 & -0.3292 & 0.371561 \tabularnewline
35 & -0.043698 & -0.3385 & 0.368091 \tabularnewline
36 & 0.45866 & 3.5528 & 0.000375 \tabularnewline
37 & 0.003151 & 0.0244 & 0.490304 \tabularnewline
38 & -0.007686 & -0.0595 & 0.476363 \tabularnewline
39 & -0.010644 & -0.0824 & 0.467283 \tabularnewline
40 & -0.012369 & -0.0958 & 0.461995 \tabularnewline
41 & -0.007776 & -0.0602 & 0.476084 \tabularnewline
42 & -0.007891 & -0.0611 & 0.475732 \tabularnewline
43 & -0.009577 & -0.0742 & 0.470557 \tabularnewline
44 & -0.011362 & -0.088 & 0.465082 \tabularnewline
45 & -0.012272 & -0.0951 & 0.462294 \tabularnewline
46 & -0.003658 & -0.0283 & 0.488746 \tabularnewline
47 & -0.000298 & -0.0023 & 0.499083 \tabularnewline
48 & 0.00261 & 0.0202 & 0.49197 \tabularnewline
49 & 0.001933 & 0.015 & 0.494051 \tabularnewline
50 & -0.002397 & -0.0186 & 0.492625 \tabularnewline
51 & -0.002546 & -0.0197 & 0.492165 \tabularnewline
52 & -0.007985 & -0.0618 & 0.475444 \tabularnewline
53 & -0.014124 & -0.1094 & 0.456623 \tabularnewline
54 & -0.010963 & -0.0849 & 0.466304 \tabularnewline
55 & -0.002518 & -0.0195 & 0.492251 \tabularnewline
56 & -0.002673 & -0.0207 & 0.491776 \tabularnewline
57 & -0.002941 & -0.0228 & 0.490949 \tabularnewline
58 & -0.007918 & -0.0613 & 0.47565 \tabularnewline
59 & -0.003941 & -0.0305 & 0.487873 \tabularnewline
60 & NA & NA & NA \tabularnewline
\hline
\end{tabular}
%Source: https://freestatistics.org/blog/index.php?pk=35046&T=1

[TABLE]
[ROW][C]Autocorrelation Function[/C][/ROW]
[ROW][C]Time lag k[/C][C]ACF(k)[/C][C]T-STAT[/C][C]P-value[/C][/ROW]
[ROW][C]1[/C][C]-0.028771[/C][C]-0.2229[/C][C]0.4122[/C][/ROW]
[ROW][C]2[/C][C]-0.05796[/C][C]-0.449[/C][C]0.327539[/C][/ROW]
[ROW][C]3[/C][C]-0.043968[/C][C]-0.3406[/C][C]0.367307[/C][/ROW]
[ROW][C]4[/C][C]-0.026819[/C][C]-0.2077[/C][C]0.418068[/C][/ROW]
[ROW][C]5[/C][C]0.003388[/C][C]0.0262[/C][C]0.489575[/C][/ROW]
[ROW][C]6[/C][C]-0.026999[/C][C]-0.2091[/C][C]0.417527[/C][/ROW]
[ROW][C]7[/C][C]-0.039884[/C][C]-0.3089[/C][C]0.37922[/C][/ROW]
[ROW][C]8[/C][C]-0.053062[/C][C]-0.411[/C][C]0.341264[/C][/ROW]
[ROW][C]9[/C][C]-0.036668[/C][C]-0.284[/C][C]0.388682[/C][/ROW]
[ROW][C]10[/C][C]-0.044453[/C][C]-0.3443[/C][C]0.3659[/C][/ROW]
[ROW][C]11[/C][C]-0.058804[/C][C]-0.4555[/C][C]0.325199[/C][/ROW]
[ROW][C]12[/C][C]-0.046596[/C][C]-0.3609[/C][C]0.359709[/C][/ROW]
[ROW][C]13[/C][C]-0.002948[/C][C]-0.0228[/C][C]0.490928[/C][/ROW]
[ROW][C]14[/C][C]0.001306[/C][C]0.0101[/C][C]0.49598[/C][/ROW]
[ROW][C]15[/C][C]-0.010778[/C][C]-0.0835[/C][C]0.466872[/C][/ROW]
[ROW][C]16[/C][C]-0.010077[/C][C]-0.0781[/C][C]0.46902[/C][/ROW]
[ROW][C]17[/C][C]0.008538[/C][C]0.0661[/C][C]0.473746[/C][/ROW]
[ROW][C]18[/C][C]0.039421[/C][C]0.3054[/C][C]0.380577[/C][/ROW]
[ROW][C]19[/C][C]0.00966[/C][C]0.0748[/C][C]0.4703[/C][/ROW]
[ROW][C]20[/C][C]-0.022193[/C][C]-0.1719[/C][C]0.432045[/C][/ROW]
[ROW][C]21[/C][C]-0.016044[/C][C]-0.1243[/C][C]0.450754[/C][/ROW]
[ROW][C]22[/C][C]-0.000929[/C][C]-0.0072[/C][C]0.497142[/C][/ROW]
[ROW][C]23[/C][C]-0.004309[/C][C]-0.0334[/C][C]0.486741[/C][/ROW]
[ROW][C]24[/C][C]-0.048952[/C][C]-0.3792[/C][C]0.352945[/C][/ROW]
[ROW][C]25[/C][C]-0.056896[/C][C]-0.4407[/C][C]0.330501[/C][/ROW]
[ROW][C]26[/C][C]-0.035005[/C][C]-0.2711[/C][C]0.393604[/C][/ROW]
[ROW][C]27[/C][C]-0.019034[/C][C]-0.1474[/C][C]0.44164[/C][/ROW]
[ROW][C]28[/C][C]-0.038401[/C][C]-0.2975[/C][C]0.383574[/C][/ROW]
[ROW][C]29[/C][C]-0.033515[/C][C]-0.2596[/C][C]0.398028[/C][/ROW]
[ROW][C]30[/C][C]-0.020711[/C][C]-0.1604[/C][C]0.436542[/C][/ROW]
[ROW][C]31[/C][C]0.010406[/C][C]0.0806[/C][C]0.468013[/C][/ROW]
[ROW][C]32[/C][C]-0.006122[/C][C]-0.0474[/C][C]0.481167[/C][/ROW]
[ROW][C]33[/C][C]-0.021433[/C][C]-0.166[/C][C]0.43435[/C][/ROW]
[ROW][C]34[/C][C]-0.042504[/C][C]-0.3292[/C][C]0.371561[/C][/ROW]
[ROW][C]35[/C][C]-0.043698[/C][C]-0.3385[/C][C]0.368091[/C][/ROW]
[ROW][C]36[/C][C]0.45866[/C][C]3.5528[/C][C]0.000375[/C][/ROW]
[ROW][C]37[/C][C]0.003151[/C][C]0.0244[/C][C]0.490304[/C][/ROW]
[ROW][C]38[/C][C]-0.007686[/C][C]-0.0595[/C][C]0.476363[/C][/ROW]
[ROW][C]39[/C][C]-0.010644[/C][C]-0.0824[/C][C]0.467283[/C][/ROW]
[ROW][C]40[/C][C]-0.012369[/C][C]-0.0958[/C][C]0.461995[/C][/ROW]
[ROW][C]41[/C][C]-0.007776[/C][C]-0.0602[/C][C]0.476084[/C][/ROW]
[ROW][C]42[/C][C]-0.007891[/C][C]-0.0611[/C][C]0.475732[/C][/ROW]
[ROW][C]43[/C][C]-0.009577[/C][C]-0.0742[/C][C]0.470557[/C][/ROW]
[ROW][C]44[/C][C]-0.011362[/C][C]-0.088[/C][C]0.465082[/C][/ROW]
[ROW][C]45[/C][C]-0.012272[/C][C]-0.0951[/C][C]0.462294[/C][/ROW]
[ROW][C]46[/C][C]-0.003658[/C][C]-0.0283[/C][C]0.488746[/C][/ROW]
[ROW][C]47[/C][C]-0.000298[/C][C]-0.0023[/C][C]0.499083[/C][/ROW]
[ROW][C]48[/C][C]0.00261[/C][C]0.0202[/C][C]0.49197[/C][/ROW]
[ROW][C]49[/C][C]0.001933[/C][C]0.015[/C][C]0.494051[/C][/ROW]
[ROW][C]50[/C][C]-0.002397[/C][C]-0.0186[/C][C]0.492625[/C][/ROW]
[ROW][C]51[/C][C]-0.002546[/C][C]-0.0197[/C][C]0.492165[/C][/ROW]
[ROW][C]52[/C][C]-0.007985[/C][C]-0.0618[/C][C]0.475444[/C][/ROW]
[ROW][C]53[/C][C]-0.014124[/C][C]-0.1094[/C][C]0.456623[/C][/ROW]
[ROW][C]54[/C][C]-0.010963[/C][C]-0.0849[/C][C]0.466304[/C][/ROW]
[ROW][C]55[/C][C]-0.002518[/C][C]-0.0195[/C][C]0.492251[/C][/ROW]
[ROW][C]56[/C][C]-0.002673[/C][C]-0.0207[/C][C]0.491776[/C][/ROW]
[ROW][C]57[/C][C]-0.002941[/C][C]-0.0228[/C][C]0.490949[/C][/ROW]
[ROW][C]58[/C][C]-0.007918[/C][C]-0.0613[/C][C]0.47565[/C][/ROW]
[ROW][C]59[/C][C]-0.003941[/C][C]-0.0305[/C][C]0.487873[/C][/ROW]
[ROW][C]60[/C][C]NA[/C][C]NA[/C][C]NA[/C][/ROW]
[/TABLE]
Source: https://freestatistics.org/blog/index.php?pk=35046&T=1

Globally Unique Identifier (entire table): ba.freestatistics.org/blog/index.php?pk=35046&T=1

As an alternative you can also use a QR Code:  

The GUIDs for individual cells are displayed in the table below:

Autocorrelation Function
Time lag kACF(k)T-STATP-value
1-0.028771-0.22290.4122
2-0.05796-0.4490.327539
3-0.043968-0.34060.367307
4-0.026819-0.20770.418068
50.0033880.02620.489575
6-0.026999-0.20910.417527
7-0.039884-0.30890.37922
8-0.053062-0.4110.341264
9-0.036668-0.2840.388682
10-0.044453-0.34430.3659
11-0.058804-0.45550.325199
12-0.046596-0.36090.359709
13-0.002948-0.02280.490928
140.0013060.01010.49598
15-0.010778-0.08350.466872
16-0.010077-0.07810.46902
170.0085380.06610.473746
180.0394210.30540.380577
190.009660.07480.4703
20-0.022193-0.17190.432045
21-0.016044-0.12430.450754
22-0.000929-0.00720.497142
23-0.004309-0.03340.486741
24-0.048952-0.37920.352945
25-0.056896-0.44070.330501
26-0.035005-0.27110.393604
27-0.019034-0.14740.44164
28-0.038401-0.29750.383574
29-0.033515-0.25960.398028
30-0.020711-0.16040.436542
310.0104060.08060.468013
32-0.006122-0.04740.481167
33-0.021433-0.1660.43435
34-0.042504-0.32920.371561
35-0.043698-0.33850.368091
360.458663.55280.000375
370.0031510.02440.490304
38-0.007686-0.05950.476363
39-0.010644-0.08240.467283
40-0.012369-0.09580.461995
41-0.007776-0.06020.476084
42-0.007891-0.06110.475732
43-0.009577-0.07420.470557
44-0.011362-0.0880.465082
45-0.012272-0.09510.462294
46-0.003658-0.02830.488746
47-0.000298-0.00230.499083
480.002610.02020.49197
490.0019330.0150.494051
50-0.002397-0.01860.492625
51-0.002546-0.01970.492165
52-0.007985-0.06180.475444
53-0.014124-0.10940.456623
54-0.010963-0.08490.466304
55-0.002518-0.01950.492251
56-0.002673-0.02070.491776
57-0.002941-0.02280.490949
58-0.007918-0.06130.47565
59-0.003941-0.03050.487873
60NANANA


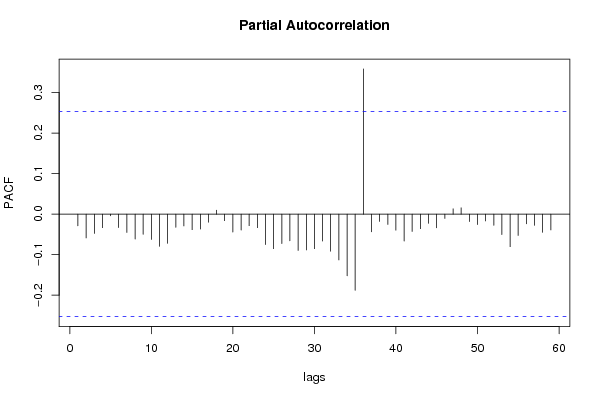
Partial Autocorrelation Function
Time lag kPACF(k)T-STATP-value
1-0.028771-0.22290.4122
2-0.058837-0.45570.325108
3-0.047631-0.36890.356734
4-0.033365-0.25840.398475
5-0.004102-0.03180.487378
6-0.033024-0.25580.399489
7-0.045188-0.350.363772
8-0.06141-0.47570.318016
9-0.049916-0.38660.350193
10-0.062372-0.48310.31538
11-0.079428-0.61530.270358
12-0.072084-0.55840.289339
13-0.032441-0.25130.401225
14-0.029028-0.22490.411429
15-0.038481-0.29810.383339
16-0.036866-0.28560.388097
17-0.019819-0.15350.439252
180.0097760.07570.469944
19-0.016115-0.12480.450539
20-0.044137-0.34190.366816
21-0.039332-0.30470.380838
22-0.028476-0.22060.413087
23-0.033315-0.25810.398622
24-0.075042-0.58130.281617
25-0.085141-0.65950.256049
26-0.072636-0.56260.28789
27-0.06576-0.50940.306178
28-0.089696-0.69480.244937
29-0.088274-0.68380.248378
30-0.085238-0.66030.25581
31-0.066559-0.51560.304026
32-0.091477-0.70860.240665
33-0.113117-0.87620.192208
34-0.152094-1.17810.121701
35-0.188101-1.4570.075162
360.3583432.77570.003668
37-0.043787-0.33920.367832
38-0.018108-0.14030.444461
39-0.025581-0.19820.421799
40-0.039641-0.30710.37993
41-0.066409-0.51440.304431
42-0.042838-0.33180.37059
43-0.035912-0.27820.390918
44-0.022634-0.17530.43071
45-0.033838-0.26210.397069
46-0.010754-0.08330.466944
470.0131590.10190.459578
480.0155480.12040.45227
49-0.018391-0.14250.443597
50-0.025666-0.19880.421542
51-0.016912-0.1310.448107
52-0.027547-0.21340.415879
53-0.050416-0.39050.348766
54-0.080367-0.62250.26798
55-0.052468-0.40640.34294
56-0.024034-0.18620.426471
57-0.027739-0.21490.415301
58-0.044837-0.34730.364788
59-0.039066-0.30260.381619
60NANANA

\begin{tabular}{lllllllll}
\hline
Partial Autocorrelation Function \tabularnewline
Time lag k & PACF(k) & T-STAT & P-value \tabularnewline
1 & -0.028771 & -0.2229 & 0.4122 \tabularnewline
2 & -0.058837 & -0.4557 & 0.325108 \tabularnewline
3 & -0.047631 & -0.3689 & 0.356734 \tabularnewline
4 & -0.033365 & -0.2584 & 0.398475 \tabularnewline
5 & -0.004102 & -0.0318 & 0.487378 \tabularnewline
6 & -0.033024 & -0.2558 & 0.399489 \tabularnewline
7 & -0.045188 & -0.35 & 0.363772 \tabularnewline
8 & -0.06141 & -0.4757 & 0.318016 \tabularnewline
9 & -0.049916 & -0.3866 & 0.350193 \tabularnewline
10 & -0.062372 & -0.4831 & 0.31538 \tabularnewline
11 & -0.079428 & -0.6153 & 0.270358 \tabularnewline
12 & -0.072084 & -0.5584 & 0.289339 \tabularnewline
13 & -0.032441 & -0.2513 & 0.401225 \tabularnewline
14 & -0.029028 & -0.2249 & 0.411429 \tabularnewline
15 & -0.038481 & -0.2981 & 0.383339 \tabularnewline
16 & -0.036866 & -0.2856 & 0.388097 \tabularnewline
17 & -0.019819 & -0.1535 & 0.439252 \tabularnewline
18 & 0.009776 & 0.0757 & 0.469944 \tabularnewline
19 & -0.016115 & -0.1248 & 0.450539 \tabularnewline
20 & -0.044137 & -0.3419 & 0.366816 \tabularnewline
21 & -0.039332 & -0.3047 & 0.380838 \tabularnewline
22 & -0.028476 & -0.2206 & 0.413087 \tabularnewline
23 & -0.033315 & -0.2581 & 0.398622 \tabularnewline
24 & -0.075042 & -0.5813 & 0.281617 \tabularnewline
25 & -0.085141 & -0.6595 & 0.256049 \tabularnewline
26 & -0.072636 & -0.5626 & 0.28789 \tabularnewline
27 & -0.06576 & -0.5094 & 0.306178 \tabularnewline
28 & -0.089696 & -0.6948 & 0.244937 \tabularnewline
29 & -0.088274 & -0.6838 & 0.248378 \tabularnewline
30 & -0.085238 & -0.6603 & 0.25581 \tabularnewline
31 & -0.066559 & -0.5156 & 0.304026 \tabularnewline
32 & -0.091477 & -0.7086 & 0.240665 \tabularnewline
33 & -0.113117 & -0.8762 & 0.192208 \tabularnewline
34 & -0.152094 & -1.1781 & 0.121701 \tabularnewline
35 & -0.188101 & -1.457 & 0.075162 \tabularnewline
36 & 0.358343 & 2.7757 & 0.003668 \tabularnewline
37 & -0.043787 & -0.3392 & 0.367832 \tabularnewline
38 & -0.018108 & -0.1403 & 0.444461 \tabularnewline
39 & -0.025581 & -0.1982 & 0.421799 \tabularnewline
40 & -0.039641 & -0.3071 & 0.37993 \tabularnewline
41 & -0.066409 & -0.5144 & 0.304431 \tabularnewline
42 & -0.042838 & -0.3318 & 0.37059 \tabularnewline
43 & -0.035912 & -0.2782 & 0.390918 \tabularnewline
44 & -0.022634 & -0.1753 & 0.43071 \tabularnewline
45 & -0.033838 & -0.2621 & 0.397069 \tabularnewline
46 & -0.010754 & -0.0833 & 0.466944 \tabularnewline
47 & 0.013159 & 0.1019 & 0.459578 \tabularnewline
48 & 0.015548 & 0.1204 & 0.45227 \tabularnewline
49 & -0.018391 & -0.1425 & 0.443597 \tabularnewline
50 & -0.025666 & -0.1988 & 0.421542 \tabularnewline
51 & -0.016912 & -0.131 & 0.448107 \tabularnewline
52 & -0.027547 & -0.2134 & 0.415879 \tabularnewline
53 & -0.050416 & -0.3905 & 0.348766 \tabularnewline
54 & -0.080367 & -0.6225 & 0.26798 \tabularnewline
55 & -0.052468 & -0.4064 & 0.34294 \tabularnewline
56 & -0.024034 & -0.1862 & 0.426471 \tabularnewline
57 & -0.027739 & -0.2149 & 0.415301 \tabularnewline
58 & -0.044837 & -0.3473 & 0.364788 \tabularnewline
59 & -0.039066 & -0.3026 & 0.381619 \tabularnewline
60 & NA & NA & NA \tabularnewline
\hline
\end{tabular}
%Source: https://freestatistics.org/blog/index.php?pk=35046&T=2

[TABLE]
[ROW][C]Partial Autocorrelation Function[/C][/ROW]
[ROW][C]Time lag k[/C][C]PACF(k)[/C][C]T-STAT[/C][C]P-value[/C][/ROW]
[ROW][C]1[/C][C]-0.028771[/C][C]-0.2229[/C][C]0.4122[/C][/ROW]
[ROW][C]2[/C][C]-0.058837[/C][C]-0.4557[/C][C]0.325108[/C][/ROW]
[ROW][C]3[/C][C]-0.047631[/C][C]-0.3689[/C][C]0.356734[/C][/ROW]
[ROW][C]4[/C][C]-0.033365[/C][C]-0.2584[/C][C]0.398475[/C][/ROW]
[ROW][C]5[/C][C]-0.004102[/C][C]-0.0318[/C][C]0.487378[/C][/ROW]
[ROW][C]6[/C][C]-0.033024[/C][C]-0.2558[/C][C]0.399489[/C][/ROW]
[ROW][C]7[/C][C]-0.045188[/C][C]-0.35[/C][C]0.363772[/C][/ROW]
[ROW][C]8[/C][C]-0.06141[/C][C]-0.4757[/C][C]0.318016[/C][/ROW]
[ROW][C]9[/C][C]-0.049916[/C][C]-0.3866[/C][C]0.350193[/C][/ROW]
[ROW][C]10[/C][C]-0.062372[/C][C]-0.4831[/C][C]0.31538[/C][/ROW]
[ROW][C]11[/C][C]-0.079428[/C][C]-0.6153[/C][C]0.270358[/C][/ROW]
[ROW][C]12[/C][C]-0.072084[/C][C]-0.5584[/C][C]0.289339[/C][/ROW]
[ROW][C]13[/C][C]-0.032441[/C][C]-0.2513[/C][C]0.401225[/C][/ROW]
[ROW][C]14[/C][C]-0.029028[/C][C]-0.2249[/C][C]0.411429[/C][/ROW]
[ROW][C]15[/C][C]-0.038481[/C][C]-0.2981[/C][C]0.383339[/C][/ROW]
[ROW][C]16[/C][C]-0.036866[/C][C]-0.2856[/C][C]0.388097[/C][/ROW]
[ROW][C]17[/C][C]-0.019819[/C][C]-0.1535[/C][C]0.439252[/C][/ROW]
[ROW][C]18[/C][C]0.009776[/C][C]0.0757[/C][C]0.469944[/C][/ROW]
[ROW][C]19[/C][C]-0.016115[/C][C]-0.1248[/C][C]0.450539[/C][/ROW]
[ROW][C]20[/C][C]-0.044137[/C][C]-0.3419[/C][C]0.366816[/C][/ROW]
[ROW][C]21[/C][C]-0.039332[/C][C]-0.3047[/C][C]0.380838[/C][/ROW]
[ROW][C]22[/C][C]-0.028476[/C][C]-0.2206[/C][C]0.413087[/C][/ROW]
[ROW][C]23[/C][C]-0.033315[/C][C]-0.2581[/C][C]0.398622[/C][/ROW]
[ROW][C]24[/C][C]-0.075042[/C][C]-0.5813[/C][C]0.281617[/C][/ROW]
[ROW][C]25[/C][C]-0.085141[/C][C]-0.6595[/C][C]0.256049[/C][/ROW]
[ROW][C]26[/C][C]-0.072636[/C][C]-0.5626[/C][C]0.28789[/C][/ROW]
[ROW][C]27[/C][C]-0.06576[/C][C]-0.5094[/C][C]0.306178[/C][/ROW]
[ROW][C]28[/C][C]-0.089696[/C][C]-0.6948[/C][C]0.244937[/C][/ROW]
[ROW][C]29[/C][C]-0.088274[/C][C]-0.6838[/C][C]0.248378[/C][/ROW]
[ROW][C]30[/C][C]-0.085238[/C][C]-0.6603[/C][C]0.25581[/C][/ROW]
[ROW][C]31[/C][C]-0.066559[/C][C]-0.5156[/C][C]0.304026[/C][/ROW]
[ROW][C]32[/C][C]-0.091477[/C][C]-0.7086[/C][C]0.240665[/C][/ROW]
[ROW][C]33[/C][C]-0.113117[/C][C]-0.8762[/C][C]0.192208[/C][/ROW]
[ROW][C]34[/C][C]-0.152094[/C][C]-1.1781[/C][C]0.121701[/C][/ROW]
[ROW][C]35[/C][C]-0.188101[/C][C]-1.457[/C][C]0.075162[/C][/ROW]
[ROW][C]36[/C][C]0.358343[/C][C]2.7757[/C][C]0.003668[/C][/ROW]
[ROW][C]37[/C][C]-0.043787[/C][C]-0.3392[/C][C]0.367832[/C][/ROW]
[ROW][C]38[/C][C]-0.018108[/C][C]-0.1403[/C][C]0.444461[/C][/ROW]
[ROW][C]39[/C][C]-0.025581[/C][C]-0.1982[/C][C]0.421799[/C][/ROW]
[ROW][C]40[/C][C]-0.039641[/C][C]-0.3071[/C][C]0.37993[/C][/ROW]
[ROW][C]41[/C][C]-0.066409[/C][C]-0.5144[/C][C]0.304431[/C][/ROW]
[ROW][C]42[/C][C]-0.042838[/C][C]-0.3318[/C][C]0.37059[/C][/ROW]
[ROW][C]43[/C][C]-0.035912[/C][C]-0.2782[/C][C]0.390918[/C][/ROW]
[ROW][C]44[/C][C]-0.022634[/C][C]-0.1753[/C][C]0.43071[/C][/ROW]
[ROW][C]45[/C][C]-0.033838[/C][C]-0.2621[/C][C]0.397069[/C][/ROW]
[ROW][C]46[/C][C]-0.010754[/C][C]-0.0833[/C][C]0.466944[/C][/ROW]
[ROW][C]47[/C][C]0.013159[/C][C]0.1019[/C][C]0.459578[/C][/ROW]
[ROW][C]48[/C][C]0.015548[/C][C]0.1204[/C][C]0.45227[/C][/ROW]
[ROW][C]49[/C][C]-0.018391[/C][C]-0.1425[/C][C]0.443597[/C][/ROW]
[ROW][C]50[/C][C]-0.025666[/C][C]-0.1988[/C][C]0.421542[/C][/ROW]
[ROW][C]51[/C][C]-0.016912[/C][C]-0.131[/C][C]0.448107[/C][/ROW]
[ROW][C]52[/C][C]-0.027547[/C][C]-0.2134[/C][C]0.415879[/C][/ROW]
[ROW][C]53[/C][C]-0.050416[/C][C]-0.3905[/C][C]0.348766[/C][/ROW]
[ROW][C]54[/C][C]-0.080367[/C][C]-0.6225[/C][C]0.26798[/C][/ROW]
[ROW][C]55[/C][C]-0.052468[/C][C]-0.4064[/C][C]0.34294[/C][/ROW]
[ROW][C]56[/C][C]-0.024034[/C][C]-0.1862[/C][C]0.426471[/C][/ROW]
[ROW][C]57[/C][C]-0.027739[/C][C]-0.2149[/C][C]0.415301[/C][/ROW]
[ROW][C]58[/C][C]-0.044837[/C][C]-0.3473[/C][C]0.364788[/C][/ROW]
[ROW][C]59[/C][C]-0.039066[/C][C]-0.3026[/C][C]0.381619[/C][/ROW]
[ROW][C]60[/C][C]NA[/C][C]NA[/C][C]NA[/C][/ROW]
[/TABLE]
Source: https://freestatistics.org/blog/index.php?pk=35046&T=2

Globally Unique Identifier (entire table): ba.freestatistics.org/blog/index.php?pk=35046&T=2

As an alternative you can also use a QR Code:  

The GUIDs for individual cells are displayed in the table below:

Partial Autocorrelation Function
Time lag kPACF(k)T-STATP-value
1-0.028771-0.22290.4122
2-0.058837-0.45570.325108
3-0.047631-0.36890.356734
4-0.033365-0.25840.398475
5-0.004102-0.03180.487378
6-0.033024-0.25580.399489
7-0.045188-0.350.363772
8-0.06141-0.47570.318016
9-0.049916-0.38660.350193
10-0.062372-0.48310.31538
11-0.079428-0.61530.270358
12-0.072084-0.55840.289339
13-0.032441-0.25130.401225
14-0.029028-0.22490.411429
15-0.038481-0.29810.383339
16-0.036866-0.28560.388097
17-0.019819-0.15350.439252
180.0097760.07570.469944
19-0.016115-0.12480.450539
20-0.044137-0.34190.366816
21-0.039332-0.30470.380838
22-0.028476-0.22060.413087
23-0.033315-0.25810.398622
24-0.075042-0.58130.281617
25-0.085141-0.65950.256049
26-0.072636-0.56260.28789
27-0.06576-0.50940.306178
28-0.089696-0.69480.244937
29-0.088274-0.68380.248378
30-0.085238-0.66030.25581
31-0.066559-0.51560.304026
32-0.091477-0.70860.240665
33-0.113117-0.87620.192208
34-0.152094-1.17810.121701
35-0.188101-1.4570.075162
360.3583432.77570.003668
37-0.043787-0.33920.367832
38-0.018108-0.14030.444461
39-0.025581-0.19820.421799
40-0.039641-0.30710.37993
41-0.066409-0.51440.304431
42-0.042838-0.33180.37059
43-0.035912-0.27820.390918
44-0.022634-0.17530.43071
45-0.033838-0.26210.397069
46-0.010754-0.08330.466944
470.0131590.10190.459578
480.0155480.12040.45227
49-0.018391-0.14250.443597
50-0.025666-0.19880.421542
51-0.016912-0.1310.448107
52-0.027547-0.21340.415879
53-0.050416-0.39050.348766
54-0.080367-0.62250.26798
55-0.052468-0.40640.34294
56-0.024034-0.18620.426471
57-0.027739-0.21490.415301
58-0.044837-0.34730.364788
59-0.039066-0.30260.381619
60NANANA


Parameters (Session):
par1 = 1 ; par2 = 1 ; par3 = 0 ; par4 = 12 ;
Parameters (R input):
par1 = 60 ; par2 = 1 ; par3 = 1 ; par4 = 0 ; par5 = 12 ;
R code (references can be found in the software module):
if (par1 == 'Default') {
par1 = 10*log10(length(x))
} else {
par1 <- as.numeric(par1)
}
par2 <- as.numeric(par2)
par3 <- as.numeric(par3)
par4 <- as.numeric(par4)
par5 <- as.numeric(par5)
if (par2 == 0) {
x <- log(x)
} else {
x <- (x ^ par2 - 1) / par2
}
if (par3 > 0) x <- diff(x,lag=1,difference=par3)
if (par4 > 0) x <- diff(x,lag=par5,difference=par4)
bitmap(file='pic1.png')
racf <- acf(x,par1,main='Autocorrelation',xlab='lags',ylab='ACF')
dev.off()
bitmap(file='pic2.png')
rpacf <- pacf(x,par1,main='Partial Autocorrelation',xlab='lags',ylab='PACF')
dev.off()
(myacf <- c(racf$acf))
(mypacf <- c(rpacf$acf))
lengthx <- length(x)
sqrtn <- sqrt(lengthx)
load(file='createtable')
a<-table.start()
a<-table.row.start(a)
a<-table.element(a,'Autocorrelation Function',4,TRUE)
a<-table.row.end(a)
a<-table.row.start(a)
a<-table.element(a,'Time lag k',header=TRUE)
a<-table.element(a,hyperlink('basics.htm','ACF(k)','click here for more information about the Autocorrelation Function'),header=TRUE)
a<-table.element(a,'T-STAT',header=TRUE)
a<-table.element(a,'P-value',header=TRUE)
a<-table.row.end(a)
for (i in 2:(par1+1)) {
a<-table.row.start(a)
a<-table.element(a,i-1,header=TRUE)
a<-table.element(a,round(myacf[i],6))
mytstat <- myacf[i]*sqrtn
a<-table.element(a,round(mytstat,4))
a<-table.element(a,round(1-pt(abs(mytstat),lengthx),6))
a<-table.row.end(a)
}
a<-table.end(a)
table.save(a,file='mytable.tab')
a<-table.start()
a<-table.row.start(a)
a<-table.element(a,'Partial Autocorrelation Function',4,TRUE)
a<-table.row.end(a)
a<-table.row.start(a)
a<-table.element(a,'Time lag k',header=TRUE)
a<-table.element(a,hyperlink('basics.htm','PACF(k)','click here for more information about the Partial Autocorrelation Function'),header=TRUE)
a<-table.element(a,'T-STAT',header=TRUE)
a<-table.element(a,'P-value',header=TRUE)
a<-table.row.end(a)
for (i in 1:par1) {
a<-table.row.start(a)
a<-table.element(a,i,header=TRUE)
a<-table.element(a,round(mypacf[i],6))
mytstat <- mypacf[i]*sqrtn
a<-table.element(a,round(mytstat,4))
a<-table.element(a,round(1-pt(abs(mytstat),lengthx),6))
a<-table.row.end(a)
}
a<-table.end(a)
table.save(a,file='mytable1.tab')