Free Statistics

of Irreproducible Research!

Author's title

Author*The author of this computation has been verified*
R Software Modulerwasp_autocorrelation.wasp
Title produced by software(Partial) Autocorrelation Function
Date of computationFri, 19 Dec 2008 03:50:19 -0700
Cite this page as followsStatistical Computations at FreeStatistics.org, Office for Research Development and Education, URL https://freestatistics.org/blog/index.php?v=date/2008/Dec/19/t1229683901qwckmt5t886uxby.htm/, Retrieved Wed, 15 May 2024 08:55:00 +0000
Statistical Computations at FreeStatistics.org, Office for Research Development and Education, URL https://freestatistics.org/blog/index.php?pk=35040, Retrieved Wed, 15 May 2024 08:55:00 +0000
QR Codes:

Original text written by user:
IsPrivate?No (this computation is public)
User-defined keywords
Estimated Impact206
Family? (F = Feedback message, R = changed R code, M = changed R Module, P = changed Parameters, D = changed Data)
-     [Spectral Analysis] [Paper statistiek_...] [2008-12-19 10:03:59] [fdc296cbeb5d8064cb0dbd634c3fdc55]
-    D  [Spectral Analysis] [Paper statistiek_...] [2008-12-19 10:35:41] [fdc296cbeb5d8064cb0dbd634c3fdc55]
- RMP       [(Partial) Autocorrelation Function] [Paper statistiek_...] [2008-12-19 10:50:19] [e221948dd14811c7d88a6530ac2a8702] [Current]
Feedback Forum

Post a new message
Dataseries X:
98.6
98
106.8
96.7
100.2
107.7
92
98.4
107.4
117.7
105.7
97.5
99.9
98.2
104.5
100.8
101.5
103.9
99.6
98.4
112.7
118.4
108.1
105.4
114.6
106.9
115.9
109.8
101.8
114.2
110.8
108.4
127.5
128.6
116.6
127.4
105
108.3
125
111.6
106.5
130.3
115
116.1
134
126.5
125.8
136.4
114.9
110.9
125.5
116.8
116.8
125.5
104.2
115.1
132.8
123.3
124.8
122
117.4
117.9
137.4
114.6
124.7
129.6
109.4
120.9
134.9
136.3
133.2
127.2
122.7
120.5
137.8
119.1
124.3
134.4
121.1
122.2
127.7
137.4
132.2
129.2
124.9
124.8
128.2
134.4
118.6
132.6
123.2
112.8
138.3


Summary of computational transaction
Raw Inputview raw input (R code)
Raw Outputview raw output of R engine
Computing time5 seconds
R Server'Herman Ole Andreas Wold' @ 193.190.124.10:1001

\begin{tabular}{lllllllll}
\hline
Summary of computational transaction \tabularnewline
Raw Input & view raw input (R code)  \tabularnewline
Raw Output & view raw output of R engine  \tabularnewline
Computing time & 5 seconds \tabularnewline
R Server & 'Herman Ole Andreas Wold' @ 193.190.124.10:1001 \tabularnewline
\hline
\end{tabular}
%Source: https://freestatistics.org/blog/index.php?pk=35040&T=0

[TABLE]
[ROW][C]Summary of computational transaction[/C][/ROW]
[ROW][C]Raw Input[/C][C]view raw input (R code) [/C][/ROW]
[ROW][C]Raw Output[/C][C]view raw output of R engine [/C][/ROW]
[ROW][C]Computing time[/C][C]5 seconds[/C][/ROW]
[ROW][C]R Server[/C][C]'Herman Ole Andreas Wold' @ 193.190.124.10:1001[/C][/ROW]
[/TABLE]
Source: https://freestatistics.org/blog/index.php?pk=35040&T=0

Globally Unique Identifier (entire table): ba.freestatistics.org/blog/index.php?pk=35040&T=0

As an alternative you can also use a QR Code:  

The GUIDs for individual cells are displayed in the table below:

Summary of computational transaction
Raw Inputview raw input (R code)
Raw Outputview raw output of R engine
Computing time5 seconds
R Server'Herman Ole Andreas Wold' @ 193.190.124.10:1001


Autocorrelation Function
Time lag kACF(k)T-STATP-value
10.1110290.99930.160322
20.1618941.4570.074484
30.2502522.25230.013506
40.0426390.38380.351083
50.1895791.70620.0459
60.1873371.6860.047819
7-0.091896-0.82710.205315
80.087680.78910.216173
90.2147731.9330.028368
10-0.140284-1.26260.105186
11-0.05627-0.50640.306966
12-0.139942-1.25950.105737
13-0.202908-1.82620.035754
140.0615970.55440.290425
15-0.049145-0.44230.329724
16-0.145919-1.31330.096399
170.1358921.2230.112433
18-0.075621-0.68060.249037
19-0.172498-1.55250.062222
20-0.004177-0.03760.485054
21-0.036954-0.33260.370154
22-0.07565-0.68080.248955
230.1689381.52040.066147
24-0.247335-2.2260.014396
25-0.0756-0.68040.249097
260.0140310.12630.449911
27-0.021591-0.19430.423206
28-0.098393-0.88550.189244
29-0.030401-0.27360.392542
30-0.05937-0.53430.297289
310.0349650.31470.376904
320.0957090.86140.195786
33-0.161285-1.45160.075242
34-0.023289-0.20960.417251
350.059380.53440.297257
360.0294840.26540.395704
370.1671631.50450.068176
380.0560380.50430.307695
39-0.058483-0.52630.300042
400.101730.91560.181304
410.0125090.11260.455319
42-0.032549-0.29290.385158
430.0686690.6180.269148
440.0672810.60550.27326
45-0.062303-0.56070.288265
460.1290691.16160.1244
47-0.079686-0.71720.237665
48-0.122116-1.0990.137503
49-0.021577-0.19420.423257
50-0.113435-1.02090.155167
51-0.119877-1.07890.141919
520.0610450.54940.292119
53-0.101965-0.91770.180755
54-0.046375-0.41740.338754
55-0.015956-0.14360.443083
56-0.218451-1.96610.026359
57-0.060273-0.54250.294497
58-0.040595-0.36540.357898
59-0.093823-0.84440.200465
60-0.006856-0.06170.475475

\begin{tabular}{lllllllll}
\hline
Autocorrelation Function \tabularnewline
Time lag k & ACF(k) & T-STAT & P-value \tabularnewline
1 & 0.111029 & 0.9993 & 0.160322 \tabularnewline
2 & 0.161894 & 1.457 & 0.074484 \tabularnewline
3 & 0.250252 & 2.2523 & 0.013506 \tabularnewline
4 & 0.042639 & 0.3838 & 0.351083 \tabularnewline
5 & 0.189579 & 1.7062 & 0.0459 \tabularnewline
6 & 0.187337 & 1.686 & 0.047819 \tabularnewline
7 & -0.091896 & -0.8271 & 0.205315 \tabularnewline
8 & 0.08768 & 0.7891 & 0.216173 \tabularnewline
9 & 0.214773 & 1.933 & 0.028368 \tabularnewline
10 & -0.140284 & -1.2626 & 0.105186 \tabularnewline
11 & -0.05627 & -0.5064 & 0.306966 \tabularnewline
12 & -0.139942 & -1.2595 & 0.105737 \tabularnewline
13 & -0.202908 & -1.8262 & 0.035754 \tabularnewline
14 & 0.061597 & 0.5544 & 0.290425 \tabularnewline
15 & -0.049145 & -0.4423 & 0.329724 \tabularnewline
16 & -0.145919 & -1.3133 & 0.096399 \tabularnewline
17 & 0.135892 & 1.223 & 0.112433 \tabularnewline
18 & -0.075621 & -0.6806 & 0.249037 \tabularnewline
19 & -0.172498 & -1.5525 & 0.062222 \tabularnewline
20 & -0.004177 & -0.0376 & 0.485054 \tabularnewline
21 & -0.036954 & -0.3326 & 0.370154 \tabularnewline
22 & -0.07565 & -0.6808 & 0.248955 \tabularnewline
23 & 0.168938 & 1.5204 & 0.066147 \tabularnewline
24 & -0.247335 & -2.226 & 0.014396 \tabularnewline
25 & -0.0756 & -0.6804 & 0.249097 \tabularnewline
26 & 0.014031 & 0.1263 & 0.449911 \tabularnewline
27 & -0.021591 & -0.1943 & 0.423206 \tabularnewline
28 & -0.098393 & -0.8855 & 0.189244 \tabularnewline
29 & -0.030401 & -0.2736 & 0.392542 \tabularnewline
30 & -0.05937 & -0.5343 & 0.297289 \tabularnewline
31 & 0.034965 & 0.3147 & 0.376904 \tabularnewline
32 & 0.095709 & 0.8614 & 0.195786 \tabularnewline
33 & -0.161285 & -1.4516 & 0.075242 \tabularnewline
34 & -0.023289 & -0.2096 & 0.417251 \tabularnewline
35 & 0.05938 & 0.5344 & 0.297257 \tabularnewline
36 & 0.029484 & 0.2654 & 0.395704 \tabularnewline
37 & 0.167163 & 1.5045 & 0.068176 \tabularnewline
38 & 0.056038 & 0.5043 & 0.307695 \tabularnewline
39 & -0.058483 & -0.5263 & 0.300042 \tabularnewline
40 & 0.10173 & 0.9156 & 0.181304 \tabularnewline
41 & 0.012509 & 0.1126 & 0.455319 \tabularnewline
42 & -0.032549 & -0.2929 & 0.385158 \tabularnewline
43 & 0.068669 & 0.618 & 0.269148 \tabularnewline
44 & 0.067281 & 0.6055 & 0.27326 \tabularnewline
45 & -0.062303 & -0.5607 & 0.288265 \tabularnewline
46 & 0.129069 & 1.1616 & 0.1244 \tabularnewline
47 & -0.079686 & -0.7172 & 0.237665 \tabularnewline
48 & -0.122116 & -1.099 & 0.137503 \tabularnewline
49 & -0.021577 & -0.1942 & 0.423257 \tabularnewline
50 & -0.113435 & -1.0209 & 0.155167 \tabularnewline
51 & -0.119877 & -1.0789 & 0.141919 \tabularnewline
52 & 0.061045 & 0.5494 & 0.292119 \tabularnewline
53 & -0.101965 & -0.9177 & 0.180755 \tabularnewline
54 & -0.046375 & -0.4174 & 0.338754 \tabularnewline
55 & -0.015956 & -0.1436 & 0.443083 \tabularnewline
56 & -0.218451 & -1.9661 & 0.026359 \tabularnewline
57 & -0.060273 & -0.5425 & 0.294497 \tabularnewline
58 & -0.040595 & -0.3654 & 0.357898 \tabularnewline
59 & -0.093823 & -0.8444 & 0.200465 \tabularnewline
60 & -0.006856 & -0.0617 & 0.475475 \tabularnewline
\hline
\end{tabular}
%Source: https://freestatistics.org/blog/index.php?pk=35040&T=1

[TABLE]
[ROW][C]Autocorrelation Function[/C][/ROW]
[ROW][C]Time lag k[/C][C]ACF(k)[/C][C]T-STAT[/C][C]P-value[/C][/ROW]
[ROW][C]1[/C][C]0.111029[/C][C]0.9993[/C][C]0.160322[/C][/ROW]
[ROW][C]2[/C][C]0.161894[/C][C]1.457[/C][C]0.074484[/C][/ROW]
[ROW][C]3[/C][C]0.250252[/C][C]2.2523[/C][C]0.013506[/C][/ROW]
[ROW][C]4[/C][C]0.042639[/C][C]0.3838[/C][C]0.351083[/C][/ROW]
[ROW][C]5[/C][C]0.189579[/C][C]1.7062[/C][C]0.0459[/C][/ROW]
[ROW][C]6[/C][C]0.187337[/C][C]1.686[/C][C]0.047819[/C][/ROW]
[ROW][C]7[/C][C]-0.091896[/C][C]-0.8271[/C][C]0.205315[/C][/ROW]
[ROW][C]8[/C][C]0.08768[/C][C]0.7891[/C][C]0.216173[/C][/ROW]
[ROW][C]9[/C][C]0.214773[/C][C]1.933[/C][C]0.028368[/C][/ROW]
[ROW][C]10[/C][C]-0.140284[/C][C]-1.2626[/C][C]0.105186[/C][/ROW]
[ROW][C]11[/C][C]-0.05627[/C][C]-0.5064[/C][C]0.306966[/C][/ROW]
[ROW][C]12[/C][C]-0.139942[/C][C]-1.2595[/C][C]0.105737[/C][/ROW]
[ROW][C]13[/C][C]-0.202908[/C][C]-1.8262[/C][C]0.035754[/C][/ROW]
[ROW][C]14[/C][C]0.061597[/C][C]0.5544[/C][C]0.290425[/C][/ROW]
[ROW][C]15[/C][C]-0.049145[/C][C]-0.4423[/C][C]0.329724[/C][/ROW]
[ROW][C]16[/C][C]-0.145919[/C][C]-1.3133[/C][C]0.096399[/C][/ROW]
[ROW][C]17[/C][C]0.135892[/C][C]1.223[/C][C]0.112433[/C][/ROW]
[ROW][C]18[/C][C]-0.075621[/C][C]-0.6806[/C][C]0.249037[/C][/ROW]
[ROW][C]19[/C][C]-0.172498[/C][C]-1.5525[/C][C]0.062222[/C][/ROW]
[ROW][C]20[/C][C]-0.004177[/C][C]-0.0376[/C][C]0.485054[/C][/ROW]
[ROW][C]21[/C][C]-0.036954[/C][C]-0.3326[/C][C]0.370154[/C][/ROW]
[ROW][C]22[/C][C]-0.07565[/C][C]-0.6808[/C][C]0.248955[/C][/ROW]
[ROW][C]23[/C][C]0.168938[/C][C]1.5204[/C][C]0.066147[/C][/ROW]
[ROW][C]24[/C][C]-0.247335[/C][C]-2.226[/C][C]0.014396[/C][/ROW]
[ROW][C]25[/C][C]-0.0756[/C][C]-0.6804[/C][C]0.249097[/C][/ROW]
[ROW][C]26[/C][C]0.014031[/C][C]0.1263[/C][C]0.449911[/C][/ROW]
[ROW][C]27[/C][C]-0.021591[/C][C]-0.1943[/C][C]0.423206[/C][/ROW]
[ROW][C]28[/C][C]-0.098393[/C][C]-0.8855[/C][C]0.189244[/C][/ROW]
[ROW][C]29[/C][C]-0.030401[/C][C]-0.2736[/C][C]0.392542[/C][/ROW]
[ROW][C]30[/C][C]-0.05937[/C][C]-0.5343[/C][C]0.297289[/C][/ROW]
[ROW][C]31[/C][C]0.034965[/C][C]0.3147[/C][C]0.376904[/C][/ROW]
[ROW][C]32[/C][C]0.095709[/C][C]0.8614[/C][C]0.195786[/C][/ROW]
[ROW][C]33[/C][C]-0.161285[/C][C]-1.4516[/C][C]0.075242[/C][/ROW]
[ROW][C]34[/C][C]-0.023289[/C][C]-0.2096[/C][C]0.417251[/C][/ROW]
[ROW][C]35[/C][C]0.05938[/C][C]0.5344[/C][C]0.297257[/C][/ROW]
[ROW][C]36[/C][C]0.029484[/C][C]0.2654[/C][C]0.395704[/C][/ROW]
[ROW][C]37[/C][C]0.167163[/C][C]1.5045[/C][C]0.068176[/C][/ROW]
[ROW][C]38[/C][C]0.056038[/C][C]0.5043[/C][C]0.307695[/C][/ROW]
[ROW][C]39[/C][C]-0.058483[/C][C]-0.5263[/C][C]0.300042[/C][/ROW]
[ROW][C]40[/C][C]0.10173[/C][C]0.9156[/C][C]0.181304[/C][/ROW]
[ROW][C]41[/C][C]0.012509[/C][C]0.1126[/C][C]0.455319[/C][/ROW]
[ROW][C]42[/C][C]-0.032549[/C][C]-0.2929[/C][C]0.385158[/C][/ROW]
[ROW][C]43[/C][C]0.068669[/C][C]0.618[/C][C]0.269148[/C][/ROW]
[ROW][C]44[/C][C]0.067281[/C][C]0.6055[/C][C]0.27326[/C][/ROW]
[ROW][C]45[/C][C]-0.062303[/C][C]-0.5607[/C][C]0.288265[/C][/ROW]
[ROW][C]46[/C][C]0.129069[/C][C]1.1616[/C][C]0.1244[/C][/ROW]
[ROW][C]47[/C][C]-0.079686[/C][C]-0.7172[/C][C]0.237665[/C][/ROW]
[ROW][C]48[/C][C]-0.122116[/C][C]-1.099[/C][C]0.137503[/C][/ROW]
[ROW][C]49[/C][C]-0.021577[/C][C]-0.1942[/C][C]0.423257[/C][/ROW]
[ROW][C]50[/C][C]-0.113435[/C][C]-1.0209[/C][C]0.155167[/C][/ROW]
[ROW][C]51[/C][C]-0.119877[/C][C]-1.0789[/C][C]0.141919[/C][/ROW]
[ROW][C]52[/C][C]0.061045[/C][C]0.5494[/C][C]0.292119[/C][/ROW]
[ROW][C]53[/C][C]-0.101965[/C][C]-0.9177[/C][C]0.180755[/C][/ROW]
[ROW][C]54[/C][C]-0.046375[/C][C]-0.4174[/C][C]0.338754[/C][/ROW]
[ROW][C]55[/C][C]-0.015956[/C][C]-0.1436[/C][C]0.443083[/C][/ROW]
[ROW][C]56[/C][C]-0.218451[/C][C]-1.9661[/C][C]0.026359[/C][/ROW]
[ROW][C]57[/C][C]-0.060273[/C][C]-0.5425[/C][C]0.294497[/C][/ROW]
[ROW][C]58[/C][C]-0.040595[/C][C]-0.3654[/C][C]0.357898[/C][/ROW]
[ROW][C]59[/C][C]-0.093823[/C][C]-0.8444[/C][C]0.200465[/C][/ROW]
[ROW][C]60[/C][C]-0.006856[/C][C]-0.0617[/C][C]0.475475[/C][/ROW]
[/TABLE]
Source: https://freestatistics.org/blog/index.php?pk=35040&T=1

Globally Unique Identifier (entire table): ba.freestatistics.org/blog/index.php?pk=35040&T=1

As an alternative you can also use a QR Code:  

The GUIDs for individual cells are displayed in the table below:

Autocorrelation Function
Time lag kACF(k)T-STATP-value
10.1110290.99930.160322
20.1618941.4570.074484
30.2502522.25230.013506
40.0426390.38380.351083
50.1895791.70620.0459
60.1873371.6860.047819
7-0.091896-0.82710.205315
80.087680.78910.216173
90.2147731.9330.028368
10-0.140284-1.26260.105186
11-0.05627-0.50640.306966
12-0.139942-1.25950.105737
13-0.202908-1.82620.035754
140.0615970.55440.290425
15-0.049145-0.44230.329724
16-0.145919-1.31330.096399
170.1358921.2230.112433
18-0.075621-0.68060.249037
19-0.172498-1.55250.062222
20-0.004177-0.03760.485054
21-0.036954-0.33260.370154
22-0.07565-0.68080.248955
230.1689381.52040.066147
24-0.247335-2.2260.014396
25-0.0756-0.68040.249097
260.0140310.12630.449911
27-0.021591-0.19430.423206
28-0.098393-0.88550.189244
29-0.030401-0.27360.392542
30-0.05937-0.53430.297289
310.0349650.31470.376904
320.0957090.86140.195786
33-0.161285-1.45160.075242
34-0.023289-0.20960.417251
350.059380.53440.297257
360.0294840.26540.395704
370.1671631.50450.068176
380.0560380.50430.307695
39-0.058483-0.52630.300042
400.101730.91560.181304
410.0125090.11260.455319
42-0.032549-0.29290.385158
430.0686690.6180.269148
440.0672810.60550.27326
45-0.062303-0.56070.288265
460.1290691.16160.1244
47-0.079686-0.71720.237665
48-0.122116-1.0990.137503
49-0.021577-0.19420.423257
50-0.113435-1.02090.155167
51-0.119877-1.07890.141919
520.0610450.54940.292119
53-0.101965-0.91770.180755
54-0.046375-0.41740.338754
55-0.015956-0.14360.443083
56-0.218451-1.96610.026359
57-0.060273-0.54250.294497
58-0.040595-0.36540.357898
59-0.093823-0.84440.200465
60-0.006856-0.06170.475475


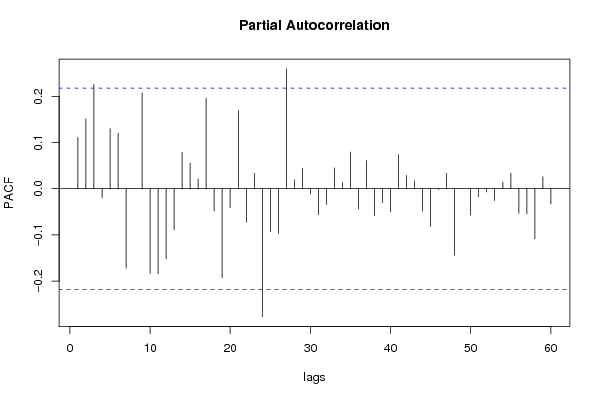
Partial Autocorrelation Function
Time lag kPACF(k)T-STATP-value
10.1110290.99930.160322
20.1514341.36290.088345
30.2260932.03480.022569
4-0.020248-0.18220.42793
50.1300641.17060.122601
60.1198371.07850.141999
7-0.171897-1.54710.062872
80.0002550.00230.499088
90.2070711.86360.032998
10-0.183163-1.64850.051565
11-0.184365-1.65930.050463
12-0.152136-1.36920.087357
13-0.089312-0.80380.21193
140.0791290.71220.239206
150.0556120.50050.309038
160.0210940.18980.424952
170.1966071.76950.04029
18-0.048453-0.43610.331972
19-0.192986-1.73690.043105
20-0.041172-0.37050.355972
210.1690161.52110.066059
22-0.072401-0.65160.258249
230.0336260.30260.381474
24-0.277047-2.49340.007344
25-0.093255-0.83930.201887
26-0.096875-0.87190.192928
270.2593462.33410.011034
280.0193510.17420.431087
290.0443750.39940.345335
30-0.011645-0.10480.458394
31-0.056407-0.50770.306534
32-0.034196-0.30780.379526
330.0450960.40590.342957
340.0132190.1190.452798
350.0792420.71320.238893
36-0.043703-0.39330.347554
370.0610920.54980.291976
38-0.058657-0.52790.299501
39-0.030448-0.2740.392379
40-0.050094-0.45080.326652
410.0736990.66330.254515
420.0288740.25990.397815
430.0172430.15520.438528
44-0.048105-0.43290.333102
45-0.081845-0.73660.231745
46-0.001856-0.01670.493356
470.0336870.30320.381263
48-0.143792-1.29410.09965
490.0001640.00150.499412
50-0.056872-0.51180.305076
51-0.01723-0.15510.438577
52-0.007044-0.06340.474804
53-0.025718-0.23150.40877
540.0143210.12890.448881
550.033490.30140.381938
56-0.053357-0.48020.316185
57-0.054286-0.48860.313231
58-0.108463-0.97620.165943
590.0259460.23350.407977
60-0.033056-0.29750.383423

\begin{tabular}{lllllllll}
\hline
Partial Autocorrelation Function \tabularnewline
Time lag k & PACF(k) & T-STAT & P-value \tabularnewline
1 & 0.111029 & 0.9993 & 0.160322 \tabularnewline
2 & 0.151434 & 1.3629 & 0.088345 \tabularnewline
3 & 0.226093 & 2.0348 & 0.022569 \tabularnewline
4 & -0.020248 & -0.1822 & 0.42793 \tabularnewline
5 & 0.130064 & 1.1706 & 0.122601 \tabularnewline
6 & 0.119837 & 1.0785 & 0.141999 \tabularnewline
7 & -0.171897 & -1.5471 & 0.062872 \tabularnewline
8 & 0.000255 & 0.0023 & 0.499088 \tabularnewline
9 & 0.207071 & 1.8636 & 0.032998 \tabularnewline
10 & -0.183163 & -1.6485 & 0.051565 \tabularnewline
11 & -0.184365 & -1.6593 & 0.050463 \tabularnewline
12 & -0.152136 & -1.3692 & 0.087357 \tabularnewline
13 & -0.089312 & -0.8038 & 0.21193 \tabularnewline
14 & 0.079129 & 0.7122 & 0.239206 \tabularnewline
15 & 0.055612 & 0.5005 & 0.309038 \tabularnewline
16 & 0.021094 & 0.1898 & 0.424952 \tabularnewline
17 & 0.196607 & 1.7695 & 0.04029 \tabularnewline
18 & -0.048453 & -0.4361 & 0.331972 \tabularnewline
19 & -0.192986 & -1.7369 & 0.043105 \tabularnewline
20 & -0.041172 & -0.3705 & 0.355972 \tabularnewline
21 & 0.169016 & 1.5211 & 0.066059 \tabularnewline
22 & -0.072401 & -0.6516 & 0.258249 \tabularnewline
23 & 0.033626 & 0.3026 & 0.381474 \tabularnewline
24 & -0.277047 & -2.4934 & 0.007344 \tabularnewline
25 & -0.093255 & -0.8393 & 0.201887 \tabularnewline
26 & -0.096875 & -0.8719 & 0.192928 \tabularnewline
27 & 0.259346 & 2.3341 & 0.011034 \tabularnewline
28 & 0.019351 & 0.1742 & 0.431087 \tabularnewline
29 & 0.044375 & 0.3994 & 0.345335 \tabularnewline
30 & -0.011645 & -0.1048 & 0.458394 \tabularnewline
31 & -0.056407 & -0.5077 & 0.306534 \tabularnewline
32 & -0.034196 & -0.3078 & 0.379526 \tabularnewline
33 & 0.045096 & 0.4059 & 0.342957 \tabularnewline
34 & 0.013219 & 0.119 & 0.452798 \tabularnewline
35 & 0.079242 & 0.7132 & 0.238893 \tabularnewline
36 & -0.043703 & -0.3933 & 0.347554 \tabularnewline
37 & 0.061092 & 0.5498 & 0.291976 \tabularnewline
38 & -0.058657 & -0.5279 & 0.299501 \tabularnewline
39 & -0.030448 & -0.274 & 0.392379 \tabularnewline
40 & -0.050094 & -0.4508 & 0.326652 \tabularnewline
41 & 0.073699 & 0.6633 & 0.254515 \tabularnewline
42 & 0.028874 & 0.2599 & 0.397815 \tabularnewline
43 & 0.017243 & 0.1552 & 0.438528 \tabularnewline
44 & -0.048105 & -0.4329 & 0.333102 \tabularnewline
45 & -0.081845 & -0.7366 & 0.231745 \tabularnewline
46 & -0.001856 & -0.0167 & 0.493356 \tabularnewline
47 & 0.033687 & 0.3032 & 0.381263 \tabularnewline
48 & -0.143792 & -1.2941 & 0.09965 \tabularnewline
49 & 0.000164 & 0.0015 & 0.499412 \tabularnewline
50 & -0.056872 & -0.5118 & 0.305076 \tabularnewline
51 & -0.01723 & -0.1551 & 0.438577 \tabularnewline
52 & -0.007044 & -0.0634 & 0.474804 \tabularnewline
53 & -0.025718 & -0.2315 & 0.40877 \tabularnewline
54 & 0.014321 & 0.1289 & 0.448881 \tabularnewline
55 & 0.03349 & 0.3014 & 0.381938 \tabularnewline
56 & -0.053357 & -0.4802 & 0.316185 \tabularnewline
57 & -0.054286 & -0.4886 & 0.313231 \tabularnewline
58 & -0.108463 & -0.9762 & 0.165943 \tabularnewline
59 & 0.025946 & 0.2335 & 0.407977 \tabularnewline
60 & -0.033056 & -0.2975 & 0.383423 \tabularnewline
\hline
\end{tabular}
%Source: https://freestatistics.org/blog/index.php?pk=35040&T=2

[TABLE]
[ROW][C]Partial Autocorrelation Function[/C][/ROW]
[ROW][C]Time lag k[/C][C]PACF(k)[/C][C]T-STAT[/C][C]P-value[/C][/ROW]
[ROW][C]1[/C][C]0.111029[/C][C]0.9993[/C][C]0.160322[/C][/ROW]
[ROW][C]2[/C][C]0.151434[/C][C]1.3629[/C][C]0.088345[/C][/ROW]
[ROW][C]3[/C][C]0.226093[/C][C]2.0348[/C][C]0.022569[/C][/ROW]
[ROW][C]4[/C][C]-0.020248[/C][C]-0.1822[/C][C]0.42793[/C][/ROW]
[ROW][C]5[/C][C]0.130064[/C][C]1.1706[/C][C]0.122601[/C][/ROW]
[ROW][C]6[/C][C]0.119837[/C][C]1.0785[/C][C]0.141999[/C][/ROW]
[ROW][C]7[/C][C]-0.171897[/C][C]-1.5471[/C][C]0.062872[/C][/ROW]
[ROW][C]8[/C][C]0.000255[/C][C]0.0023[/C][C]0.499088[/C][/ROW]
[ROW][C]9[/C][C]0.207071[/C][C]1.8636[/C][C]0.032998[/C][/ROW]
[ROW][C]10[/C][C]-0.183163[/C][C]-1.6485[/C][C]0.051565[/C][/ROW]
[ROW][C]11[/C][C]-0.184365[/C][C]-1.6593[/C][C]0.050463[/C][/ROW]
[ROW][C]12[/C][C]-0.152136[/C][C]-1.3692[/C][C]0.087357[/C][/ROW]
[ROW][C]13[/C][C]-0.089312[/C][C]-0.8038[/C][C]0.21193[/C][/ROW]
[ROW][C]14[/C][C]0.079129[/C][C]0.7122[/C][C]0.239206[/C][/ROW]
[ROW][C]15[/C][C]0.055612[/C][C]0.5005[/C][C]0.309038[/C][/ROW]
[ROW][C]16[/C][C]0.021094[/C][C]0.1898[/C][C]0.424952[/C][/ROW]
[ROW][C]17[/C][C]0.196607[/C][C]1.7695[/C][C]0.04029[/C][/ROW]
[ROW][C]18[/C][C]-0.048453[/C][C]-0.4361[/C][C]0.331972[/C][/ROW]
[ROW][C]19[/C][C]-0.192986[/C][C]-1.7369[/C][C]0.043105[/C][/ROW]
[ROW][C]20[/C][C]-0.041172[/C][C]-0.3705[/C][C]0.355972[/C][/ROW]
[ROW][C]21[/C][C]0.169016[/C][C]1.5211[/C][C]0.066059[/C][/ROW]
[ROW][C]22[/C][C]-0.072401[/C][C]-0.6516[/C][C]0.258249[/C][/ROW]
[ROW][C]23[/C][C]0.033626[/C][C]0.3026[/C][C]0.381474[/C][/ROW]
[ROW][C]24[/C][C]-0.277047[/C][C]-2.4934[/C][C]0.007344[/C][/ROW]
[ROW][C]25[/C][C]-0.093255[/C][C]-0.8393[/C][C]0.201887[/C][/ROW]
[ROW][C]26[/C][C]-0.096875[/C][C]-0.8719[/C][C]0.192928[/C][/ROW]
[ROW][C]27[/C][C]0.259346[/C][C]2.3341[/C][C]0.011034[/C][/ROW]
[ROW][C]28[/C][C]0.019351[/C][C]0.1742[/C][C]0.431087[/C][/ROW]
[ROW][C]29[/C][C]0.044375[/C][C]0.3994[/C][C]0.345335[/C][/ROW]
[ROW][C]30[/C][C]-0.011645[/C][C]-0.1048[/C][C]0.458394[/C][/ROW]
[ROW][C]31[/C][C]-0.056407[/C][C]-0.5077[/C][C]0.306534[/C][/ROW]
[ROW][C]32[/C][C]-0.034196[/C][C]-0.3078[/C][C]0.379526[/C][/ROW]
[ROW][C]33[/C][C]0.045096[/C][C]0.4059[/C][C]0.342957[/C][/ROW]
[ROW][C]34[/C][C]0.013219[/C][C]0.119[/C][C]0.452798[/C][/ROW]
[ROW][C]35[/C][C]0.079242[/C][C]0.7132[/C][C]0.238893[/C][/ROW]
[ROW][C]36[/C][C]-0.043703[/C][C]-0.3933[/C][C]0.347554[/C][/ROW]
[ROW][C]37[/C][C]0.061092[/C][C]0.5498[/C][C]0.291976[/C][/ROW]
[ROW][C]38[/C][C]-0.058657[/C][C]-0.5279[/C][C]0.299501[/C][/ROW]
[ROW][C]39[/C][C]-0.030448[/C][C]-0.274[/C][C]0.392379[/C][/ROW]
[ROW][C]40[/C][C]-0.050094[/C][C]-0.4508[/C][C]0.326652[/C][/ROW]
[ROW][C]41[/C][C]0.073699[/C][C]0.6633[/C][C]0.254515[/C][/ROW]
[ROW][C]42[/C][C]0.028874[/C][C]0.2599[/C][C]0.397815[/C][/ROW]
[ROW][C]43[/C][C]0.017243[/C][C]0.1552[/C][C]0.438528[/C][/ROW]
[ROW][C]44[/C][C]-0.048105[/C][C]-0.4329[/C][C]0.333102[/C][/ROW]
[ROW][C]45[/C][C]-0.081845[/C][C]-0.7366[/C][C]0.231745[/C][/ROW]
[ROW][C]46[/C][C]-0.001856[/C][C]-0.0167[/C][C]0.493356[/C][/ROW]
[ROW][C]47[/C][C]0.033687[/C][C]0.3032[/C][C]0.381263[/C][/ROW]
[ROW][C]48[/C][C]-0.143792[/C][C]-1.2941[/C][C]0.09965[/C][/ROW]
[ROW][C]49[/C][C]0.000164[/C][C]0.0015[/C][C]0.499412[/C][/ROW]
[ROW][C]50[/C][C]-0.056872[/C][C]-0.5118[/C][C]0.305076[/C][/ROW]
[ROW][C]51[/C][C]-0.01723[/C][C]-0.1551[/C][C]0.438577[/C][/ROW]
[ROW][C]52[/C][C]-0.007044[/C][C]-0.0634[/C][C]0.474804[/C][/ROW]
[ROW][C]53[/C][C]-0.025718[/C][C]-0.2315[/C][C]0.40877[/C][/ROW]
[ROW][C]54[/C][C]0.014321[/C][C]0.1289[/C][C]0.448881[/C][/ROW]
[ROW][C]55[/C][C]0.03349[/C][C]0.3014[/C][C]0.381938[/C][/ROW]
[ROW][C]56[/C][C]-0.053357[/C][C]-0.4802[/C][C]0.316185[/C][/ROW]
[ROW][C]57[/C][C]-0.054286[/C][C]-0.4886[/C][C]0.313231[/C][/ROW]
[ROW][C]58[/C][C]-0.108463[/C][C]-0.9762[/C][C]0.165943[/C][/ROW]
[ROW][C]59[/C][C]0.025946[/C][C]0.2335[/C][C]0.407977[/C][/ROW]
[ROW][C]60[/C][C]-0.033056[/C][C]-0.2975[/C][C]0.383423[/C][/ROW]
[/TABLE]
Source: https://freestatistics.org/blog/index.php?pk=35040&T=2

Globally Unique Identifier (entire table): ba.freestatistics.org/blog/index.php?pk=35040&T=2

As an alternative you can also use a QR Code:  

The GUIDs for individual cells are displayed in the table below:

Partial Autocorrelation Function
Time lag kPACF(k)T-STATP-value
10.1110290.99930.160322
20.1514341.36290.088345
30.2260932.03480.022569
4-0.020248-0.18220.42793
50.1300641.17060.122601
60.1198371.07850.141999
7-0.171897-1.54710.062872
80.0002550.00230.499088
90.2070711.86360.032998
10-0.183163-1.64850.051565
11-0.184365-1.65930.050463
12-0.152136-1.36920.087357
13-0.089312-0.80380.21193
140.0791290.71220.239206
150.0556120.50050.309038
160.0210940.18980.424952
170.1966071.76950.04029
18-0.048453-0.43610.331972
19-0.192986-1.73690.043105
20-0.041172-0.37050.355972
210.1690161.52110.066059
22-0.072401-0.65160.258249
230.0336260.30260.381474
24-0.277047-2.49340.007344
25-0.093255-0.83930.201887
26-0.096875-0.87190.192928
270.2593462.33410.011034
280.0193510.17420.431087
290.0443750.39940.345335
30-0.011645-0.10480.458394
31-0.056407-0.50770.306534
32-0.034196-0.30780.379526
330.0450960.40590.342957
340.0132190.1190.452798
350.0792420.71320.238893
36-0.043703-0.39330.347554
370.0610920.54980.291976
38-0.058657-0.52790.299501
39-0.030448-0.2740.392379
40-0.050094-0.45080.326652
410.0736990.66330.254515
420.0288740.25990.397815
430.0172430.15520.438528
44-0.048105-0.43290.333102
45-0.081845-0.73660.231745
46-0.001856-0.01670.493356
470.0336870.30320.381263
48-0.143792-1.29410.09965
490.0001640.00150.499412
50-0.056872-0.51180.305076
51-0.01723-0.15510.438577
52-0.007044-0.06340.474804
53-0.025718-0.23150.40877
540.0143210.12890.448881
550.033490.30140.381938
56-0.053357-0.48020.316185
57-0.054286-0.48860.313231
58-0.108463-0.97620.165943
590.0259460.23350.407977
60-0.033056-0.29750.383423


Parameters (Session):
par1 = 60 ; par2 = 1 ; par3 = 0 ; par4 = 1 ; par5 = 12 ;
Parameters (R input):
par1 = 60 ; par2 = 1 ; par3 = 0 ; par4 = 1 ; par5 = 12 ;
R code (references can be found in the software module):
if (par1 == 'Default') {
par1 = 10*log10(length(x))
} else {
par1 <- as.numeric(par1)
}
par2 <- as.numeric(par2)
par3 <- as.numeric(par3)
par4 <- as.numeric(par4)
par5 <- as.numeric(par5)
if (par2 == 0) {
x <- log(x)
} else {
x <- (x ^ par2 - 1) / par2
}
if (par3 > 0) x <- diff(x,lag=1,difference=par3)
if (par4 > 0) x <- diff(x,lag=par5,difference=par4)
bitmap(file='pic1.png')
racf <- acf(x,par1,main='Autocorrelation',xlab='lags',ylab='ACF')
dev.off()
bitmap(file='pic2.png')
rpacf <- pacf(x,par1,main='Partial Autocorrelation',xlab='lags',ylab='PACF')
dev.off()
(myacf <- c(racf$acf))
(mypacf <- c(rpacf$acf))
lengthx <- length(x)
sqrtn <- sqrt(lengthx)
load(file='createtable')
a<-table.start()
a<-table.row.start(a)
a<-table.element(a,'Autocorrelation Function',4,TRUE)
a<-table.row.end(a)
a<-table.row.start(a)
a<-table.element(a,'Time lag k',header=TRUE)
a<-table.element(a,hyperlink('basics.htm','ACF(k)','click here for more information about the Autocorrelation Function'),header=TRUE)
a<-table.element(a,'T-STAT',header=TRUE)
a<-table.element(a,'P-value',header=TRUE)
a<-table.row.end(a)
for (i in 2:(par1+1)) {
a<-table.row.start(a)
a<-table.element(a,i-1,header=TRUE)
a<-table.element(a,round(myacf[i],6))
mytstat <- myacf[i]*sqrtn
a<-table.element(a,round(mytstat,4))
a<-table.element(a,round(1-pt(abs(mytstat),lengthx),6))
a<-table.row.end(a)
}
a<-table.end(a)
table.save(a,file='mytable.tab')
a<-table.start()
a<-table.row.start(a)
a<-table.element(a,'Partial Autocorrelation Function',4,TRUE)
a<-table.row.end(a)
a<-table.row.start(a)
a<-table.element(a,'Time lag k',header=TRUE)
a<-table.element(a,hyperlink('basics.htm','PACF(k)','click here for more information about the Partial Autocorrelation Function'),header=TRUE)
a<-table.element(a,'T-STAT',header=TRUE)
a<-table.element(a,'P-value',header=TRUE)
a<-table.row.end(a)
for (i in 1:par1) {
a<-table.row.start(a)
a<-table.element(a,i,header=TRUE)
a<-table.element(a,round(mypacf[i],6))
mytstat <- mypacf[i]*sqrtn
a<-table.element(a,round(mytstat,4))
a<-table.element(a,round(1-pt(abs(mytstat),lengthx),6))
a<-table.row.end(a)
}
a<-table.end(a)
table.save(a,file='mytable1.tab')