Free Statistics

of Irreproducible Research!

Author's title

Author*Unverified author*
R Software Modulerwasp_autocorrelation.wasp
Title produced by software(Partial) Autocorrelation Function
Date of computationFri, 19 Dec 2008 03:50:22 -0700
Cite this page as followsStatistical Computations at FreeStatistics.org, Office for Research Development and Education, URL https://freestatistics.org/blog/index.php?v=date/2008/Dec/19/t1229683893jq5lj4z7hvi24dc.htm/, Retrieved Wed, 15 May 2024 00:07:21 +0000
Statistical Computations at FreeStatistics.org, Office for Research Development and Education, URL https://freestatistics.org/blog/index.php?pk=35039, Retrieved Wed, 15 May 2024 00:07:21 +0000
QR Codes:

Original text written by user:
IsPrivate?No (this computation is public)
User-defined keywords
Estimated Impact220
Family? (F = Feedback message, R = changed R code, M = changed R Module, P = changed Parameters, D = changed Data)
-     [Univariate Data Series] [] [2008-12-13 14:41:57] [996314793dac993597edc1ca2281ff39]
- RMPD    [(Partial) Autocorrelation Function] [] [2008-12-19 10:50:22] [e02910eed3830f1815f587e12f46cbdb] [Current]
Feedback Forum

Post a new message
Dataseries X:
101.7
101.9
102
102.2
102.4
102.6
102.6
102.5
102.5
102.6
102.7
102.9
103.1
103.2
103.2
103
102.8
102.6
102.4
102.2
101.9
101.6
101.3
101.2
111.7
111.4
111.1
111.1
111.3
111.9
112.4
112.9
113
113
112.7
112.4
112.3
112.5
112.8
113.2
114
114.9
115.6
115.5
115
114.9
115.2
115.4
115
114.6
114.5
114.4
113.9
113.2
112.7
112.6
112.5
112.3
112
111.7
119.2


Summary of computational transaction
Raw Inputview raw input (R code)
Raw Outputview raw output of R engine
Computing time1 seconds
R Server'Gwilym Jenkins' @ 72.249.127.135

\begin{tabular}{lllllllll}
\hline
Summary of computational transaction \tabularnewline
Raw Input & view raw input (R code)  \tabularnewline
Raw Output & view raw output of R engine  \tabularnewline
Computing time & 1 seconds \tabularnewline
R Server & 'Gwilym Jenkins' @ 72.249.127.135 \tabularnewline
\hline
\end{tabular}
%Source: https://freestatistics.org/blog/index.php?pk=35039&T=0

[TABLE]
[ROW][C]Summary of computational transaction[/C][/ROW]
[ROW][C]Raw Input[/C][C]view raw input (R code) [/C][/ROW]
[ROW][C]Raw Output[/C][C]view raw output of R engine [/C][/ROW]
[ROW][C]Computing time[/C][C]1 seconds[/C][/ROW]
[ROW][C]R Server[/C][C]'Gwilym Jenkins' @ 72.249.127.135[/C][/ROW]
[/TABLE]
Source: https://freestatistics.org/blog/index.php?pk=35039&T=0

Globally Unique Identifier (entire table): ba.freestatistics.org/blog/index.php?pk=35039&T=0

As an alternative you can also use a QR Code:  

The GUIDs for individual cells are displayed in the table below:

Summary of computational transaction
Raw Inputview raw input (R code)
Raw Outputview raw output of R engine
Computing time1 seconds
R Server'Gwilym Jenkins' @ 72.249.127.135


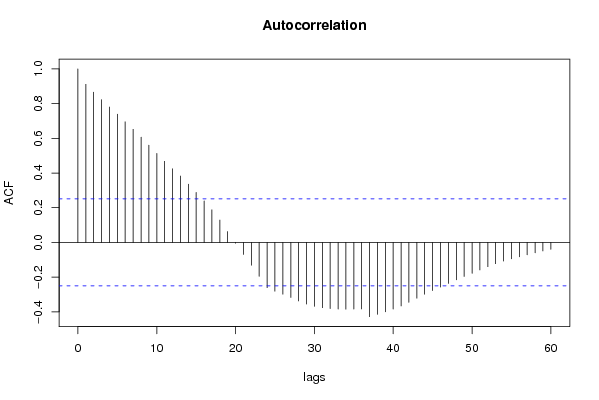
Autocorrelation Function
Time lag kACF(k)T-STATP-value
10.9117417.12090
20.8660286.76390
30.8226266.42490
40.7806126.09680
50.7389465.77140
60.695435.43151e-06
70.6519445.09182e-06
80.6069374.74037e-06
90.5607434.37952.4e-05
100.5132654.00878.4e-05
110.4673273.64990.000273
120.4245823.31610.000771
130.3822262.98530.002037
140.3358592.62310.005495
150.287952.2490.014069
160.2393111.86910.033207
170.1876141.46530.073986
180.128861.00640.159093
190.0623580.4870.313991
20-0.004841-0.03780.484982
21-0.069137-0.540.295589
22-0.131594-1.02780.154056
23-0.19577-1.5290.065716
24-0.261134-2.03950.022868
25-0.280914-2.1940.016027
26-0.298606-2.33220.011504
27-0.317401-2.4790.007978
28-0.337644-2.63710.005297
29-0.355195-2.77420.003667
30-0.368312-2.87660.002766
31-0.376254-2.93860.002324
32-0.381702-2.98120.00206
33-0.384139-3.00020.001952
34-0.384772-3.00520.001924
35-0.384069-2.99970.001955
36-0.383692-2.99670.001971
37-0.428039-3.34310.00071
38-0.414747-3.23930.000971
39-0.400065-3.12460.001362
40-0.38445-3.00270.001938
41-0.366142-2.85970.002899
42-0.34511-2.69540.004536
43-0.321557-2.51140.007344
44-0.298568-2.33190.011512
45-0.277712-2.1690.016995
46-0.257425-2.01060.024399
47-0.236939-1.85060.034539
48-0.215875-1.6860.048449
49-0.196403-1.5340.065106
50-0.177995-1.39020.084763
51-0.159113-1.24270.109366
52-0.140332-1.0960.138688
53-0.122845-0.95950.170559
54-0.107587-0.84030.202015
55-0.094737-0.73990.231093
56-0.082997-0.64820.259634
57-0.071297-0.55690.289833
58-0.060052-0.4690.320363
59-0.049269-0.38480.350862
60-0.039925-0.31180.37812

\begin{tabular}{lllllllll}
\hline
Autocorrelation Function \tabularnewline
Time lag k & ACF(k) & T-STAT & P-value \tabularnewline
1 & 0.911741 & 7.1209 & 0 \tabularnewline
2 & 0.866028 & 6.7639 & 0 \tabularnewline
3 & 0.822626 & 6.4249 & 0 \tabularnewline
4 & 0.780612 & 6.0968 & 0 \tabularnewline
5 & 0.738946 & 5.7714 & 0 \tabularnewline
6 & 0.69543 & 5.4315 & 1e-06 \tabularnewline
7 & 0.651944 & 5.0918 & 2e-06 \tabularnewline
8 & 0.606937 & 4.7403 & 7e-06 \tabularnewline
9 & 0.560743 & 4.3795 & 2.4e-05 \tabularnewline
10 & 0.513265 & 4.0087 & 8.4e-05 \tabularnewline
11 & 0.467327 & 3.6499 & 0.000273 \tabularnewline
12 & 0.424582 & 3.3161 & 0.000771 \tabularnewline
13 & 0.382226 & 2.9853 & 0.002037 \tabularnewline
14 & 0.335859 & 2.6231 & 0.005495 \tabularnewline
15 & 0.28795 & 2.249 & 0.014069 \tabularnewline
16 & 0.239311 & 1.8691 & 0.033207 \tabularnewline
17 & 0.187614 & 1.4653 & 0.073986 \tabularnewline
18 & 0.12886 & 1.0064 & 0.159093 \tabularnewline
19 & 0.062358 & 0.487 & 0.313991 \tabularnewline
20 & -0.004841 & -0.0378 & 0.484982 \tabularnewline
21 & -0.069137 & -0.54 & 0.295589 \tabularnewline
22 & -0.131594 & -1.0278 & 0.154056 \tabularnewline
23 & -0.19577 & -1.529 & 0.065716 \tabularnewline
24 & -0.261134 & -2.0395 & 0.022868 \tabularnewline
25 & -0.280914 & -2.194 & 0.016027 \tabularnewline
26 & -0.298606 & -2.3322 & 0.011504 \tabularnewline
27 & -0.317401 & -2.479 & 0.007978 \tabularnewline
28 & -0.337644 & -2.6371 & 0.005297 \tabularnewline
29 & -0.355195 & -2.7742 & 0.003667 \tabularnewline
30 & -0.368312 & -2.8766 & 0.002766 \tabularnewline
31 & -0.376254 & -2.9386 & 0.002324 \tabularnewline
32 & -0.381702 & -2.9812 & 0.00206 \tabularnewline
33 & -0.384139 & -3.0002 & 0.001952 \tabularnewline
34 & -0.384772 & -3.0052 & 0.001924 \tabularnewline
35 & -0.384069 & -2.9997 & 0.001955 \tabularnewline
36 & -0.383692 & -2.9967 & 0.001971 \tabularnewline
37 & -0.428039 & -3.3431 & 0.00071 \tabularnewline
38 & -0.414747 & -3.2393 & 0.000971 \tabularnewline
39 & -0.400065 & -3.1246 & 0.001362 \tabularnewline
40 & -0.38445 & -3.0027 & 0.001938 \tabularnewline
41 & -0.366142 & -2.8597 & 0.002899 \tabularnewline
42 & -0.34511 & -2.6954 & 0.004536 \tabularnewline
43 & -0.321557 & -2.5114 & 0.007344 \tabularnewline
44 & -0.298568 & -2.3319 & 0.011512 \tabularnewline
45 & -0.277712 & -2.169 & 0.016995 \tabularnewline
46 & -0.257425 & -2.0106 & 0.024399 \tabularnewline
47 & -0.236939 & -1.8506 & 0.034539 \tabularnewline
48 & -0.215875 & -1.686 & 0.048449 \tabularnewline
49 & -0.196403 & -1.534 & 0.065106 \tabularnewline
50 & -0.177995 & -1.3902 & 0.084763 \tabularnewline
51 & -0.159113 & -1.2427 & 0.109366 \tabularnewline
52 & -0.140332 & -1.096 & 0.138688 \tabularnewline
53 & -0.122845 & -0.9595 & 0.170559 \tabularnewline
54 & -0.107587 & -0.8403 & 0.202015 \tabularnewline
55 & -0.094737 & -0.7399 & 0.231093 \tabularnewline
56 & -0.082997 & -0.6482 & 0.259634 \tabularnewline
57 & -0.071297 & -0.5569 & 0.289833 \tabularnewline
58 & -0.060052 & -0.469 & 0.320363 \tabularnewline
59 & -0.049269 & -0.3848 & 0.350862 \tabularnewline
60 & -0.039925 & -0.3118 & 0.37812 \tabularnewline
\hline
\end{tabular}
%Source: https://freestatistics.org/blog/index.php?pk=35039&T=1

[TABLE]
[ROW][C]Autocorrelation Function[/C][/ROW]
[ROW][C]Time lag k[/C][C]ACF(k)[/C][C]T-STAT[/C][C]P-value[/C][/ROW]
[ROW][C]1[/C][C]0.911741[/C][C]7.1209[/C][C]0[/C][/ROW]
[ROW][C]2[/C][C]0.866028[/C][C]6.7639[/C][C]0[/C][/ROW]
[ROW][C]3[/C][C]0.822626[/C][C]6.4249[/C][C]0[/C][/ROW]
[ROW][C]4[/C][C]0.780612[/C][C]6.0968[/C][C]0[/C][/ROW]
[ROW][C]5[/C][C]0.738946[/C][C]5.7714[/C][C]0[/C][/ROW]
[ROW][C]6[/C][C]0.69543[/C][C]5.4315[/C][C]1e-06[/C][/ROW]
[ROW][C]7[/C][C]0.651944[/C][C]5.0918[/C][C]2e-06[/C][/ROW]
[ROW][C]8[/C][C]0.606937[/C][C]4.7403[/C][C]7e-06[/C][/ROW]
[ROW][C]9[/C][C]0.560743[/C][C]4.3795[/C][C]2.4e-05[/C][/ROW]
[ROW][C]10[/C][C]0.513265[/C][C]4.0087[/C][C]8.4e-05[/C][/ROW]
[ROW][C]11[/C][C]0.467327[/C][C]3.6499[/C][C]0.000273[/C][/ROW]
[ROW][C]12[/C][C]0.424582[/C][C]3.3161[/C][C]0.000771[/C][/ROW]
[ROW][C]13[/C][C]0.382226[/C][C]2.9853[/C][C]0.002037[/C][/ROW]
[ROW][C]14[/C][C]0.335859[/C][C]2.6231[/C][C]0.005495[/C][/ROW]
[ROW][C]15[/C][C]0.28795[/C][C]2.249[/C][C]0.014069[/C][/ROW]
[ROW][C]16[/C][C]0.239311[/C][C]1.8691[/C][C]0.033207[/C][/ROW]
[ROW][C]17[/C][C]0.187614[/C][C]1.4653[/C][C]0.073986[/C][/ROW]
[ROW][C]18[/C][C]0.12886[/C][C]1.0064[/C][C]0.159093[/C][/ROW]
[ROW][C]19[/C][C]0.062358[/C][C]0.487[/C][C]0.313991[/C][/ROW]
[ROW][C]20[/C][C]-0.004841[/C][C]-0.0378[/C][C]0.484982[/C][/ROW]
[ROW][C]21[/C][C]-0.069137[/C][C]-0.54[/C][C]0.295589[/C][/ROW]
[ROW][C]22[/C][C]-0.131594[/C][C]-1.0278[/C][C]0.154056[/C][/ROW]
[ROW][C]23[/C][C]-0.19577[/C][C]-1.529[/C][C]0.065716[/C][/ROW]
[ROW][C]24[/C][C]-0.261134[/C][C]-2.0395[/C][C]0.022868[/C][/ROW]
[ROW][C]25[/C][C]-0.280914[/C][C]-2.194[/C][C]0.016027[/C][/ROW]
[ROW][C]26[/C][C]-0.298606[/C][C]-2.3322[/C][C]0.011504[/C][/ROW]
[ROW][C]27[/C][C]-0.317401[/C][C]-2.479[/C][C]0.007978[/C][/ROW]
[ROW][C]28[/C][C]-0.337644[/C][C]-2.6371[/C][C]0.005297[/C][/ROW]
[ROW][C]29[/C][C]-0.355195[/C][C]-2.7742[/C][C]0.003667[/C][/ROW]
[ROW][C]30[/C][C]-0.368312[/C][C]-2.8766[/C][C]0.002766[/C][/ROW]
[ROW][C]31[/C][C]-0.376254[/C][C]-2.9386[/C][C]0.002324[/C][/ROW]
[ROW][C]32[/C][C]-0.381702[/C][C]-2.9812[/C][C]0.00206[/C][/ROW]
[ROW][C]33[/C][C]-0.384139[/C][C]-3.0002[/C][C]0.001952[/C][/ROW]
[ROW][C]34[/C][C]-0.384772[/C][C]-3.0052[/C][C]0.001924[/C][/ROW]
[ROW][C]35[/C][C]-0.384069[/C][C]-2.9997[/C][C]0.001955[/C][/ROW]
[ROW][C]36[/C][C]-0.383692[/C][C]-2.9967[/C][C]0.001971[/C][/ROW]
[ROW][C]37[/C][C]-0.428039[/C][C]-3.3431[/C][C]0.00071[/C][/ROW]
[ROW][C]38[/C][C]-0.414747[/C][C]-3.2393[/C][C]0.000971[/C][/ROW]
[ROW][C]39[/C][C]-0.400065[/C][C]-3.1246[/C][C]0.001362[/C][/ROW]
[ROW][C]40[/C][C]-0.38445[/C][C]-3.0027[/C][C]0.001938[/C][/ROW]
[ROW][C]41[/C][C]-0.366142[/C][C]-2.8597[/C][C]0.002899[/C][/ROW]
[ROW][C]42[/C][C]-0.34511[/C][C]-2.6954[/C][C]0.004536[/C][/ROW]
[ROW][C]43[/C][C]-0.321557[/C][C]-2.5114[/C][C]0.007344[/C][/ROW]
[ROW][C]44[/C][C]-0.298568[/C][C]-2.3319[/C][C]0.011512[/C][/ROW]
[ROW][C]45[/C][C]-0.277712[/C][C]-2.169[/C][C]0.016995[/C][/ROW]
[ROW][C]46[/C][C]-0.257425[/C][C]-2.0106[/C][C]0.024399[/C][/ROW]
[ROW][C]47[/C][C]-0.236939[/C][C]-1.8506[/C][C]0.034539[/C][/ROW]
[ROW][C]48[/C][C]-0.215875[/C][C]-1.686[/C][C]0.048449[/C][/ROW]
[ROW][C]49[/C][C]-0.196403[/C][C]-1.534[/C][C]0.065106[/C][/ROW]
[ROW][C]50[/C][C]-0.177995[/C][C]-1.3902[/C][C]0.084763[/C][/ROW]
[ROW][C]51[/C][C]-0.159113[/C][C]-1.2427[/C][C]0.109366[/C][/ROW]
[ROW][C]52[/C][C]-0.140332[/C][C]-1.096[/C][C]0.138688[/C][/ROW]
[ROW][C]53[/C][C]-0.122845[/C][C]-0.9595[/C][C]0.170559[/C][/ROW]
[ROW][C]54[/C][C]-0.107587[/C][C]-0.8403[/C][C]0.202015[/C][/ROW]
[ROW][C]55[/C][C]-0.094737[/C][C]-0.7399[/C][C]0.231093[/C][/ROW]
[ROW][C]56[/C][C]-0.082997[/C][C]-0.6482[/C][C]0.259634[/C][/ROW]
[ROW][C]57[/C][C]-0.071297[/C][C]-0.5569[/C][C]0.289833[/C][/ROW]
[ROW][C]58[/C][C]-0.060052[/C][C]-0.469[/C][C]0.320363[/C][/ROW]
[ROW][C]59[/C][C]-0.049269[/C][C]-0.3848[/C][C]0.350862[/C][/ROW]
[ROW][C]60[/C][C]-0.039925[/C][C]-0.3118[/C][C]0.37812[/C][/ROW]
[/TABLE]
Source: https://freestatistics.org/blog/index.php?pk=35039&T=1

Globally Unique Identifier (entire table): ba.freestatistics.org/blog/index.php?pk=35039&T=1

As an alternative you can also use a QR Code:  

The GUIDs for individual cells are displayed in the table below:

Autocorrelation Function
Time lag kACF(k)T-STATP-value
10.9117417.12090
20.8660286.76390
30.8226266.42490
40.7806126.09680
50.7389465.77140
60.695435.43151e-06
70.6519445.09182e-06
80.6069374.74037e-06
90.5607434.37952.4e-05
100.5132654.00878.4e-05
110.4673273.64990.000273
120.4245823.31610.000771
130.3822262.98530.002037
140.3358592.62310.005495
150.287952.2490.014069
160.2393111.86910.033207
170.1876141.46530.073986
180.128861.00640.159093
190.0623580.4870.313991
20-0.004841-0.03780.484982
21-0.069137-0.540.295589
22-0.131594-1.02780.154056
23-0.19577-1.5290.065716
24-0.261134-2.03950.022868
25-0.280914-2.1940.016027
26-0.298606-2.33220.011504
27-0.317401-2.4790.007978
28-0.337644-2.63710.005297
29-0.355195-2.77420.003667
30-0.368312-2.87660.002766
31-0.376254-2.93860.002324
32-0.381702-2.98120.00206
33-0.384139-3.00020.001952
34-0.384772-3.00520.001924
35-0.384069-2.99970.001955
36-0.383692-2.99670.001971
37-0.428039-3.34310.00071
38-0.414747-3.23930.000971
39-0.400065-3.12460.001362
40-0.38445-3.00270.001938
41-0.366142-2.85970.002899
42-0.34511-2.69540.004536
43-0.321557-2.51140.007344
44-0.298568-2.33190.011512
45-0.277712-2.1690.016995
46-0.257425-2.01060.024399
47-0.236939-1.85060.034539
48-0.215875-1.6860.048449
49-0.196403-1.5340.065106
50-0.177995-1.39020.084763
51-0.159113-1.24270.109366
52-0.140332-1.0960.138688
53-0.122845-0.95950.170559
54-0.107587-0.84030.202015
55-0.094737-0.73990.231093
56-0.082997-0.64820.259634
57-0.071297-0.55690.289833
58-0.060052-0.4690.320363
59-0.049269-0.38480.350862
60-0.039925-0.31180.37812


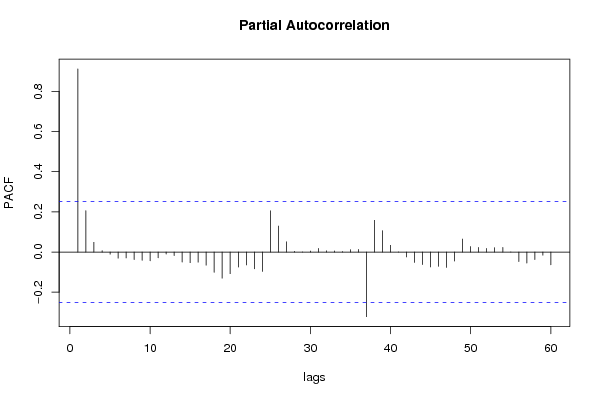
Partial Autocorrelation Function
Time lag kPACF(k)T-STATP-value
10.9117417.12090
20.2059881.60880.05641
30.0487220.38050.352437
40.006670.05210.479313
5-0.010723-0.08370.466766
6-0.030661-0.23950.405771
7-0.029243-0.22840.410053
8-0.037628-0.29390.384922
9-0.040982-0.32010.375002
10-0.043851-0.34250.36658
11-0.028525-0.22280.412223
12-0.010052-0.07850.46884
13-0.017507-0.13670.445845
14-0.049805-0.3890.349319
15-0.053096-0.41470.33991
16-0.050446-0.3940.34748
17-0.065325-0.51020.305875
18-0.10113-0.78990.216337
19-0.129881-1.01440.157199
20-0.107786-0.84180.201585
21-0.074968-0.58550.280179
22-0.064381-0.50280.308446
23-0.083576-0.65270.258186
24-0.096786-0.75590.226303
250.2052991.60340.057002
260.1296761.01280.157577
270.0513540.40110.34488
280.0034540.0270.489283
290.0002880.00220.499106
300.0051860.04050.483911
310.0179340.14010.444534
320.0064410.05030.480023
330.0053070.04140.483536
340.0025740.02010.492013
350.0119140.09310.463083
360.0128010.10.460344
37-0.321616-2.51190.007335
380.1582241.23580.110641
390.1063970.8310.204611
400.0338270.26420.39626
418.6e-057e-040.499734
42-0.024231-0.18930.425263
43-0.051395-0.40140.344761
44-0.062003-0.48430.314968
45-0.073837-0.57670.283136
46-0.070958-0.55420.290733
47-0.076365-0.59640.276548
48-0.045125-0.35240.362864
490.0645520.50420.30798
500.0275410.21510.415201
510.0229320.17910.429226
520.0182270.14240.443634
530.0216070.16880.433273
540.0231960.18120.428419
550.0001560.00120.499517
56-0.047226-0.36880.356759
57-0.054541-0.4260.335812
58-0.037322-0.29150.385831
59-0.01584-0.12370.450974
60-0.063276-0.49420.31147

\begin{tabular}{lllllllll}
\hline
Partial Autocorrelation Function \tabularnewline
Time lag k & PACF(k) & T-STAT & P-value \tabularnewline
1 & 0.911741 & 7.1209 & 0 \tabularnewline
2 & 0.205988 & 1.6088 & 0.05641 \tabularnewline
3 & 0.048722 & 0.3805 & 0.352437 \tabularnewline
4 & 0.00667 & 0.0521 & 0.479313 \tabularnewline
5 & -0.010723 & -0.0837 & 0.466766 \tabularnewline
6 & -0.030661 & -0.2395 & 0.405771 \tabularnewline
7 & -0.029243 & -0.2284 & 0.410053 \tabularnewline
8 & -0.037628 & -0.2939 & 0.384922 \tabularnewline
9 & -0.040982 & -0.3201 & 0.375002 \tabularnewline
10 & -0.043851 & -0.3425 & 0.36658 \tabularnewline
11 & -0.028525 & -0.2228 & 0.412223 \tabularnewline
12 & -0.010052 & -0.0785 & 0.46884 \tabularnewline
13 & -0.017507 & -0.1367 & 0.445845 \tabularnewline
14 & -0.049805 & -0.389 & 0.349319 \tabularnewline
15 & -0.053096 & -0.4147 & 0.33991 \tabularnewline
16 & -0.050446 & -0.394 & 0.34748 \tabularnewline
17 & -0.065325 & -0.5102 & 0.305875 \tabularnewline
18 & -0.10113 & -0.7899 & 0.216337 \tabularnewline
19 & -0.129881 & -1.0144 & 0.157199 \tabularnewline
20 & -0.107786 & -0.8418 & 0.201585 \tabularnewline
21 & -0.074968 & -0.5855 & 0.280179 \tabularnewline
22 & -0.064381 & -0.5028 & 0.308446 \tabularnewline
23 & -0.083576 & -0.6527 & 0.258186 \tabularnewline
24 & -0.096786 & -0.7559 & 0.226303 \tabularnewline
25 & 0.205299 & 1.6034 & 0.057002 \tabularnewline
26 & 0.129676 & 1.0128 & 0.157577 \tabularnewline
27 & 0.051354 & 0.4011 & 0.34488 \tabularnewline
28 & 0.003454 & 0.027 & 0.489283 \tabularnewline
29 & 0.000288 & 0.0022 & 0.499106 \tabularnewline
30 & 0.005186 & 0.0405 & 0.483911 \tabularnewline
31 & 0.017934 & 0.1401 & 0.444534 \tabularnewline
32 & 0.006441 & 0.0503 & 0.480023 \tabularnewline
33 & 0.005307 & 0.0414 & 0.483536 \tabularnewline
34 & 0.002574 & 0.0201 & 0.492013 \tabularnewline
35 & 0.011914 & 0.0931 & 0.463083 \tabularnewline
36 & 0.012801 & 0.1 & 0.460344 \tabularnewline
37 & -0.321616 & -2.5119 & 0.007335 \tabularnewline
38 & 0.158224 & 1.2358 & 0.110641 \tabularnewline
39 & 0.106397 & 0.831 & 0.204611 \tabularnewline
40 & 0.033827 & 0.2642 & 0.39626 \tabularnewline
41 & 8.6e-05 & 7e-04 & 0.499734 \tabularnewline
42 & -0.024231 & -0.1893 & 0.425263 \tabularnewline
43 & -0.051395 & -0.4014 & 0.344761 \tabularnewline
44 & -0.062003 & -0.4843 & 0.314968 \tabularnewline
45 & -0.073837 & -0.5767 & 0.283136 \tabularnewline
46 & -0.070958 & -0.5542 & 0.290733 \tabularnewline
47 & -0.076365 & -0.5964 & 0.276548 \tabularnewline
48 & -0.045125 & -0.3524 & 0.362864 \tabularnewline
49 & 0.064552 & 0.5042 & 0.30798 \tabularnewline
50 & 0.027541 & 0.2151 & 0.415201 \tabularnewline
51 & 0.022932 & 0.1791 & 0.429226 \tabularnewline
52 & 0.018227 & 0.1424 & 0.443634 \tabularnewline
53 & 0.021607 & 0.1688 & 0.433273 \tabularnewline
54 & 0.023196 & 0.1812 & 0.428419 \tabularnewline
55 & 0.000156 & 0.0012 & 0.499517 \tabularnewline
56 & -0.047226 & -0.3688 & 0.356759 \tabularnewline
57 & -0.054541 & -0.426 & 0.335812 \tabularnewline
58 & -0.037322 & -0.2915 & 0.385831 \tabularnewline
59 & -0.01584 & -0.1237 & 0.450974 \tabularnewline
60 & -0.063276 & -0.4942 & 0.31147 \tabularnewline
\hline
\end{tabular}
%Source: https://freestatistics.org/blog/index.php?pk=35039&T=2

[TABLE]
[ROW][C]Partial Autocorrelation Function[/C][/ROW]
[ROW][C]Time lag k[/C][C]PACF(k)[/C][C]T-STAT[/C][C]P-value[/C][/ROW]
[ROW][C]1[/C][C]0.911741[/C][C]7.1209[/C][C]0[/C][/ROW]
[ROW][C]2[/C][C]0.205988[/C][C]1.6088[/C][C]0.05641[/C][/ROW]
[ROW][C]3[/C][C]0.048722[/C][C]0.3805[/C][C]0.352437[/C][/ROW]
[ROW][C]4[/C][C]0.00667[/C][C]0.0521[/C][C]0.479313[/C][/ROW]
[ROW][C]5[/C][C]-0.010723[/C][C]-0.0837[/C][C]0.466766[/C][/ROW]
[ROW][C]6[/C][C]-0.030661[/C][C]-0.2395[/C][C]0.405771[/C][/ROW]
[ROW][C]7[/C][C]-0.029243[/C][C]-0.2284[/C][C]0.410053[/C][/ROW]
[ROW][C]8[/C][C]-0.037628[/C][C]-0.2939[/C][C]0.384922[/C][/ROW]
[ROW][C]9[/C][C]-0.040982[/C][C]-0.3201[/C][C]0.375002[/C][/ROW]
[ROW][C]10[/C][C]-0.043851[/C][C]-0.3425[/C][C]0.36658[/C][/ROW]
[ROW][C]11[/C][C]-0.028525[/C][C]-0.2228[/C][C]0.412223[/C][/ROW]
[ROW][C]12[/C][C]-0.010052[/C][C]-0.0785[/C][C]0.46884[/C][/ROW]
[ROW][C]13[/C][C]-0.017507[/C][C]-0.1367[/C][C]0.445845[/C][/ROW]
[ROW][C]14[/C][C]-0.049805[/C][C]-0.389[/C][C]0.349319[/C][/ROW]
[ROW][C]15[/C][C]-0.053096[/C][C]-0.4147[/C][C]0.33991[/C][/ROW]
[ROW][C]16[/C][C]-0.050446[/C][C]-0.394[/C][C]0.34748[/C][/ROW]
[ROW][C]17[/C][C]-0.065325[/C][C]-0.5102[/C][C]0.305875[/C][/ROW]
[ROW][C]18[/C][C]-0.10113[/C][C]-0.7899[/C][C]0.216337[/C][/ROW]
[ROW][C]19[/C][C]-0.129881[/C][C]-1.0144[/C][C]0.157199[/C][/ROW]
[ROW][C]20[/C][C]-0.107786[/C][C]-0.8418[/C][C]0.201585[/C][/ROW]
[ROW][C]21[/C][C]-0.074968[/C][C]-0.5855[/C][C]0.280179[/C][/ROW]
[ROW][C]22[/C][C]-0.064381[/C][C]-0.5028[/C][C]0.308446[/C][/ROW]
[ROW][C]23[/C][C]-0.083576[/C][C]-0.6527[/C][C]0.258186[/C][/ROW]
[ROW][C]24[/C][C]-0.096786[/C][C]-0.7559[/C][C]0.226303[/C][/ROW]
[ROW][C]25[/C][C]0.205299[/C][C]1.6034[/C][C]0.057002[/C][/ROW]
[ROW][C]26[/C][C]0.129676[/C][C]1.0128[/C][C]0.157577[/C][/ROW]
[ROW][C]27[/C][C]0.051354[/C][C]0.4011[/C][C]0.34488[/C][/ROW]
[ROW][C]28[/C][C]0.003454[/C][C]0.027[/C][C]0.489283[/C][/ROW]
[ROW][C]29[/C][C]0.000288[/C][C]0.0022[/C][C]0.499106[/C][/ROW]
[ROW][C]30[/C][C]0.005186[/C][C]0.0405[/C][C]0.483911[/C][/ROW]
[ROW][C]31[/C][C]0.017934[/C][C]0.1401[/C][C]0.444534[/C][/ROW]
[ROW][C]32[/C][C]0.006441[/C][C]0.0503[/C][C]0.480023[/C][/ROW]
[ROW][C]33[/C][C]0.005307[/C][C]0.0414[/C][C]0.483536[/C][/ROW]
[ROW][C]34[/C][C]0.002574[/C][C]0.0201[/C][C]0.492013[/C][/ROW]
[ROW][C]35[/C][C]0.011914[/C][C]0.0931[/C][C]0.463083[/C][/ROW]
[ROW][C]36[/C][C]0.012801[/C][C]0.1[/C][C]0.460344[/C][/ROW]
[ROW][C]37[/C][C]-0.321616[/C][C]-2.5119[/C][C]0.007335[/C][/ROW]
[ROW][C]38[/C][C]0.158224[/C][C]1.2358[/C][C]0.110641[/C][/ROW]
[ROW][C]39[/C][C]0.106397[/C][C]0.831[/C][C]0.204611[/C][/ROW]
[ROW][C]40[/C][C]0.033827[/C][C]0.2642[/C][C]0.39626[/C][/ROW]
[ROW][C]41[/C][C]8.6e-05[/C][C]7e-04[/C][C]0.499734[/C][/ROW]
[ROW][C]42[/C][C]-0.024231[/C][C]-0.1893[/C][C]0.425263[/C][/ROW]
[ROW][C]43[/C][C]-0.051395[/C][C]-0.4014[/C][C]0.344761[/C][/ROW]
[ROW][C]44[/C][C]-0.062003[/C][C]-0.4843[/C][C]0.314968[/C][/ROW]
[ROW][C]45[/C][C]-0.073837[/C][C]-0.5767[/C][C]0.283136[/C][/ROW]
[ROW][C]46[/C][C]-0.070958[/C][C]-0.5542[/C][C]0.290733[/C][/ROW]
[ROW][C]47[/C][C]-0.076365[/C][C]-0.5964[/C][C]0.276548[/C][/ROW]
[ROW][C]48[/C][C]-0.045125[/C][C]-0.3524[/C][C]0.362864[/C][/ROW]
[ROW][C]49[/C][C]0.064552[/C][C]0.5042[/C][C]0.30798[/C][/ROW]
[ROW][C]50[/C][C]0.027541[/C][C]0.2151[/C][C]0.415201[/C][/ROW]
[ROW][C]51[/C][C]0.022932[/C][C]0.1791[/C][C]0.429226[/C][/ROW]
[ROW][C]52[/C][C]0.018227[/C][C]0.1424[/C][C]0.443634[/C][/ROW]
[ROW][C]53[/C][C]0.021607[/C][C]0.1688[/C][C]0.433273[/C][/ROW]
[ROW][C]54[/C][C]0.023196[/C][C]0.1812[/C][C]0.428419[/C][/ROW]
[ROW][C]55[/C][C]0.000156[/C][C]0.0012[/C][C]0.499517[/C][/ROW]
[ROW][C]56[/C][C]-0.047226[/C][C]-0.3688[/C][C]0.356759[/C][/ROW]
[ROW][C]57[/C][C]-0.054541[/C][C]-0.426[/C][C]0.335812[/C][/ROW]
[ROW][C]58[/C][C]-0.037322[/C][C]-0.2915[/C][C]0.385831[/C][/ROW]
[ROW][C]59[/C][C]-0.01584[/C][C]-0.1237[/C][C]0.450974[/C][/ROW]
[ROW][C]60[/C][C]-0.063276[/C][C]-0.4942[/C][C]0.31147[/C][/ROW]
[/TABLE]
Source: https://freestatistics.org/blog/index.php?pk=35039&T=2

Globally Unique Identifier (entire table): ba.freestatistics.org/blog/index.php?pk=35039&T=2

As an alternative you can also use a QR Code:  

The GUIDs for individual cells are displayed in the table below:

Partial Autocorrelation Function
Time lag kPACF(k)T-STATP-value
10.9117417.12090
20.2059881.60880.05641
30.0487220.38050.352437
40.006670.05210.479313
5-0.010723-0.08370.466766
6-0.030661-0.23950.405771
7-0.029243-0.22840.410053
8-0.037628-0.29390.384922
9-0.040982-0.32010.375002
10-0.043851-0.34250.36658
11-0.028525-0.22280.412223
12-0.010052-0.07850.46884
13-0.017507-0.13670.445845
14-0.049805-0.3890.349319
15-0.053096-0.41470.33991
16-0.050446-0.3940.34748
17-0.065325-0.51020.305875
18-0.10113-0.78990.216337
19-0.129881-1.01440.157199
20-0.107786-0.84180.201585
21-0.074968-0.58550.280179
22-0.064381-0.50280.308446
23-0.083576-0.65270.258186
24-0.096786-0.75590.226303
250.2052991.60340.057002
260.1296761.01280.157577
270.0513540.40110.34488
280.0034540.0270.489283
290.0002880.00220.499106
300.0051860.04050.483911
310.0179340.14010.444534
320.0064410.05030.480023
330.0053070.04140.483536
340.0025740.02010.492013
350.0119140.09310.463083
360.0128010.10.460344
37-0.321616-2.51190.007335
380.1582241.23580.110641
390.1063970.8310.204611
400.0338270.26420.39626
418.6e-057e-040.499734
42-0.024231-0.18930.425263
43-0.051395-0.40140.344761
44-0.062003-0.48430.314968
45-0.073837-0.57670.283136
46-0.070958-0.55420.290733
47-0.076365-0.59640.276548
48-0.045125-0.35240.362864
490.0645520.50420.30798
500.0275410.21510.415201
510.0229320.17910.429226
520.0182270.14240.443634
530.0216070.16880.433273
540.0231960.18120.428419
550.0001560.00120.499517
56-0.047226-0.36880.356759
57-0.054541-0.4260.335812
58-0.037322-0.29150.385831
59-0.01584-0.12370.450974
60-0.063276-0.49420.31147


Parameters (Session):
par1 = 1 ; par2 = 1 ; par3 = 0 ; par4 = 12 ;
Parameters (R input):
par1 = 60 ; par2 = 1 ; par3 = 0 ; par4 = 0 ; par5 = 12 ;
R code (references can be found in the software module):
if (par1 == 'Default') {
par1 = 10*log10(length(x))
} else {
par1 <- as.numeric(par1)
}
par2 <- as.numeric(par2)
par3 <- as.numeric(par3)
par4 <- as.numeric(par4)
par5 <- as.numeric(par5)
if (par2 == 0) {
x <- log(x)
} else {
x <- (x ^ par2 - 1) / par2
}
if (par3 > 0) x <- diff(x,lag=1,difference=par3)
if (par4 > 0) x <- diff(x,lag=par5,difference=par4)
bitmap(file='pic1.png')
racf <- acf(x,par1,main='Autocorrelation',xlab='lags',ylab='ACF')
dev.off()
bitmap(file='pic2.png')
rpacf <- pacf(x,par1,main='Partial Autocorrelation',xlab='lags',ylab='PACF')
dev.off()
(myacf <- c(racf$acf))
(mypacf <- c(rpacf$acf))
lengthx <- length(x)
sqrtn <- sqrt(lengthx)
load(file='createtable')
a<-table.start()
a<-table.row.start(a)
a<-table.element(a,'Autocorrelation Function',4,TRUE)
a<-table.row.end(a)
a<-table.row.start(a)
a<-table.element(a,'Time lag k',header=TRUE)
a<-table.element(a,hyperlink('basics.htm','ACF(k)','click here for more information about the Autocorrelation Function'),header=TRUE)
a<-table.element(a,'T-STAT',header=TRUE)
a<-table.element(a,'P-value',header=TRUE)
a<-table.row.end(a)
for (i in 2:(par1+1)) {
a<-table.row.start(a)
a<-table.element(a,i-1,header=TRUE)
a<-table.element(a,round(myacf[i],6))
mytstat <- myacf[i]*sqrtn
a<-table.element(a,round(mytstat,4))
a<-table.element(a,round(1-pt(abs(mytstat),lengthx),6))
a<-table.row.end(a)
}
a<-table.end(a)
table.save(a,file='mytable.tab')
a<-table.start()
a<-table.row.start(a)
a<-table.element(a,'Partial Autocorrelation Function',4,TRUE)
a<-table.row.end(a)
a<-table.row.start(a)
a<-table.element(a,'Time lag k',header=TRUE)
a<-table.element(a,hyperlink('basics.htm','PACF(k)','click here for more information about the Partial Autocorrelation Function'),header=TRUE)
a<-table.element(a,'T-STAT',header=TRUE)
a<-table.element(a,'P-value',header=TRUE)
a<-table.row.end(a)
for (i in 1:par1) {
a<-table.row.start(a)
a<-table.element(a,i,header=TRUE)
a<-table.element(a,round(mypacf[i],6))
mytstat <- mypacf[i]*sqrtn
a<-table.element(a,round(mytstat,4))
a<-table.element(a,round(1-pt(abs(mytstat),lengthx),6))
a<-table.row.end(a)
}
a<-table.end(a)
table.save(a,file='mytable1.tab')