Free Statistics

of Irreproducible Research!

Author's title

Author*The author of this computation has been verified*
R Software Modulerwasp_autocorrelation.wasp
Title produced by software(Partial) Autocorrelation Function
Date of computationFri, 19 Dec 2008 03:12:55 -0700
Cite this page as followsStatistical Computations at FreeStatistics.org, Office for Research Development and Education, URL https://freestatistics.org/blog/index.php?v=date/2008/Dec/19/t1229681644vofvcrqd8n0v3w6.htm/, Retrieved Wed, 15 May 2024 07:24:14 +0000
Statistical Computations at FreeStatistics.org, Office for Research Development and Education, URL https://freestatistics.org/blog/index.php?pk=35017, Retrieved Wed, 15 May 2024 07:24:14 +0000
QR Codes:

Original text written by user:
IsPrivate?No (this computation is public)
User-defined keywords
Estimated Impact217
Family? (F = Feedback message, R = changed R code, M = changed R Module, P = changed Parameters, D = changed Data)
-     [Standard Deviation-Mean Plot] [tinneke_debock.pa...] [2008-12-18 18:24:23] [f9c5a49917ff87aeb076072f2749ef70]
- RMPD  [(Partial) Autocorrelation Function] [tinneke_debock.pa...] [2008-12-18 19:00:06] [f9c5a49917ff87aeb076072f2749ef70]
-   PD    [(Partial) Autocorrelation Function] [Paper statistiek_...] [2008-12-19 09:30:17] [fdc296cbeb5d8064cb0dbd634c3fdc55]
-   PD      [(Partial) Autocorrelation Function] [Paper statistiek_...] [2008-12-19 09:40:12] [fdc296cbeb5d8064cb0dbd634c3fdc55]
-   P           [(Partial) Autocorrelation Function] [Paper statistiek_...] [2008-12-19 10:12:55] [e221948dd14811c7d88a6530ac2a8702] [Current]
Feedback Forum

Post a new message
Dataseries X:
98.1
101.1
111.1
93.3
100
108
70.4
75.4
105.5
112.3
102.5
93.5
86.7
95.2
103.8
97
95.5
101
67.5
64
106.7
100.6
101.2
93.1
84.2
85.8
91.8
92.4
80.3
79.7
62.5
57.1
100.8
100.7
86.2
83.2
71.7
77.5
89.8
80.3
78.7
93.8
57.6
60.6
91
85.3
77.4
77.3
68.3
69.9
81.7
75.1
69.9
84
54.3
60
89.9
77
85.3
77.6
69.2
75.5
85.7
72.2
79.9
85.3
52.2
61.2
82.4
85.4
78.2
70.2
70.2
69.3
77.5
66.1
69
79.2
56.2
63.3
77.8
92
78.1
65.1
71.1
70.9
72
81.9
70.6
72.5
65.1
54.9
80


Summary of computational transaction
Raw Inputview raw input (R code)
Raw Outputview raw output of R engine
Computing time1 seconds
R Server'George Udny Yule' @ 72.249.76.132

\begin{tabular}{lllllllll}
\hline
Summary of computational transaction \tabularnewline
Raw Input & view raw input (R code)  \tabularnewline
Raw Output & view raw output of R engine  \tabularnewline
Computing time & 1 seconds \tabularnewline
R Server & 'George Udny Yule' @ 72.249.76.132 \tabularnewline
\hline
\end{tabular}
%Source: https://freestatistics.org/blog/index.php?pk=35017&T=0

[TABLE]
[ROW][C]Summary of computational transaction[/C][/ROW]
[ROW][C]Raw Input[/C][C]view raw input (R code) [/C][/ROW]
[ROW][C]Raw Output[/C][C]view raw output of R engine [/C][/ROW]
[ROW][C]Computing time[/C][C]1 seconds[/C][/ROW]
[ROW][C]R Server[/C][C]'George Udny Yule' @ 72.249.76.132[/C][/ROW]
[/TABLE]
Source: https://freestatistics.org/blog/index.php?pk=35017&T=0

Globally Unique Identifier (entire table): ba.freestatistics.org/blog/index.php?pk=35017&T=0

As an alternative you can also use a QR Code:  

The GUIDs for individual cells are displayed in the table below:

Summary of computational transaction
Raw Inputview raw input (R code)
Raw Outputview raw output of R engine
Computing time1 seconds
R Server'George Udny Yule' @ 72.249.76.132


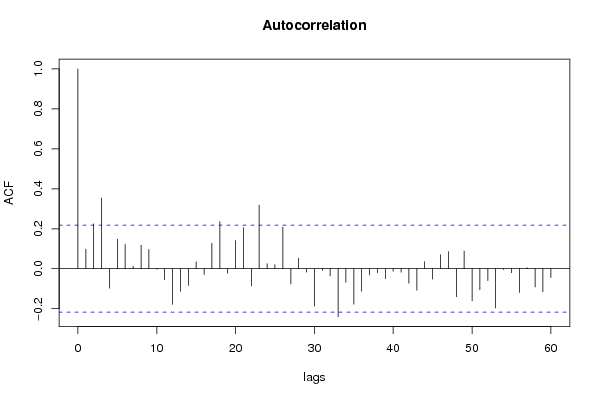
Autocorrelation Function
Time lag kACF(k)T-STATP-value
10.0974660.87720.191488
20.2239042.01510.023604
30.3539893.18590.001025
4-0.097599-0.87840.191164
50.147361.32620.094244
60.1214791.09330.138749
70.0125910.11330.455028
80.1171381.05420.147453
90.0961990.86580.19458
10-0.002923-0.02630.489539
11-0.055286-0.49760.310066
12-0.17793-1.60140.056594
13-0.11342-1.02080.155199
14-0.08344-0.7510.227426
150.0338230.30440.380798
16-0.029197-0.26280.396695
170.1277531.14980.12681
180.2355582.120.018532
19-0.023322-0.20990.417137
200.1409251.26830.104158
210.2055271.84970.033999
22-0.086069-0.77460.220409
230.317892.8610.002685
240.0254410.2290.409734
250.0196760.17710.429943
260.2082781.87450.032233
27-0.075979-0.68380.248023
280.0528470.47560.31781
29-0.016623-0.14960.440723
30-0.18732-1.68590.047834
31-0.008662-0.0780.469028
32-0.036226-0.3260.37262
33-0.239963-2.15970.016878
34-0.067965-0.61170.271229
35-0.177828-1.60050.056696
36-0.112313-1.01080.157557
37-0.030905-0.27810.390805
38-0.020081-0.18070.428517
39-0.050236-0.45210.326195
40-0.012074-0.10870.456868
41-0.017241-0.15520.438537
42-0.072662-0.6540.257496
43-0.107325-0.96590.168478
440.0351430.31630.376301
45-0.052066-0.46860.320309
460.0700310.63030.265142
470.085840.77260.221016
48-0.140271-1.26240.105207
490.0881430.79330.214965
50-0.16065-1.44580.076039
51-0.105921-0.95330.17164
52-0.059069-0.53160.298223
53-0.196034-1.76430.040725
54-0.004041-0.03640.485538
55-0.019879-0.17890.429229
56-0.11938-1.07440.142913
570.0050960.04590.481767
58-0.090969-0.81870.207675
59-0.11506-1.03550.15175
60-0.044122-0.39710.346171

\begin{tabular}{lllllllll}
\hline
Autocorrelation Function \tabularnewline
Time lag k & ACF(k) & T-STAT & P-value \tabularnewline
1 & 0.097466 & 0.8772 & 0.191488 \tabularnewline
2 & 0.223904 & 2.0151 & 0.023604 \tabularnewline
3 & 0.353989 & 3.1859 & 0.001025 \tabularnewline
4 & -0.097599 & -0.8784 & 0.191164 \tabularnewline
5 & 0.14736 & 1.3262 & 0.094244 \tabularnewline
6 & 0.121479 & 1.0933 & 0.138749 \tabularnewline
7 & 0.012591 & 0.1133 & 0.455028 \tabularnewline
8 & 0.117138 & 1.0542 & 0.147453 \tabularnewline
9 & 0.096199 & 0.8658 & 0.19458 \tabularnewline
10 & -0.002923 & -0.0263 & 0.489539 \tabularnewline
11 & -0.055286 & -0.4976 & 0.310066 \tabularnewline
12 & -0.17793 & -1.6014 & 0.056594 \tabularnewline
13 & -0.11342 & -1.0208 & 0.155199 \tabularnewline
14 & -0.08344 & -0.751 & 0.227426 \tabularnewline
15 & 0.033823 & 0.3044 & 0.380798 \tabularnewline
16 & -0.029197 & -0.2628 & 0.396695 \tabularnewline
17 & 0.127753 & 1.1498 & 0.12681 \tabularnewline
18 & 0.235558 & 2.12 & 0.018532 \tabularnewline
19 & -0.023322 & -0.2099 & 0.417137 \tabularnewline
20 & 0.140925 & 1.2683 & 0.104158 \tabularnewline
21 & 0.205527 & 1.8497 & 0.033999 \tabularnewline
22 & -0.086069 & -0.7746 & 0.220409 \tabularnewline
23 & 0.31789 & 2.861 & 0.002685 \tabularnewline
24 & 0.025441 & 0.229 & 0.409734 \tabularnewline
25 & 0.019676 & 0.1771 & 0.429943 \tabularnewline
26 & 0.208278 & 1.8745 & 0.032233 \tabularnewline
27 & -0.075979 & -0.6838 & 0.248023 \tabularnewline
28 & 0.052847 & 0.4756 & 0.31781 \tabularnewline
29 & -0.016623 & -0.1496 & 0.440723 \tabularnewline
30 & -0.18732 & -1.6859 & 0.047834 \tabularnewline
31 & -0.008662 & -0.078 & 0.469028 \tabularnewline
32 & -0.036226 & -0.326 & 0.37262 \tabularnewline
33 & -0.239963 & -2.1597 & 0.016878 \tabularnewline
34 & -0.067965 & -0.6117 & 0.271229 \tabularnewline
35 & -0.177828 & -1.6005 & 0.056696 \tabularnewline
36 & -0.112313 & -1.0108 & 0.157557 \tabularnewline
37 & -0.030905 & -0.2781 & 0.390805 \tabularnewline
38 & -0.020081 & -0.1807 & 0.428517 \tabularnewline
39 & -0.050236 & -0.4521 & 0.326195 \tabularnewline
40 & -0.012074 & -0.1087 & 0.456868 \tabularnewline
41 & -0.017241 & -0.1552 & 0.438537 \tabularnewline
42 & -0.072662 & -0.654 & 0.257496 \tabularnewline
43 & -0.107325 & -0.9659 & 0.168478 \tabularnewline
44 & 0.035143 & 0.3163 & 0.376301 \tabularnewline
45 & -0.052066 & -0.4686 & 0.320309 \tabularnewline
46 & 0.070031 & 0.6303 & 0.265142 \tabularnewline
47 & 0.08584 & 0.7726 & 0.221016 \tabularnewline
48 & -0.140271 & -1.2624 & 0.105207 \tabularnewline
49 & 0.088143 & 0.7933 & 0.214965 \tabularnewline
50 & -0.16065 & -1.4458 & 0.076039 \tabularnewline
51 & -0.105921 & -0.9533 & 0.17164 \tabularnewline
52 & -0.059069 & -0.5316 & 0.298223 \tabularnewline
53 & -0.196034 & -1.7643 & 0.040725 \tabularnewline
54 & -0.004041 & -0.0364 & 0.485538 \tabularnewline
55 & -0.019879 & -0.1789 & 0.429229 \tabularnewline
56 & -0.11938 & -1.0744 & 0.142913 \tabularnewline
57 & 0.005096 & 0.0459 & 0.481767 \tabularnewline
58 & -0.090969 & -0.8187 & 0.207675 \tabularnewline
59 & -0.11506 & -1.0355 & 0.15175 \tabularnewline
60 & -0.044122 & -0.3971 & 0.346171 \tabularnewline
\hline
\end{tabular}
%Source: https://freestatistics.org/blog/index.php?pk=35017&T=1

[TABLE]
[ROW][C]Autocorrelation Function[/C][/ROW]
[ROW][C]Time lag k[/C][C]ACF(k)[/C][C]T-STAT[/C][C]P-value[/C][/ROW]
[ROW][C]1[/C][C]0.097466[/C][C]0.8772[/C][C]0.191488[/C][/ROW]
[ROW][C]2[/C][C]0.223904[/C][C]2.0151[/C][C]0.023604[/C][/ROW]
[ROW][C]3[/C][C]0.353989[/C][C]3.1859[/C][C]0.001025[/C][/ROW]
[ROW][C]4[/C][C]-0.097599[/C][C]-0.8784[/C][C]0.191164[/C][/ROW]
[ROW][C]5[/C][C]0.14736[/C][C]1.3262[/C][C]0.094244[/C][/ROW]
[ROW][C]6[/C][C]0.121479[/C][C]1.0933[/C][C]0.138749[/C][/ROW]
[ROW][C]7[/C][C]0.012591[/C][C]0.1133[/C][C]0.455028[/C][/ROW]
[ROW][C]8[/C][C]0.117138[/C][C]1.0542[/C][C]0.147453[/C][/ROW]
[ROW][C]9[/C][C]0.096199[/C][C]0.8658[/C][C]0.19458[/C][/ROW]
[ROW][C]10[/C][C]-0.002923[/C][C]-0.0263[/C][C]0.489539[/C][/ROW]
[ROW][C]11[/C][C]-0.055286[/C][C]-0.4976[/C][C]0.310066[/C][/ROW]
[ROW][C]12[/C][C]-0.17793[/C][C]-1.6014[/C][C]0.056594[/C][/ROW]
[ROW][C]13[/C][C]-0.11342[/C][C]-1.0208[/C][C]0.155199[/C][/ROW]
[ROW][C]14[/C][C]-0.08344[/C][C]-0.751[/C][C]0.227426[/C][/ROW]
[ROW][C]15[/C][C]0.033823[/C][C]0.3044[/C][C]0.380798[/C][/ROW]
[ROW][C]16[/C][C]-0.029197[/C][C]-0.2628[/C][C]0.396695[/C][/ROW]
[ROW][C]17[/C][C]0.127753[/C][C]1.1498[/C][C]0.12681[/C][/ROW]
[ROW][C]18[/C][C]0.235558[/C][C]2.12[/C][C]0.018532[/C][/ROW]
[ROW][C]19[/C][C]-0.023322[/C][C]-0.2099[/C][C]0.417137[/C][/ROW]
[ROW][C]20[/C][C]0.140925[/C][C]1.2683[/C][C]0.104158[/C][/ROW]
[ROW][C]21[/C][C]0.205527[/C][C]1.8497[/C][C]0.033999[/C][/ROW]
[ROW][C]22[/C][C]-0.086069[/C][C]-0.7746[/C][C]0.220409[/C][/ROW]
[ROW][C]23[/C][C]0.31789[/C][C]2.861[/C][C]0.002685[/C][/ROW]
[ROW][C]24[/C][C]0.025441[/C][C]0.229[/C][C]0.409734[/C][/ROW]
[ROW][C]25[/C][C]0.019676[/C][C]0.1771[/C][C]0.429943[/C][/ROW]
[ROW][C]26[/C][C]0.208278[/C][C]1.8745[/C][C]0.032233[/C][/ROW]
[ROW][C]27[/C][C]-0.075979[/C][C]-0.6838[/C][C]0.248023[/C][/ROW]
[ROW][C]28[/C][C]0.052847[/C][C]0.4756[/C][C]0.31781[/C][/ROW]
[ROW][C]29[/C][C]-0.016623[/C][C]-0.1496[/C][C]0.440723[/C][/ROW]
[ROW][C]30[/C][C]-0.18732[/C][C]-1.6859[/C][C]0.047834[/C][/ROW]
[ROW][C]31[/C][C]-0.008662[/C][C]-0.078[/C][C]0.469028[/C][/ROW]
[ROW][C]32[/C][C]-0.036226[/C][C]-0.326[/C][C]0.37262[/C][/ROW]
[ROW][C]33[/C][C]-0.239963[/C][C]-2.1597[/C][C]0.016878[/C][/ROW]
[ROW][C]34[/C][C]-0.067965[/C][C]-0.6117[/C][C]0.271229[/C][/ROW]
[ROW][C]35[/C][C]-0.177828[/C][C]-1.6005[/C][C]0.056696[/C][/ROW]
[ROW][C]36[/C][C]-0.112313[/C][C]-1.0108[/C][C]0.157557[/C][/ROW]
[ROW][C]37[/C][C]-0.030905[/C][C]-0.2781[/C][C]0.390805[/C][/ROW]
[ROW][C]38[/C][C]-0.020081[/C][C]-0.1807[/C][C]0.428517[/C][/ROW]
[ROW][C]39[/C][C]-0.050236[/C][C]-0.4521[/C][C]0.326195[/C][/ROW]
[ROW][C]40[/C][C]-0.012074[/C][C]-0.1087[/C][C]0.456868[/C][/ROW]
[ROW][C]41[/C][C]-0.017241[/C][C]-0.1552[/C][C]0.438537[/C][/ROW]
[ROW][C]42[/C][C]-0.072662[/C][C]-0.654[/C][C]0.257496[/C][/ROW]
[ROW][C]43[/C][C]-0.107325[/C][C]-0.9659[/C][C]0.168478[/C][/ROW]
[ROW][C]44[/C][C]0.035143[/C][C]0.3163[/C][C]0.376301[/C][/ROW]
[ROW][C]45[/C][C]-0.052066[/C][C]-0.4686[/C][C]0.320309[/C][/ROW]
[ROW][C]46[/C][C]0.070031[/C][C]0.6303[/C][C]0.265142[/C][/ROW]
[ROW][C]47[/C][C]0.08584[/C][C]0.7726[/C][C]0.221016[/C][/ROW]
[ROW][C]48[/C][C]-0.140271[/C][C]-1.2624[/C][C]0.105207[/C][/ROW]
[ROW][C]49[/C][C]0.088143[/C][C]0.7933[/C][C]0.214965[/C][/ROW]
[ROW][C]50[/C][C]-0.16065[/C][C]-1.4458[/C][C]0.076039[/C][/ROW]
[ROW][C]51[/C][C]-0.105921[/C][C]-0.9533[/C][C]0.17164[/C][/ROW]
[ROW][C]52[/C][C]-0.059069[/C][C]-0.5316[/C][C]0.298223[/C][/ROW]
[ROW][C]53[/C][C]-0.196034[/C][C]-1.7643[/C][C]0.040725[/C][/ROW]
[ROW][C]54[/C][C]-0.004041[/C][C]-0.0364[/C][C]0.485538[/C][/ROW]
[ROW][C]55[/C][C]-0.019879[/C][C]-0.1789[/C][C]0.429229[/C][/ROW]
[ROW][C]56[/C][C]-0.11938[/C][C]-1.0744[/C][C]0.142913[/C][/ROW]
[ROW][C]57[/C][C]0.005096[/C][C]0.0459[/C][C]0.481767[/C][/ROW]
[ROW][C]58[/C][C]-0.090969[/C][C]-0.8187[/C][C]0.207675[/C][/ROW]
[ROW][C]59[/C][C]-0.11506[/C][C]-1.0355[/C][C]0.15175[/C][/ROW]
[ROW][C]60[/C][C]-0.044122[/C][C]-0.3971[/C][C]0.346171[/C][/ROW]
[/TABLE]
Source: https://freestatistics.org/blog/index.php?pk=35017&T=1

Globally Unique Identifier (entire table): ba.freestatistics.org/blog/index.php?pk=35017&T=1

As an alternative you can also use a QR Code:  

The GUIDs for individual cells are displayed in the table below:

Autocorrelation Function
Time lag kACF(k)T-STATP-value
10.0974660.87720.191488
20.2239042.01510.023604
30.3539893.18590.001025
4-0.097599-0.87840.191164
50.147361.32620.094244
60.1214791.09330.138749
70.0125910.11330.455028
80.1171381.05420.147453
90.0961990.86580.19458
10-0.002923-0.02630.489539
11-0.055286-0.49760.310066
12-0.17793-1.60140.056594
13-0.11342-1.02080.155199
14-0.08344-0.7510.227426
150.0338230.30440.380798
16-0.029197-0.26280.396695
170.1277531.14980.12681
180.2355582.120.018532
19-0.023322-0.20990.417137
200.1409251.26830.104158
210.2055271.84970.033999
22-0.086069-0.77460.220409
230.317892.8610.002685
240.0254410.2290.409734
250.0196760.17710.429943
260.2082781.87450.032233
27-0.075979-0.68380.248023
280.0528470.47560.31781
29-0.016623-0.14960.440723
30-0.18732-1.68590.047834
31-0.008662-0.0780.469028
32-0.036226-0.3260.37262
33-0.239963-2.15970.016878
34-0.067965-0.61170.271229
35-0.177828-1.60050.056696
36-0.112313-1.01080.157557
37-0.030905-0.27810.390805
38-0.020081-0.18070.428517
39-0.050236-0.45210.326195
40-0.012074-0.10870.456868
41-0.017241-0.15520.438537
42-0.072662-0.6540.257496
43-0.107325-0.96590.168478
440.0351430.31630.376301
45-0.052066-0.46860.320309
460.0700310.63030.265142
470.085840.77260.221016
48-0.140271-1.26240.105207
490.0881430.79330.214965
50-0.16065-1.44580.076039
51-0.105921-0.95330.17164
52-0.059069-0.53160.298223
53-0.196034-1.76430.040725
54-0.004041-0.03640.485538
55-0.019879-0.17890.429229
56-0.11938-1.07440.142913
570.0050960.04590.481767
58-0.090969-0.81870.207675
59-0.11506-1.03550.15175
60-0.044122-0.39710.346171


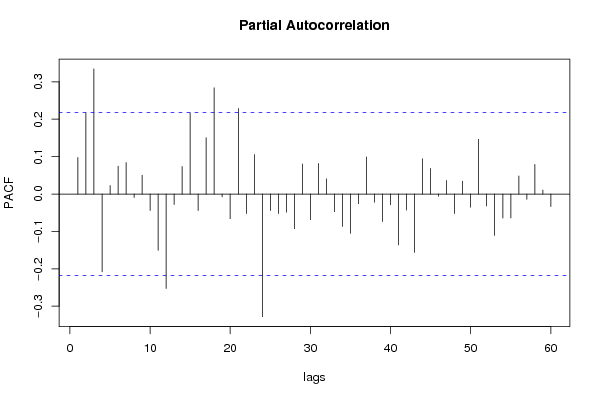
Partial Autocorrelation Function
Time lag kPACF(k)T-STATP-value
10.0974660.87720.191488
20.216461.94810.027431
30.3344943.01040.001739
4-0.207942-1.87150.032445
50.0225480.20290.419847
60.0743310.6690.252705
70.084060.75650.22576
8-0.009091-0.08180.467497
90.0505180.45470.325284
10-0.044001-0.3960.346571
11-0.150407-1.35370.089804
12-0.252385-2.27150.012886
13-0.028003-0.2520.400828
140.0735580.6620.254919
150.2170121.95310.02713
16-0.044272-0.39850.345673
170.1508181.35740.089218
180.284222.5580.006196
19-0.007528-0.06780.473075
20-0.066105-0.59490.276768
210.2288362.05950.021328
22-0.05237-0.47130.319335
230.1055140.94960.172563
24-0.327981-2.95180.002066
25-0.044377-0.39940.345326
26-0.052231-0.47010.319782
27-0.048528-0.43680.331725
28-0.092729-0.83460.20321
290.0800460.72040.236671
30-0.06878-0.6190.268821
310.081690.73520.232168
320.0408070.36730.35719
33-0.047393-0.42650.335423
34-0.086737-0.78060.218647
35-0.105096-0.94590.173515
36-0.026318-0.23690.40668
370.0992320.89310.187227
38-0.021869-0.19680.422229
39-0.073592-0.66230.25482
40-0.029012-0.26110.397336
41-0.136095-1.22490.112089
42-0.042884-0.3860.350271
43-0.156283-1.40660.081693
440.0943310.8490.199196
450.0683650.61530.270046
46-0.00598-0.05380.478606
470.0363310.3270.372262
48-0.052234-0.47010.319772
490.0341720.30750.379608
50-0.035353-0.31820.375585
510.1462071.31590.095967
52-0.032032-0.28830.386933
53-0.110654-0.99590.161135
54-0.064355-0.57920.282034
55-0.063962-0.57570.283222
560.0483970.43560.332152
57-0.014268-0.12840.44907
580.0790130.71110.239527
590.0106380.09570.461982
60-0.033416-0.30070.38219

\begin{tabular}{lllllllll}
\hline
Partial Autocorrelation Function \tabularnewline
Time lag k & PACF(k) & T-STAT & P-value \tabularnewline
1 & 0.097466 & 0.8772 & 0.191488 \tabularnewline
2 & 0.21646 & 1.9481 & 0.027431 \tabularnewline
3 & 0.334494 & 3.0104 & 0.001739 \tabularnewline
4 & -0.207942 & -1.8715 & 0.032445 \tabularnewline
5 & 0.022548 & 0.2029 & 0.419847 \tabularnewline
6 & 0.074331 & 0.669 & 0.252705 \tabularnewline
7 & 0.08406 & 0.7565 & 0.22576 \tabularnewline
8 & -0.009091 & -0.0818 & 0.467497 \tabularnewline
9 & 0.050518 & 0.4547 & 0.325284 \tabularnewline
10 & -0.044001 & -0.396 & 0.346571 \tabularnewline
11 & -0.150407 & -1.3537 & 0.089804 \tabularnewline
12 & -0.252385 & -2.2715 & 0.012886 \tabularnewline
13 & -0.028003 & -0.252 & 0.400828 \tabularnewline
14 & 0.073558 & 0.662 & 0.254919 \tabularnewline
15 & 0.217012 & 1.9531 & 0.02713 \tabularnewline
16 & -0.044272 & -0.3985 & 0.345673 \tabularnewline
17 & 0.150818 & 1.3574 & 0.089218 \tabularnewline
18 & 0.28422 & 2.558 & 0.006196 \tabularnewline
19 & -0.007528 & -0.0678 & 0.473075 \tabularnewline
20 & -0.066105 & -0.5949 & 0.276768 \tabularnewline
21 & 0.228836 & 2.0595 & 0.021328 \tabularnewline
22 & -0.05237 & -0.4713 & 0.319335 \tabularnewline
23 & 0.105514 & 0.9496 & 0.172563 \tabularnewline
24 & -0.327981 & -2.9518 & 0.002066 \tabularnewline
25 & -0.044377 & -0.3994 & 0.345326 \tabularnewline
26 & -0.052231 & -0.4701 & 0.319782 \tabularnewline
27 & -0.048528 & -0.4368 & 0.331725 \tabularnewline
28 & -0.092729 & -0.8346 & 0.20321 \tabularnewline
29 & 0.080046 & 0.7204 & 0.236671 \tabularnewline
30 & -0.06878 & -0.619 & 0.268821 \tabularnewline
31 & 0.08169 & 0.7352 & 0.232168 \tabularnewline
32 & 0.040807 & 0.3673 & 0.35719 \tabularnewline
33 & -0.047393 & -0.4265 & 0.335423 \tabularnewline
34 & -0.086737 & -0.7806 & 0.218647 \tabularnewline
35 & -0.105096 & -0.9459 & 0.173515 \tabularnewline
36 & -0.026318 & -0.2369 & 0.40668 \tabularnewline
37 & 0.099232 & 0.8931 & 0.187227 \tabularnewline
38 & -0.021869 & -0.1968 & 0.422229 \tabularnewline
39 & -0.073592 & -0.6623 & 0.25482 \tabularnewline
40 & -0.029012 & -0.2611 & 0.397336 \tabularnewline
41 & -0.136095 & -1.2249 & 0.112089 \tabularnewline
42 & -0.042884 & -0.386 & 0.350271 \tabularnewline
43 & -0.156283 & -1.4066 & 0.081693 \tabularnewline
44 & 0.094331 & 0.849 & 0.199196 \tabularnewline
45 & 0.068365 & 0.6153 & 0.270046 \tabularnewline
46 & -0.00598 & -0.0538 & 0.478606 \tabularnewline
47 & 0.036331 & 0.327 & 0.372262 \tabularnewline
48 & -0.052234 & -0.4701 & 0.319772 \tabularnewline
49 & 0.034172 & 0.3075 & 0.379608 \tabularnewline
50 & -0.035353 & -0.3182 & 0.375585 \tabularnewline
51 & 0.146207 & 1.3159 & 0.095967 \tabularnewline
52 & -0.032032 & -0.2883 & 0.386933 \tabularnewline
53 & -0.110654 & -0.9959 & 0.161135 \tabularnewline
54 & -0.064355 & -0.5792 & 0.282034 \tabularnewline
55 & -0.063962 & -0.5757 & 0.283222 \tabularnewline
56 & 0.048397 & 0.4356 & 0.332152 \tabularnewline
57 & -0.014268 & -0.1284 & 0.44907 \tabularnewline
58 & 0.079013 & 0.7111 & 0.239527 \tabularnewline
59 & 0.010638 & 0.0957 & 0.461982 \tabularnewline
60 & -0.033416 & -0.3007 & 0.38219 \tabularnewline
\hline
\end{tabular}
%Source: https://freestatistics.org/blog/index.php?pk=35017&T=2

[TABLE]
[ROW][C]Partial Autocorrelation Function[/C][/ROW]
[ROW][C]Time lag k[/C][C]PACF(k)[/C][C]T-STAT[/C][C]P-value[/C][/ROW]
[ROW][C]1[/C][C]0.097466[/C][C]0.8772[/C][C]0.191488[/C][/ROW]
[ROW][C]2[/C][C]0.21646[/C][C]1.9481[/C][C]0.027431[/C][/ROW]
[ROW][C]3[/C][C]0.334494[/C][C]3.0104[/C][C]0.001739[/C][/ROW]
[ROW][C]4[/C][C]-0.207942[/C][C]-1.8715[/C][C]0.032445[/C][/ROW]
[ROW][C]5[/C][C]0.022548[/C][C]0.2029[/C][C]0.419847[/C][/ROW]
[ROW][C]6[/C][C]0.074331[/C][C]0.669[/C][C]0.252705[/C][/ROW]
[ROW][C]7[/C][C]0.08406[/C][C]0.7565[/C][C]0.22576[/C][/ROW]
[ROW][C]8[/C][C]-0.009091[/C][C]-0.0818[/C][C]0.467497[/C][/ROW]
[ROW][C]9[/C][C]0.050518[/C][C]0.4547[/C][C]0.325284[/C][/ROW]
[ROW][C]10[/C][C]-0.044001[/C][C]-0.396[/C][C]0.346571[/C][/ROW]
[ROW][C]11[/C][C]-0.150407[/C][C]-1.3537[/C][C]0.089804[/C][/ROW]
[ROW][C]12[/C][C]-0.252385[/C][C]-2.2715[/C][C]0.012886[/C][/ROW]
[ROW][C]13[/C][C]-0.028003[/C][C]-0.252[/C][C]0.400828[/C][/ROW]
[ROW][C]14[/C][C]0.073558[/C][C]0.662[/C][C]0.254919[/C][/ROW]
[ROW][C]15[/C][C]0.217012[/C][C]1.9531[/C][C]0.02713[/C][/ROW]
[ROW][C]16[/C][C]-0.044272[/C][C]-0.3985[/C][C]0.345673[/C][/ROW]
[ROW][C]17[/C][C]0.150818[/C][C]1.3574[/C][C]0.089218[/C][/ROW]
[ROW][C]18[/C][C]0.28422[/C][C]2.558[/C][C]0.006196[/C][/ROW]
[ROW][C]19[/C][C]-0.007528[/C][C]-0.0678[/C][C]0.473075[/C][/ROW]
[ROW][C]20[/C][C]-0.066105[/C][C]-0.5949[/C][C]0.276768[/C][/ROW]
[ROW][C]21[/C][C]0.228836[/C][C]2.0595[/C][C]0.021328[/C][/ROW]
[ROW][C]22[/C][C]-0.05237[/C][C]-0.4713[/C][C]0.319335[/C][/ROW]
[ROW][C]23[/C][C]0.105514[/C][C]0.9496[/C][C]0.172563[/C][/ROW]
[ROW][C]24[/C][C]-0.327981[/C][C]-2.9518[/C][C]0.002066[/C][/ROW]
[ROW][C]25[/C][C]-0.044377[/C][C]-0.3994[/C][C]0.345326[/C][/ROW]
[ROW][C]26[/C][C]-0.052231[/C][C]-0.4701[/C][C]0.319782[/C][/ROW]
[ROW][C]27[/C][C]-0.048528[/C][C]-0.4368[/C][C]0.331725[/C][/ROW]
[ROW][C]28[/C][C]-0.092729[/C][C]-0.8346[/C][C]0.20321[/C][/ROW]
[ROW][C]29[/C][C]0.080046[/C][C]0.7204[/C][C]0.236671[/C][/ROW]
[ROW][C]30[/C][C]-0.06878[/C][C]-0.619[/C][C]0.268821[/C][/ROW]
[ROW][C]31[/C][C]0.08169[/C][C]0.7352[/C][C]0.232168[/C][/ROW]
[ROW][C]32[/C][C]0.040807[/C][C]0.3673[/C][C]0.35719[/C][/ROW]
[ROW][C]33[/C][C]-0.047393[/C][C]-0.4265[/C][C]0.335423[/C][/ROW]
[ROW][C]34[/C][C]-0.086737[/C][C]-0.7806[/C][C]0.218647[/C][/ROW]
[ROW][C]35[/C][C]-0.105096[/C][C]-0.9459[/C][C]0.173515[/C][/ROW]
[ROW][C]36[/C][C]-0.026318[/C][C]-0.2369[/C][C]0.40668[/C][/ROW]
[ROW][C]37[/C][C]0.099232[/C][C]0.8931[/C][C]0.187227[/C][/ROW]
[ROW][C]38[/C][C]-0.021869[/C][C]-0.1968[/C][C]0.422229[/C][/ROW]
[ROW][C]39[/C][C]-0.073592[/C][C]-0.6623[/C][C]0.25482[/C][/ROW]
[ROW][C]40[/C][C]-0.029012[/C][C]-0.2611[/C][C]0.397336[/C][/ROW]
[ROW][C]41[/C][C]-0.136095[/C][C]-1.2249[/C][C]0.112089[/C][/ROW]
[ROW][C]42[/C][C]-0.042884[/C][C]-0.386[/C][C]0.350271[/C][/ROW]
[ROW][C]43[/C][C]-0.156283[/C][C]-1.4066[/C][C]0.081693[/C][/ROW]
[ROW][C]44[/C][C]0.094331[/C][C]0.849[/C][C]0.199196[/C][/ROW]
[ROW][C]45[/C][C]0.068365[/C][C]0.6153[/C][C]0.270046[/C][/ROW]
[ROW][C]46[/C][C]-0.00598[/C][C]-0.0538[/C][C]0.478606[/C][/ROW]
[ROW][C]47[/C][C]0.036331[/C][C]0.327[/C][C]0.372262[/C][/ROW]
[ROW][C]48[/C][C]-0.052234[/C][C]-0.4701[/C][C]0.319772[/C][/ROW]
[ROW][C]49[/C][C]0.034172[/C][C]0.3075[/C][C]0.379608[/C][/ROW]
[ROW][C]50[/C][C]-0.035353[/C][C]-0.3182[/C][C]0.375585[/C][/ROW]
[ROW][C]51[/C][C]0.146207[/C][C]1.3159[/C][C]0.095967[/C][/ROW]
[ROW][C]52[/C][C]-0.032032[/C][C]-0.2883[/C][C]0.386933[/C][/ROW]
[ROW][C]53[/C][C]-0.110654[/C][C]-0.9959[/C][C]0.161135[/C][/ROW]
[ROW][C]54[/C][C]-0.064355[/C][C]-0.5792[/C][C]0.282034[/C][/ROW]
[ROW][C]55[/C][C]-0.063962[/C][C]-0.5757[/C][C]0.283222[/C][/ROW]
[ROW][C]56[/C][C]0.048397[/C][C]0.4356[/C][C]0.332152[/C][/ROW]
[ROW][C]57[/C][C]-0.014268[/C][C]-0.1284[/C][C]0.44907[/C][/ROW]
[ROW][C]58[/C][C]0.079013[/C][C]0.7111[/C][C]0.239527[/C][/ROW]
[ROW][C]59[/C][C]0.010638[/C][C]0.0957[/C][C]0.461982[/C][/ROW]
[ROW][C]60[/C][C]-0.033416[/C][C]-0.3007[/C][C]0.38219[/C][/ROW]
[/TABLE]
Source: https://freestatistics.org/blog/index.php?pk=35017&T=2

Globally Unique Identifier (entire table): ba.freestatistics.org/blog/index.php?pk=35017&T=2

As an alternative you can also use a QR Code:  

The GUIDs for individual cells are displayed in the table below:

Partial Autocorrelation Function
Time lag kPACF(k)T-STATP-value
10.0974660.87720.191488
20.216461.94810.027431
30.3344943.01040.001739
4-0.207942-1.87150.032445
50.0225480.20290.419847
60.0743310.6690.252705
70.084060.75650.22576
8-0.009091-0.08180.467497
90.0505180.45470.325284
10-0.044001-0.3960.346571
11-0.150407-1.35370.089804
12-0.252385-2.27150.012886
13-0.028003-0.2520.400828
140.0735580.6620.254919
150.2170121.95310.02713
16-0.044272-0.39850.345673
170.1508181.35740.089218
180.284222.5580.006196
19-0.007528-0.06780.473075
20-0.066105-0.59490.276768
210.2288362.05950.021328
22-0.05237-0.47130.319335
230.1055140.94960.172563
24-0.327981-2.95180.002066
25-0.044377-0.39940.345326
26-0.052231-0.47010.319782
27-0.048528-0.43680.331725
28-0.092729-0.83460.20321
290.0800460.72040.236671
30-0.06878-0.6190.268821
310.081690.73520.232168
320.0408070.36730.35719
33-0.047393-0.42650.335423
34-0.086737-0.78060.218647
35-0.105096-0.94590.173515
36-0.026318-0.23690.40668
370.0992320.89310.187227
38-0.021869-0.19680.422229
39-0.073592-0.66230.25482
40-0.029012-0.26110.397336
41-0.136095-1.22490.112089
42-0.042884-0.3860.350271
43-0.156283-1.40660.081693
440.0943310.8490.199196
450.0683650.61530.270046
46-0.00598-0.05380.478606
470.0363310.3270.372262
48-0.052234-0.47010.319772
490.0341720.30750.379608
50-0.035353-0.31820.375585
510.1462071.31590.095967
52-0.032032-0.28830.386933
53-0.110654-0.99590.161135
54-0.064355-0.57920.282034
55-0.063962-0.57570.283222
560.0483970.43560.332152
57-0.014268-0.12840.44907
580.0790130.71110.239527
590.0106380.09570.461982
60-0.033416-0.30070.38219


Parameters (Session):
par1 = 60 ; par2 = -0.1 ; par3 = 0 ; par4 = 1 ; par5 = 12 ;
Parameters (R input):
par1 = 60 ; par2 = -0.1 ; par3 = 0 ; par4 = 1 ; par5 = 12 ;
R code (references can be found in the software module):
if (par1 == 'Default') {
par1 = 10*log10(length(x))
} else {
par1 <- as.numeric(par1)
}
par2 <- as.numeric(par2)
par3 <- as.numeric(par3)
par4 <- as.numeric(par4)
par5 <- as.numeric(par5)
if (par2 == 0) {
x <- log(x)
} else {
x <- (x ^ par2 - 1) / par2
}
if (par3 > 0) x <- diff(x,lag=1,difference=par3)
if (par4 > 0) x <- diff(x,lag=par5,difference=par4)
bitmap(file='pic1.png')
racf <- acf(x,par1,main='Autocorrelation',xlab='lags',ylab='ACF')
dev.off()
bitmap(file='pic2.png')
rpacf <- pacf(x,par1,main='Partial Autocorrelation',xlab='lags',ylab='PACF')
dev.off()
(myacf <- c(racf$acf))
(mypacf <- c(rpacf$acf))
lengthx <- length(x)
sqrtn <- sqrt(lengthx)
load(file='createtable')
a<-table.start()
a<-table.row.start(a)
a<-table.element(a,'Autocorrelation Function',4,TRUE)
a<-table.row.end(a)
a<-table.row.start(a)
a<-table.element(a,'Time lag k',header=TRUE)
a<-table.element(a,hyperlink('basics.htm','ACF(k)','click here for more information about the Autocorrelation Function'),header=TRUE)
a<-table.element(a,'T-STAT',header=TRUE)
a<-table.element(a,'P-value',header=TRUE)
a<-table.row.end(a)
for (i in 2:(par1+1)) {
a<-table.row.start(a)
a<-table.element(a,i-1,header=TRUE)
a<-table.element(a,round(myacf[i],6))
mytstat <- myacf[i]*sqrtn
a<-table.element(a,round(mytstat,4))
a<-table.element(a,round(1-pt(abs(mytstat),lengthx),6))
a<-table.row.end(a)
}
a<-table.end(a)
table.save(a,file='mytable.tab')
a<-table.start()
a<-table.row.start(a)
a<-table.element(a,'Partial Autocorrelation Function',4,TRUE)
a<-table.row.end(a)
a<-table.row.start(a)
a<-table.element(a,'Time lag k',header=TRUE)
a<-table.element(a,hyperlink('basics.htm','PACF(k)','click here for more information about the Partial Autocorrelation Function'),header=TRUE)
a<-table.element(a,'T-STAT',header=TRUE)
a<-table.element(a,'P-value',header=TRUE)
a<-table.row.end(a)
for (i in 1:par1) {
a<-table.row.start(a)
a<-table.element(a,i,header=TRUE)
a<-table.element(a,round(mypacf[i],6))
mytstat <- mypacf[i]*sqrtn
a<-table.element(a,round(mytstat,4))
a<-table.element(a,round(1-pt(abs(mytstat),lengthx),6))
a<-table.row.end(a)
}
a<-table.end(a)
table.save(a,file='mytable1.tab')