Free Statistics

of Irreproducible Research!

Author's title

Author*The author of this computation has been verified*
R Software Modulerwasp_autocorrelation.wasp
Title produced by software(Partial) Autocorrelation Function
Date of computationFri, 19 Dec 2008 02:40:12 -0700
Cite this page as followsStatistical Computations at FreeStatistics.org, Office for Research Development and Education, URL https://freestatistics.org/blog/index.php?v=date/2008/Dec/19/t1229679735bjutrmvwvehfkgm.htm/, Retrieved Wed, 15 May 2024 12:52:20 +0000
Statistical Computations at FreeStatistics.org, Office for Research Development and Education, URL https://freestatistics.org/blog/index.php?pk=35007, Retrieved Wed, 15 May 2024 12:52:20 +0000
QR Codes:

Original text written by user:
IsPrivate?No (this computation is public)
User-defined keywords
Estimated Impact194
Family? (F = Feedback message, R = changed R code, M = changed R Module, P = changed Parameters, D = changed Data)
-     [Standard Deviation-Mean Plot] [tinneke_debock.pa...] [2008-12-18 18:24:23] [f9c5a49917ff87aeb076072f2749ef70]
- RMPD  [(Partial) Autocorrelation Function] [tinneke_debock.pa...] [2008-12-18 19:00:06] [f9c5a49917ff87aeb076072f2749ef70]
-   PD    [(Partial) Autocorrelation Function] [Paper statistiek_...] [2008-12-19 09:30:17] [fdc296cbeb5d8064cb0dbd634c3fdc55]
-   PD        [(Partial) Autocorrelation Function] [Paper statistiek_...] [2008-12-19 09:40:12] [e221948dd14811c7d88a6530ac2a8702] [Current]
-   P           [(Partial) Autocorrelation Function] [Paper statistiek_...] [2008-12-19 10:12:55] [fdc296cbeb5d8064cb0dbd634c3fdc55]
Feedback Forum

Post a new message
Dataseries X:
98.1
101.1
111.1
93.3
100
108
70.4
75.4
105.5
112.3
102.5
93.5
86.7
95.2
103.8
97
95.5
101
67.5
64
106.7
100.6
101.2
93.1
84.2
85.8
91.8
92.4
80.3
79.7
62.5
57.1
100.8
100.7
86.2
83.2
71.7
77.5
89.8
80.3
78.7
93.8
57.6
60.6
91
85.3
77.4
77.3
68.3
69.9
81.7
75.1
69.9
84
54.3
60
89.9
77
85.3
77.6
69.2
75.5
85.7
72.2
79.9
85.3
52.2
61.2
82.4
85.4
78.2
70.2
70.2
69.3
77.5
66.1
69
79.2
56.2
63.3
77.8
92
78.1
65.1
71.1
70.9
72
81.9
70.6
72.5
65.1
54.9
80


Summary of computational transaction
Raw Inputview raw input (R code)
Raw Outputview raw output of R engine
Computing time4 seconds
R Server'Herman Ole Andreas Wold' @ 193.190.124.10:1001

\begin{tabular}{lllllllll}
\hline
Summary of computational transaction \tabularnewline
Raw Input & view raw input (R code)  \tabularnewline
Raw Output & view raw output of R engine  \tabularnewline
Computing time & 4 seconds \tabularnewline
R Server & 'Herman Ole Andreas Wold' @ 193.190.124.10:1001 \tabularnewline
\hline
\end{tabular}
%Source: https://freestatistics.org/blog/index.php?pk=35007&T=0

[TABLE]
[ROW][C]Summary of computational transaction[/C][/ROW]
[ROW][C]Raw Input[/C][C]view raw input (R code) [/C][/ROW]
[ROW][C]Raw Output[/C][C]view raw output of R engine [/C][/ROW]
[ROW][C]Computing time[/C][C]4 seconds[/C][/ROW]
[ROW][C]R Server[/C][C]'Herman Ole Andreas Wold' @ 193.190.124.10:1001[/C][/ROW]
[/TABLE]
Source: https://freestatistics.org/blog/index.php?pk=35007&T=0

Globally Unique Identifier (entire table): ba.freestatistics.org/blog/index.php?pk=35007&T=0

As an alternative you can also use a QR Code:  

The GUIDs for individual cells are displayed in the table below:

Summary of computational transaction
Raw Inputview raw input (R code)
Raw Outputview raw output of R engine
Computing time4 seconds
R Server'Herman Ole Andreas Wold' @ 193.190.124.10:1001


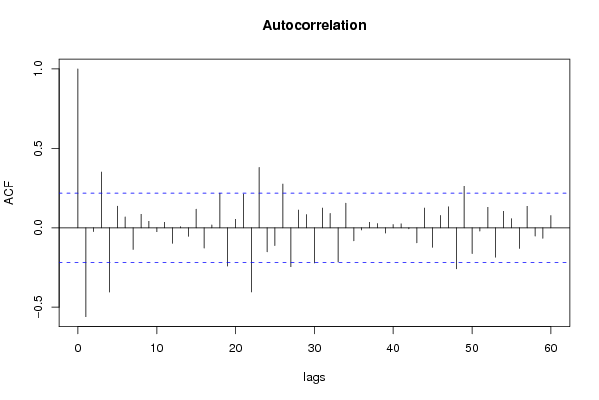
Autocorrelation Function
Time lag kACF(k)T-STATP-value
1-0.559248-5.00212e-06
2-0.023857-0.21340.415784
30.3510593.140.001184
4-0.404759-3.62030.000257
50.1361461.21770.113453
60.0686180.61370.270566
7-0.136398-1.220.113029
80.0848080.75850.225175
90.0407990.36490.358068
10-0.02417-0.21620.414698
110.0345910.30940.378913
12-0.097611-0.87310.192623
130.0068690.06140.475583
14-0.053652-0.47990.316312
150.1172241.04850.148786
16-0.127852-1.14350.128111
170.0182780.16350.435277
180.2183131.95270.027179
19-0.241188-2.15730.016993
200.0533810.47750.317172
210.2121781.89780.030666
22-0.403316-3.60740.000268
230.3800483.39920.000528
24-0.151444-1.35460.089687
25-0.112046-1.00220.159641
260.2754082.46330.007956
27-0.244937-2.19080.015689
280.1116580.99870.160475
290.0833570.74560.229058
30-0.221346-1.97980.025584
310.1246231.11470.134166
320.0902950.80760.210853
33-0.215207-1.92490.0289
340.1552831.38890.08436
35-0.081742-0.73110.23342
36-0.013519-0.12090.45203
370.0348480.31170.378043
380.0271260.24260.404459
39-0.032888-0.29420.384699
400.0207790.18590.426514
410.0250760.22430.411554
42-0.006098-0.05450.478318
43-0.094541-0.84560.200148
440.1246281.11470.134157
45-0.122814-1.09850.137645
460.0776770.69480.244608
470.1323611.18390.119985
48-0.258309-2.31040.011722
490.2609442.3340.011054
50-0.162175-1.45050.07541
51-0.020131-0.18010.42878
520.1294071.15750.125265
53-0.185173-1.65620.050795
540.1036050.92670.178443
550.0572850.51240.304901
56-0.129703-1.16010.12473
570.135081.20820.115267
58-0.051951-0.46470.321718
59-0.065876-0.58920.27869
600.0768050.6870.247045

\begin{tabular}{lllllllll}
\hline
Autocorrelation Function \tabularnewline
Time lag k & ACF(k) & T-STAT & P-value \tabularnewline
1 & -0.559248 & -5.0021 & 2e-06 \tabularnewline
2 & -0.023857 & -0.2134 & 0.415784 \tabularnewline
3 & 0.351059 & 3.14 & 0.001184 \tabularnewline
4 & -0.404759 & -3.6203 & 0.000257 \tabularnewline
5 & 0.136146 & 1.2177 & 0.113453 \tabularnewline
6 & 0.068618 & 0.6137 & 0.270566 \tabularnewline
7 & -0.136398 & -1.22 & 0.113029 \tabularnewline
8 & 0.084808 & 0.7585 & 0.225175 \tabularnewline
9 & 0.040799 & 0.3649 & 0.358068 \tabularnewline
10 & -0.02417 & -0.2162 & 0.414698 \tabularnewline
11 & 0.034591 & 0.3094 & 0.378913 \tabularnewline
12 & -0.097611 & -0.8731 & 0.192623 \tabularnewline
13 & 0.006869 & 0.0614 & 0.475583 \tabularnewline
14 & -0.053652 & -0.4799 & 0.316312 \tabularnewline
15 & 0.117224 & 1.0485 & 0.148786 \tabularnewline
16 & -0.127852 & -1.1435 & 0.128111 \tabularnewline
17 & 0.018278 & 0.1635 & 0.435277 \tabularnewline
18 & 0.218313 & 1.9527 & 0.027179 \tabularnewline
19 & -0.241188 & -2.1573 & 0.016993 \tabularnewline
20 & 0.053381 & 0.4775 & 0.317172 \tabularnewline
21 & 0.212178 & 1.8978 & 0.030666 \tabularnewline
22 & -0.403316 & -3.6074 & 0.000268 \tabularnewline
23 & 0.380048 & 3.3992 & 0.000528 \tabularnewline
24 & -0.151444 & -1.3546 & 0.089687 \tabularnewline
25 & -0.112046 & -1.0022 & 0.159641 \tabularnewline
26 & 0.275408 & 2.4633 & 0.007956 \tabularnewline
27 & -0.244937 & -2.1908 & 0.015689 \tabularnewline
28 & 0.111658 & 0.9987 & 0.160475 \tabularnewline
29 & 0.083357 & 0.7456 & 0.229058 \tabularnewline
30 & -0.221346 & -1.9798 & 0.025584 \tabularnewline
31 & 0.124623 & 1.1147 & 0.134166 \tabularnewline
32 & 0.090295 & 0.8076 & 0.210853 \tabularnewline
33 & -0.215207 & -1.9249 & 0.0289 \tabularnewline
34 & 0.155283 & 1.3889 & 0.08436 \tabularnewline
35 & -0.081742 & -0.7311 & 0.23342 \tabularnewline
36 & -0.013519 & -0.1209 & 0.45203 \tabularnewline
37 & 0.034848 & 0.3117 & 0.378043 \tabularnewline
38 & 0.027126 & 0.2426 & 0.404459 \tabularnewline
39 & -0.032888 & -0.2942 & 0.384699 \tabularnewline
40 & 0.020779 & 0.1859 & 0.426514 \tabularnewline
41 & 0.025076 & 0.2243 & 0.411554 \tabularnewline
42 & -0.006098 & -0.0545 & 0.478318 \tabularnewline
43 & -0.094541 & -0.8456 & 0.200148 \tabularnewline
44 & 0.124628 & 1.1147 & 0.134157 \tabularnewline
45 & -0.122814 & -1.0985 & 0.137645 \tabularnewline
46 & 0.077677 & 0.6948 & 0.244608 \tabularnewline
47 & 0.132361 & 1.1839 & 0.119985 \tabularnewline
48 & -0.258309 & -2.3104 & 0.011722 \tabularnewline
49 & 0.260944 & 2.334 & 0.011054 \tabularnewline
50 & -0.162175 & -1.4505 & 0.07541 \tabularnewline
51 & -0.020131 & -0.1801 & 0.42878 \tabularnewline
52 & 0.129407 & 1.1575 & 0.125265 \tabularnewline
53 & -0.185173 & -1.6562 & 0.050795 \tabularnewline
54 & 0.103605 & 0.9267 & 0.178443 \tabularnewline
55 & 0.057285 & 0.5124 & 0.304901 \tabularnewline
56 & -0.129703 & -1.1601 & 0.12473 \tabularnewline
57 & 0.13508 & 1.2082 & 0.115267 \tabularnewline
58 & -0.051951 & -0.4647 & 0.321718 \tabularnewline
59 & -0.065876 & -0.5892 & 0.27869 \tabularnewline
60 & 0.076805 & 0.687 & 0.247045 \tabularnewline
\hline
\end{tabular}
%Source: https://freestatistics.org/blog/index.php?pk=35007&T=1

[TABLE]
[ROW][C]Autocorrelation Function[/C][/ROW]
[ROW][C]Time lag k[/C][C]ACF(k)[/C][C]T-STAT[/C][C]P-value[/C][/ROW]
[ROW][C]1[/C][C]-0.559248[/C][C]-5.0021[/C][C]2e-06[/C][/ROW]
[ROW][C]2[/C][C]-0.023857[/C][C]-0.2134[/C][C]0.415784[/C][/ROW]
[ROW][C]3[/C][C]0.351059[/C][C]3.14[/C][C]0.001184[/C][/ROW]
[ROW][C]4[/C][C]-0.404759[/C][C]-3.6203[/C][C]0.000257[/C][/ROW]
[ROW][C]5[/C][C]0.136146[/C][C]1.2177[/C][C]0.113453[/C][/ROW]
[ROW][C]6[/C][C]0.068618[/C][C]0.6137[/C][C]0.270566[/C][/ROW]
[ROW][C]7[/C][C]-0.136398[/C][C]-1.22[/C][C]0.113029[/C][/ROW]
[ROW][C]8[/C][C]0.084808[/C][C]0.7585[/C][C]0.225175[/C][/ROW]
[ROW][C]9[/C][C]0.040799[/C][C]0.3649[/C][C]0.358068[/C][/ROW]
[ROW][C]10[/C][C]-0.02417[/C][C]-0.2162[/C][C]0.414698[/C][/ROW]
[ROW][C]11[/C][C]0.034591[/C][C]0.3094[/C][C]0.378913[/C][/ROW]
[ROW][C]12[/C][C]-0.097611[/C][C]-0.8731[/C][C]0.192623[/C][/ROW]
[ROW][C]13[/C][C]0.006869[/C][C]0.0614[/C][C]0.475583[/C][/ROW]
[ROW][C]14[/C][C]-0.053652[/C][C]-0.4799[/C][C]0.316312[/C][/ROW]
[ROW][C]15[/C][C]0.117224[/C][C]1.0485[/C][C]0.148786[/C][/ROW]
[ROW][C]16[/C][C]-0.127852[/C][C]-1.1435[/C][C]0.128111[/C][/ROW]
[ROW][C]17[/C][C]0.018278[/C][C]0.1635[/C][C]0.435277[/C][/ROW]
[ROW][C]18[/C][C]0.218313[/C][C]1.9527[/C][C]0.027179[/C][/ROW]
[ROW][C]19[/C][C]-0.241188[/C][C]-2.1573[/C][C]0.016993[/C][/ROW]
[ROW][C]20[/C][C]0.053381[/C][C]0.4775[/C][C]0.317172[/C][/ROW]
[ROW][C]21[/C][C]0.212178[/C][C]1.8978[/C][C]0.030666[/C][/ROW]
[ROW][C]22[/C][C]-0.403316[/C][C]-3.6074[/C][C]0.000268[/C][/ROW]
[ROW][C]23[/C][C]0.380048[/C][C]3.3992[/C][C]0.000528[/C][/ROW]
[ROW][C]24[/C][C]-0.151444[/C][C]-1.3546[/C][C]0.089687[/C][/ROW]
[ROW][C]25[/C][C]-0.112046[/C][C]-1.0022[/C][C]0.159641[/C][/ROW]
[ROW][C]26[/C][C]0.275408[/C][C]2.4633[/C][C]0.007956[/C][/ROW]
[ROW][C]27[/C][C]-0.244937[/C][C]-2.1908[/C][C]0.015689[/C][/ROW]
[ROW][C]28[/C][C]0.111658[/C][C]0.9987[/C][C]0.160475[/C][/ROW]
[ROW][C]29[/C][C]0.083357[/C][C]0.7456[/C][C]0.229058[/C][/ROW]
[ROW][C]30[/C][C]-0.221346[/C][C]-1.9798[/C][C]0.025584[/C][/ROW]
[ROW][C]31[/C][C]0.124623[/C][C]1.1147[/C][C]0.134166[/C][/ROW]
[ROW][C]32[/C][C]0.090295[/C][C]0.8076[/C][C]0.210853[/C][/ROW]
[ROW][C]33[/C][C]-0.215207[/C][C]-1.9249[/C][C]0.0289[/C][/ROW]
[ROW][C]34[/C][C]0.155283[/C][C]1.3889[/C][C]0.08436[/C][/ROW]
[ROW][C]35[/C][C]-0.081742[/C][C]-0.7311[/C][C]0.23342[/C][/ROW]
[ROW][C]36[/C][C]-0.013519[/C][C]-0.1209[/C][C]0.45203[/C][/ROW]
[ROW][C]37[/C][C]0.034848[/C][C]0.3117[/C][C]0.378043[/C][/ROW]
[ROW][C]38[/C][C]0.027126[/C][C]0.2426[/C][C]0.404459[/C][/ROW]
[ROW][C]39[/C][C]-0.032888[/C][C]-0.2942[/C][C]0.384699[/C][/ROW]
[ROW][C]40[/C][C]0.020779[/C][C]0.1859[/C][C]0.426514[/C][/ROW]
[ROW][C]41[/C][C]0.025076[/C][C]0.2243[/C][C]0.411554[/C][/ROW]
[ROW][C]42[/C][C]-0.006098[/C][C]-0.0545[/C][C]0.478318[/C][/ROW]
[ROW][C]43[/C][C]-0.094541[/C][C]-0.8456[/C][C]0.200148[/C][/ROW]
[ROW][C]44[/C][C]0.124628[/C][C]1.1147[/C][C]0.134157[/C][/ROW]
[ROW][C]45[/C][C]-0.122814[/C][C]-1.0985[/C][C]0.137645[/C][/ROW]
[ROW][C]46[/C][C]0.077677[/C][C]0.6948[/C][C]0.244608[/C][/ROW]
[ROW][C]47[/C][C]0.132361[/C][C]1.1839[/C][C]0.119985[/C][/ROW]
[ROW][C]48[/C][C]-0.258309[/C][C]-2.3104[/C][C]0.011722[/C][/ROW]
[ROW][C]49[/C][C]0.260944[/C][C]2.334[/C][C]0.011054[/C][/ROW]
[ROW][C]50[/C][C]-0.162175[/C][C]-1.4505[/C][C]0.07541[/C][/ROW]
[ROW][C]51[/C][C]-0.020131[/C][C]-0.1801[/C][C]0.42878[/C][/ROW]
[ROW][C]52[/C][C]0.129407[/C][C]1.1575[/C][C]0.125265[/C][/ROW]
[ROW][C]53[/C][C]-0.185173[/C][C]-1.6562[/C][C]0.050795[/C][/ROW]
[ROW][C]54[/C][C]0.103605[/C][C]0.9267[/C][C]0.178443[/C][/ROW]
[ROW][C]55[/C][C]0.057285[/C][C]0.5124[/C][C]0.304901[/C][/ROW]
[ROW][C]56[/C][C]-0.129703[/C][C]-1.1601[/C][C]0.12473[/C][/ROW]
[ROW][C]57[/C][C]0.13508[/C][C]1.2082[/C][C]0.115267[/C][/ROW]
[ROW][C]58[/C][C]-0.051951[/C][C]-0.4647[/C][C]0.321718[/C][/ROW]
[ROW][C]59[/C][C]-0.065876[/C][C]-0.5892[/C][C]0.27869[/C][/ROW]
[ROW][C]60[/C][C]0.076805[/C][C]0.687[/C][C]0.247045[/C][/ROW]
[/TABLE]
Source: https://freestatistics.org/blog/index.php?pk=35007&T=1

Globally Unique Identifier (entire table): ba.freestatistics.org/blog/index.php?pk=35007&T=1

As an alternative you can also use a QR Code:  

The GUIDs for individual cells are displayed in the table below:

Autocorrelation Function
Time lag kACF(k)T-STATP-value
1-0.559248-5.00212e-06
2-0.023857-0.21340.415784
30.3510593.140.001184
4-0.404759-3.62030.000257
50.1361461.21770.113453
60.0686180.61370.270566
7-0.136398-1.220.113029
80.0848080.75850.225175
90.0407990.36490.358068
10-0.02417-0.21620.414698
110.0345910.30940.378913
12-0.097611-0.87310.192623
130.0068690.06140.475583
14-0.053652-0.47990.316312
150.1172241.04850.148786
16-0.127852-1.14350.128111
170.0182780.16350.435277
180.2183131.95270.027179
19-0.241188-2.15730.016993
200.0533810.47750.317172
210.2121781.89780.030666
22-0.403316-3.60740.000268
230.3800483.39920.000528
24-0.151444-1.35460.089687
25-0.112046-1.00220.159641
260.2754082.46330.007956
27-0.244937-2.19080.015689
280.1116580.99870.160475
290.0833570.74560.229058
30-0.221346-1.97980.025584
310.1246231.11470.134166
320.0902950.80760.210853
33-0.215207-1.92490.0289
340.1552831.38890.08436
35-0.081742-0.73110.23342
36-0.013519-0.12090.45203
370.0348480.31170.378043
380.0271260.24260.404459
39-0.032888-0.29420.384699
400.0207790.18590.426514
410.0250760.22430.411554
42-0.006098-0.05450.478318
43-0.094541-0.84560.200148
440.1246281.11470.134157
45-0.122814-1.09850.137645
460.0776770.69480.244608
470.1323611.18390.119985
48-0.258309-2.31040.011722
490.2609442.3340.011054
50-0.162175-1.45050.07541
51-0.020131-0.18010.42878
520.1294071.15750.125265
53-0.185173-1.65620.050795
540.1036050.92670.178443
550.0572850.51240.304901
56-0.129703-1.16010.12473
570.135081.20820.115267
58-0.051951-0.46470.321718
59-0.065876-0.58920.27869
600.0768050.6870.247045


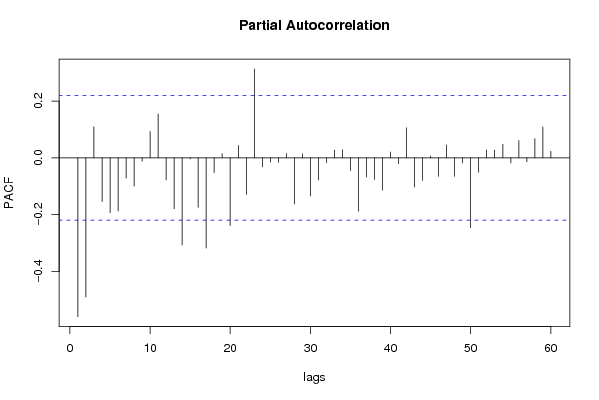
Partial Autocorrelation Function
Time lag kPACF(k)T-STATP-value
1-0.559248-5.00212e-06
2-0.489806-4.3811.8e-05
30.1096150.98040.164916
4-0.153694-1.37470.086534
5-0.193179-1.72780.043937
6-0.187276-1.6750.048915
7-0.071444-0.6390.262318
8-0.099201-0.88730.188794
9-0.012063-0.10790.457175
100.0927070.82920.204729
110.1542361.37950.085788
12-0.077954-0.69720.243835
13-0.179288-1.60360.056372
14-0.306844-2.74450.00374
15-0.004019-0.03590.485707
16-0.174284-1.55880.06149
17-0.317744-2.8420.002843
18-0.052021-0.46530.321495
190.0147180.13160.447798
20-0.237975-2.12850.018186
210.0434860.38890.349174
22-0.129046-1.15420.125923
230.3130062.79960.003205
24-0.031475-0.28150.389518
25-0.014979-0.1340.446877
26-0.015948-0.14260.443466
270.0148950.13320.447175
28-0.162441-1.45290.075079
290.0141660.12670.449745
30-0.134024-1.19870.117083
31-0.077617-0.69420.244777
32-0.01768-0.15810.437375
330.0270260.24170.404804
340.0284280.25430.399971
35-0.045443-0.40650.342747
36-0.188006-1.68160.048275
37-0.067168-0.60080.274845
38-0.07612-0.68080.248969
39-0.113567-1.01580.156399
400.0204380.18280.427707
41-0.020405-0.18250.427822
420.1056940.94540.173663
43-0.102989-0.92120.179869
44-0.079463-0.71070.239656
450.0065530.05860.476705
46-0.065059-0.58190.281134
470.0455550.40750.342381
48-0.06503-0.58160.281219
49-0.017784-0.15910.43701
50-0.245775-2.19830.01541
51-0.050319-0.45010.32694
520.0272620.24380.40399
530.0267760.23950.405667
540.0476490.42620.335559
55-0.01783-0.15950.436847
560.0606580.54250.294476
57-0.014131-0.12640.449868
580.0672990.60190.274458
590.1086740.9720.166988
600.0234460.20970.417215

\begin{tabular}{lllllllll}
\hline
Partial Autocorrelation Function \tabularnewline
Time lag k & PACF(k) & T-STAT & P-value \tabularnewline
1 & -0.559248 & -5.0021 & 2e-06 \tabularnewline
2 & -0.489806 & -4.381 & 1.8e-05 \tabularnewline
3 & 0.109615 & 0.9804 & 0.164916 \tabularnewline
4 & -0.153694 & -1.3747 & 0.086534 \tabularnewline
5 & -0.193179 & -1.7278 & 0.043937 \tabularnewline
6 & -0.187276 & -1.675 & 0.048915 \tabularnewline
7 & -0.071444 & -0.639 & 0.262318 \tabularnewline
8 & -0.099201 & -0.8873 & 0.188794 \tabularnewline
9 & -0.012063 & -0.1079 & 0.457175 \tabularnewline
10 & 0.092707 & 0.8292 & 0.204729 \tabularnewline
11 & 0.154236 & 1.3795 & 0.085788 \tabularnewline
12 & -0.077954 & -0.6972 & 0.243835 \tabularnewline
13 & -0.179288 & -1.6036 & 0.056372 \tabularnewline
14 & -0.306844 & -2.7445 & 0.00374 \tabularnewline
15 & -0.004019 & -0.0359 & 0.485707 \tabularnewline
16 & -0.174284 & -1.5588 & 0.06149 \tabularnewline
17 & -0.317744 & -2.842 & 0.002843 \tabularnewline
18 & -0.052021 & -0.4653 & 0.321495 \tabularnewline
19 & 0.014718 & 0.1316 & 0.447798 \tabularnewline
20 & -0.237975 & -2.1285 & 0.018186 \tabularnewline
21 & 0.043486 & 0.3889 & 0.349174 \tabularnewline
22 & -0.129046 & -1.1542 & 0.125923 \tabularnewline
23 & 0.313006 & 2.7996 & 0.003205 \tabularnewline
24 & -0.031475 & -0.2815 & 0.389518 \tabularnewline
25 & -0.014979 & -0.134 & 0.446877 \tabularnewline
26 & -0.015948 & -0.1426 & 0.443466 \tabularnewline
27 & 0.014895 & 0.1332 & 0.447175 \tabularnewline
28 & -0.162441 & -1.4529 & 0.075079 \tabularnewline
29 & 0.014166 & 0.1267 & 0.449745 \tabularnewline
30 & -0.134024 & -1.1987 & 0.117083 \tabularnewline
31 & -0.077617 & -0.6942 & 0.244777 \tabularnewline
32 & -0.01768 & -0.1581 & 0.437375 \tabularnewline
33 & 0.027026 & 0.2417 & 0.404804 \tabularnewline
34 & 0.028428 & 0.2543 & 0.399971 \tabularnewline
35 & -0.045443 & -0.4065 & 0.342747 \tabularnewline
36 & -0.188006 & -1.6816 & 0.048275 \tabularnewline
37 & -0.067168 & -0.6008 & 0.274845 \tabularnewline
38 & -0.07612 & -0.6808 & 0.248969 \tabularnewline
39 & -0.113567 & -1.0158 & 0.156399 \tabularnewline
40 & 0.020438 & 0.1828 & 0.427707 \tabularnewline
41 & -0.020405 & -0.1825 & 0.427822 \tabularnewline
42 & 0.105694 & 0.9454 & 0.173663 \tabularnewline
43 & -0.102989 & -0.9212 & 0.179869 \tabularnewline
44 & -0.079463 & -0.7107 & 0.239656 \tabularnewline
45 & 0.006553 & 0.0586 & 0.476705 \tabularnewline
46 & -0.065059 & -0.5819 & 0.281134 \tabularnewline
47 & 0.045555 & 0.4075 & 0.342381 \tabularnewline
48 & -0.06503 & -0.5816 & 0.281219 \tabularnewline
49 & -0.017784 & -0.1591 & 0.43701 \tabularnewline
50 & -0.245775 & -2.1983 & 0.01541 \tabularnewline
51 & -0.050319 & -0.4501 & 0.32694 \tabularnewline
52 & 0.027262 & 0.2438 & 0.40399 \tabularnewline
53 & 0.026776 & 0.2395 & 0.405667 \tabularnewline
54 & 0.047649 & 0.4262 & 0.335559 \tabularnewline
55 & -0.01783 & -0.1595 & 0.436847 \tabularnewline
56 & 0.060658 & 0.5425 & 0.294476 \tabularnewline
57 & -0.014131 & -0.1264 & 0.449868 \tabularnewline
58 & 0.067299 & 0.6019 & 0.274458 \tabularnewline
59 & 0.108674 & 0.972 & 0.166988 \tabularnewline
60 & 0.023446 & 0.2097 & 0.417215 \tabularnewline
\hline
\end{tabular}
%Source: https://freestatistics.org/blog/index.php?pk=35007&T=2

[TABLE]
[ROW][C]Partial Autocorrelation Function[/C][/ROW]
[ROW][C]Time lag k[/C][C]PACF(k)[/C][C]T-STAT[/C][C]P-value[/C][/ROW]
[ROW][C]1[/C][C]-0.559248[/C][C]-5.0021[/C][C]2e-06[/C][/ROW]
[ROW][C]2[/C][C]-0.489806[/C][C]-4.381[/C][C]1.8e-05[/C][/ROW]
[ROW][C]3[/C][C]0.109615[/C][C]0.9804[/C][C]0.164916[/C][/ROW]
[ROW][C]4[/C][C]-0.153694[/C][C]-1.3747[/C][C]0.086534[/C][/ROW]
[ROW][C]5[/C][C]-0.193179[/C][C]-1.7278[/C][C]0.043937[/C][/ROW]
[ROW][C]6[/C][C]-0.187276[/C][C]-1.675[/C][C]0.048915[/C][/ROW]
[ROW][C]7[/C][C]-0.071444[/C][C]-0.639[/C][C]0.262318[/C][/ROW]
[ROW][C]8[/C][C]-0.099201[/C][C]-0.8873[/C][C]0.188794[/C][/ROW]
[ROW][C]9[/C][C]-0.012063[/C][C]-0.1079[/C][C]0.457175[/C][/ROW]
[ROW][C]10[/C][C]0.092707[/C][C]0.8292[/C][C]0.204729[/C][/ROW]
[ROW][C]11[/C][C]0.154236[/C][C]1.3795[/C][C]0.085788[/C][/ROW]
[ROW][C]12[/C][C]-0.077954[/C][C]-0.6972[/C][C]0.243835[/C][/ROW]
[ROW][C]13[/C][C]-0.179288[/C][C]-1.6036[/C][C]0.056372[/C][/ROW]
[ROW][C]14[/C][C]-0.306844[/C][C]-2.7445[/C][C]0.00374[/C][/ROW]
[ROW][C]15[/C][C]-0.004019[/C][C]-0.0359[/C][C]0.485707[/C][/ROW]
[ROW][C]16[/C][C]-0.174284[/C][C]-1.5588[/C][C]0.06149[/C][/ROW]
[ROW][C]17[/C][C]-0.317744[/C][C]-2.842[/C][C]0.002843[/C][/ROW]
[ROW][C]18[/C][C]-0.052021[/C][C]-0.4653[/C][C]0.321495[/C][/ROW]
[ROW][C]19[/C][C]0.014718[/C][C]0.1316[/C][C]0.447798[/C][/ROW]
[ROW][C]20[/C][C]-0.237975[/C][C]-2.1285[/C][C]0.018186[/C][/ROW]
[ROW][C]21[/C][C]0.043486[/C][C]0.3889[/C][C]0.349174[/C][/ROW]
[ROW][C]22[/C][C]-0.129046[/C][C]-1.1542[/C][C]0.125923[/C][/ROW]
[ROW][C]23[/C][C]0.313006[/C][C]2.7996[/C][C]0.003205[/C][/ROW]
[ROW][C]24[/C][C]-0.031475[/C][C]-0.2815[/C][C]0.389518[/C][/ROW]
[ROW][C]25[/C][C]-0.014979[/C][C]-0.134[/C][C]0.446877[/C][/ROW]
[ROW][C]26[/C][C]-0.015948[/C][C]-0.1426[/C][C]0.443466[/C][/ROW]
[ROW][C]27[/C][C]0.014895[/C][C]0.1332[/C][C]0.447175[/C][/ROW]
[ROW][C]28[/C][C]-0.162441[/C][C]-1.4529[/C][C]0.075079[/C][/ROW]
[ROW][C]29[/C][C]0.014166[/C][C]0.1267[/C][C]0.449745[/C][/ROW]
[ROW][C]30[/C][C]-0.134024[/C][C]-1.1987[/C][C]0.117083[/C][/ROW]
[ROW][C]31[/C][C]-0.077617[/C][C]-0.6942[/C][C]0.244777[/C][/ROW]
[ROW][C]32[/C][C]-0.01768[/C][C]-0.1581[/C][C]0.437375[/C][/ROW]
[ROW][C]33[/C][C]0.027026[/C][C]0.2417[/C][C]0.404804[/C][/ROW]
[ROW][C]34[/C][C]0.028428[/C][C]0.2543[/C][C]0.399971[/C][/ROW]
[ROW][C]35[/C][C]-0.045443[/C][C]-0.4065[/C][C]0.342747[/C][/ROW]
[ROW][C]36[/C][C]-0.188006[/C][C]-1.6816[/C][C]0.048275[/C][/ROW]
[ROW][C]37[/C][C]-0.067168[/C][C]-0.6008[/C][C]0.274845[/C][/ROW]
[ROW][C]38[/C][C]-0.07612[/C][C]-0.6808[/C][C]0.248969[/C][/ROW]
[ROW][C]39[/C][C]-0.113567[/C][C]-1.0158[/C][C]0.156399[/C][/ROW]
[ROW][C]40[/C][C]0.020438[/C][C]0.1828[/C][C]0.427707[/C][/ROW]
[ROW][C]41[/C][C]-0.020405[/C][C]-0.1825[/C][C]0.427822[/C][/ROW]
[ROW][C]42[/C][C]0.105694[/C][C]0.9454[/C][C]0.173663[/C][/ROW]
[ROW][C]43[/C][C]-0.102989[/C][C]-0.9212[/C][C]0.179869[/C][/ROW]
[ROW][C]44[/C][C]-0.079463[/C][C]-0.7107[/C][C]0.239656[/C][/ROW]
[ROW][C]45[/C][C]0.006553[/C][C]0.0586[/C][C]0.476705[/C][/ROW]
[ROW][C]46[/C][C]-0.065059[/C][C]-0.5819[/C][C]0.281134[/C][/ROW]
[ROW][C]47[/C][C]0.045555[/C][C]0.4075[/C][C]0.342381[/C][/ROW]
[ROW][C]48[/C][C]-0.06503[/C][C]-0.5816[/C][C]0.281219[/C][/ROW]
[ROW][C]49[/C][C]-0.017784[/C][C]-0.1591[/C][C]0.43701[/C][/ROW]
[ROW][C]50[/C][C]-0.245775[/C][C]-2.1983[/C][C]0.01541[/C][/ROW]
[ROW][C]51[/C][C]-0.050319[/C][C]-0.4501[/C][C]0.32694[/C][/ROW]
[ROW][C]52[/C][C]0.027262[/C][C]0.2438[/C][C]0.40399[/C][/ROW]
[ROW][C]53[/C][C]0.026776[/C][C]0.2395[/C][C]0.405667[/C][/ROW]
[ROW][C]54[/C][C]0.047649[/C][C]0.4262[/C][C]0.335559[/C][/ROW]
[ROW][C]55[/C][C]-0.01783[/C][C]-0.1595[/C][C]0.436847[/C][/ROW]
[ROW][C]56[/C][C]0.060658[/C][C]0.5425[/C][C]0.294476[/C][/ROW]
[ROW][C]57[/C][C]-0.014131[/C][C]-0.1264[/C][C]0.449868[/C][/ROW]
[ROW][C]58[/C][C]0.067299[/C][C]0.6019[/C][C]0.274458[/C][/ROW]
[ROW][C]59[/C][C]0.108674[/C][C]0.972[/C][C]0.166988[/C][/ROW]
[ROW][C]60[/C][C]0.023446[/C][C]0.2097[/C][C]0.417215[/C][/ROW]
[/TABLE]
Source: https://freestatistics.org/blog/index.php?pk=35007&T=2

Globally Unique Identifier (entire table): ba.freestatistics.org/blog/index.php?pk=35007&T=2

As an alternative you can also use a QR Code:  

The GUIDs for individual cells are displayed in the table below:

Partial Autocorrelation Function
Time lag kPACF(k)T-STATP-value
1-0.559248-5.00212e-06
2-0.489806-4.3811.8e-05
30.1096150.98040.164916
4-0.153694-1.37470.086534
5-0.193179-1.72780.043937
6-0.187276-1.6750.048915
7-0.071444-0.6390.262318
8-0.099201-0.88730.188794
9-0.012063-0.10790.457175
100.0927070.82920.204729
110.1542361.37950.085788
12-0.077954-0.69720.243835
13-0.179288-1.60360.056372
14-0.306844-2.74450.00374
15-0.004019-0.03590.485707
16-0.174284-1.55880.06149
17-0.317744-2.8420.002843
18-0.052021-0.46530.321495
190.0147180.13160.447798
20-0.237975-2.12850.018186
210.0434860.38890.349174
22-0.129046-1.15420.125923
230.3130062.79960.003205
24-0.031475-0.28150.389518
25-0.014979-0.1340.446877
26-0.015948-0.14260.443466
270.0148950.13320.447175
28-0.162441-1.45290.075079
290.0141660.12670.449745
30-0.134024-1.19870.117083
31-0.077617-0.69420.244777
32-0.01768-0.15810.437375
330.0270260.24170.404804
340.0284280.25430.399971
35-0.045443-0.40650.342747
36-0.188006-1.68160.048275
37-0.067168-0.60080.274845
38-0.07612-0.68080.248969
39-0.113567-1.01580.156399
400.0204380.18280.427707
41-0.020405-0.18250.427822
420.1056940.94540.173663
43-0.102989-0.92120.179869
44-0.079463-0.71070.239656
450.0065530.05860.476705
46-0.065059-0.58190.281134
470.0455550.40750.342381
48-0.06503-0.58160.281219
49-0.017784-0.15910.43701
50-0.245775-2.19830.01541
51-0.050319-0.45010.32694
520.0272620.24380.40399
530.0267760.23950.405667
540.0476490.42620.335559
55-0.01783-0.15950.436847
560.0606580.54250.294476
57-0.014131-0.12640.449868
580.0672990.60190.274458
590.1086740.9720.166988
600.0234460.20970.417215


Parameters (Session):
par1 = 60 ; par2 = -0.1 ; par3 = 1 ; par4 = 1 ; par5 = 12 ;
Parameters (R input):
par1 = 60 ; par2 = -0.1 ; par3 = 1 ; par4 = 1 ; par5 = 12 ;
R code (references can be found in the software module):
if (par1 == 'Default') {
par1 = 10*log10(length(x))
} else {
par1 <- as.numeric(par1)
}
par2 <- as.numeric(par2)
par3 <- as.numeric(par3)
par4 <- as.numeric(par4)
par5 <- as.numeric(par5)
if (par2 == 0) {
x <- log(x)
} else {
x <- (x ^ par2 - 1) / par2
}
if (par3 > 0) x <- diff(x,lag=1,difference=par3)
if (par4 > 0) x <- diff(x,lag=par5,difference=par4)
bitmap(file='pic1.png')
racf <- acf(x,par1,main='Autocorrelation',xlab='lags',ylab='ACF')
dev.off()
bitmap(file='pic2.png')
rpacf <- pacf(x,par1,main='Partial Autocorrelation',xlab='lags',ylab='PACF')
dev.off()
(myacf <- c(racf$acf))
(mypacf <- c(rpacf$acf))
lengthx <- length(x)
sqrtn <- sqrt(lengthx)
load(file='createtable')
a<-table.start()
a<-table.row.start(a)
a<-table.element(a,'Autocorrelation Function',4,TRUE)
a<-table.row.end(a)
a<-table.row.start(a)
a<-table.element(a,'Time lag k',header=TRUE)
a<-table.element(a,hyperlink('basics.htm','ACF(k)','click here for more information about the Autocorrelation Function'),header=TRUE)
a<-table.element(a,'T-STAT',header=TRUE)
a<-table.element(a,'P-value',header=TRUE)
a<-table.row.end(a)
for (i in 2:(par1+1)) {
a<-table.row.start(a)
a<-table.element(a,i-1,header=TRUE)
a<-table.element(a,round(myacf[i],6))
mytstat <- myacf[i]*sqrtn
a<-table.element(a,round(mytstat,4))
a<-table.element(a,round(1-pt(abs(mytstat),lengthx),6))
a<-table.row.end(a)
}
a<-table.end(a)
table.save(a,file='mytable.tab')
a<-table.start()
a<-table.row.start(a)
a<-table.element(a,'Partial Autocorrelation Function',4,TRUE)
a<-table.row.end(a)
a<-table.row.start(a)
a<-table.element(a,'Time lag k',header=TRUE)
a<-table.element(a,hyperlink('basics.htm','PACF(k)','click here for more information about the Partial Autocorrelation Function'),header=TRUE)
a<-table.element(a,'T-STAT',header=TRUE)
a<-table.element(a,'P-value',header=TRUE)
a<-table.row.end(a)
for (i in 1:par1) {
a<-table.row.start(a)
a<-table.element(a,i,header=TRUE)
a<-table.element(a,round(mypacf[i],6))
mytstat <- mypacf[i]*sqrtn
a<-table.element(a,round(mytstat,4))
a<-table.element(a,round(1-pt(abs(mytstat),lengthx),6))
a<-table.row.end(a)
}
a<-table.end(a)
table.save(a,file='mytable1.tab')