Free Statistics

of Irreproducible Research!

Author's title

Author*Unverified author*
R Software Modulerwasp_multipleregression.wasp
Title produced by softwareMultiple Regression
Date of computationThu, 18 Dec 2008 11:59:33 -0700
Cite this page as followsStatistical Computations at FreeStatistics.org, Office for Research Development and Education, URL https://freestatistics.org/blog/index.php?v=date/2008/Dec/18/t12296268294eug8zr6hc7epab.htm/, Retrieved Sat, 11 May 2024 14:08:11 +0000
Statistical Computations at FreeStatistics.org, Office for Research Development and Education, URL https://freestatistics.org/blog/index.php?pk=34936, Retrieved Sat, 11 May 2024 14:08:11 +0000
QR Codes:

Original text written by user:
IsPrivate?No (this computation is public)
User-defined keywords
Estimated Impact174
Family? (F = Feedback message, R = changed R code, M = changed R Module, P = changed Parameters, D = changed Data)
F     [Multiple Regression] [Q1the seat belt law] [2008-11-24 18:09:48] [85134b6edb9973b9193450dd2306c65b]
-    D    [Multiple Regression] [paper multiple re...] [2008-12-18 18:59:33] [4940af498c7c54f3992f17142bd40069] [Current]
Feedback Forum

Post a new message
Dataseries X:
111078	0
150739	0
159129	0
157928	0
147768	0
137507	0
136919	0
136151	0
133001	0
125554	0
119647	0
114158	0
116193	0
152803	0
161761	0
160942	0
149470	0
139208	0
134588	0
130322	0
126611	0
122401	0
117352	0
112135	0
112879	0
148729	0
157230	0
157221	0
146681	0
136524	0
132111	1
125326	1
122716	1
116615	1
113719	1
110737	1
112093	1
143565	1
149946	1
149147	1
134339	1
122683	1
115614	1
116566	1
111272	1
104609	1
101802	1
94542	1
93051	1
124129	1
130374	1
123946	1
114971	1
105531	1
104919	1
104782	1
101281	1
94545	1
93248	1
84031	1
87486	1


Summary of computational transaction
Raw Inputview raw input (R code)
Raw Outputview raw output of R engine
Computing time3 seconds
R Server'Gwilym Jenkins' @ 72.249.127.135

\begin{tabular}{lllllllll}
\hline
Summary of computational transaction \tabularnewline
Raw Input & view raw input (R code)  \tabularnewline
Raw Output & view raw output of R engine  \tabularnewline
Computing time & 3 seconds \tabularnewline
R Server & 'Gwilym Jenkins' @ 72.249.127.135 \tabularnewline
\hline
\end{tabular}
%Source: https://freestatistics.org/blog/index.php?pk=34936&T=0

[TABLE]
[ROW][C]Summary of computational transaction[/C][/ROW]
[ROW][C]Raw Input[/C][C]view raw input (R code) [/C][/ROW]
[ROW][C]Raw Output[/C][C]view raw output of R engine [/C][/ROW]
[ROW][C]Computing time[/C][C]3 seconds[/C][/ROW]
[ROW][C]R Server[/C][C]'Gwilym Jenkins' @ 72.249.127.135[/C][/ROW]
[/TABLE]
Source: https://freestatistics.org/blog/index.php?pk=34936&T=0

Globally Unique Identifier (entire table): ba.freestatistics.org/blog/index.php?pk=34936&T=0

As an alternative you can also use a QR Code:  

The GUIDs for individual cells are displayed in the table below:

Summary of computational transaction
Raw Inputview raw input (R code)
Raw Outputview raw output of R engine
Computing time3 seconds
R Server'Gwilym Jenkins' @ 72.249.127.135


Multiple Linear Regression - Estimated Regression Equation
Yt[t] = + 124865.4 -577.333333333319D[t] -686.999999999996M1[t] + 34812.9333333333M2[t] + 43102.3333333334M3[t] + 41845.5333333334M4[t] + 31248.9333333333M5[t] + 21488.1333333333M6[t] + 18737.6M7[t] + 17131.2M8[t] + 14072.4M9[t] + 8435.4M10[t] + 5438.59999999999M11[t] -594.4t + e[t]

\begin{tabular}{lllllllll}
\hline
Multiple Linear Regression - Estimated Regression Equation \tabularnewline
Yt[t] =  +  124865.4 -577.333333333319D[t] -686.999999999996M1[t] +  34812.9333333333M2[t] +  43102.3333333334M3[t] +  41845.5333333334M4[t] +  31248.9333333333M5[t] +  21488.1333333333M6[t] +  18737.6M7[t] +  17131.2M8[t] +  14072.4M9[t] +  8435.4M10[t] +  5438.59999999999M11[t] -594.4t  + e[t] \tabularnewline
\hline
\end{tabular}
%Source: https://freestatistics.org/blog/index.php?pk=34936&T=1

[TABLE]
[ROW][C]Multiple Linear Regression - Estimated Regression Equation[/C][/ROW]
[ROW][C]Yt[t] =  +  124865.4 -577.333333333319D[t] -686.999999999996M1[t] +  34812.9333333333M2[t] +  43102.3333333334M3[t] +  41845.5333333334M4[t] +  31248.9333333333M5[t] +  21488.1333333333M6[t] +  18737.6M7[t] +  17131.2M8[t] +  14072.4M9[t] +  8435.4M10[t] +  5438.59999999999M11[t] -594.4t  + e[t][/C][/ROW]
[/TABLE]
Source: https://freestatistics.org/blog/index.php?pk=34936&T=1

Globally Unique Identifier (entire table): ba.freestatistics.org/blog/index.php?pk=34936&T=1

As an alternative you can also use a QR Code:  

The GUIDs for individual cells are displayed in the table below:

Multiple Linear Regression - Estimated Regression Equation
Yt[t] = + 124865.4 -577.333333333319D[t] -686.999999999996M1[t] + 34812.9333333333M2[t] + 43102.3333333334M3[t] + 41845.5333333334M4[t] + 31248.9333333333M5[t] + 21488.1333333333M6[t] + 18737.6M7[t] + 17131.2M8[t] + 14072.4M9[t] + 8435.4M10[t] + 5438.59999999999M11[t] -594.4t + e[t]


Multiple Linear Regression - Ordinary Least Squares
VariableParameterS.D.T-STATH0: parameter = 02-tail p-value1-tail p-value
(Intercept)124865.43137.46895339.798100
D-577.3333333333193028.94565-0.19060.8496560.424828
M1-686.9999999999963521.1267-0.19510.8461490.423075
M234812.93333333333697.6237069.414900
M343102.33333333343690.9078511.67800
M441845.53333333343686.17303611.35200
M531248.93333333333683.4269048.483700
M621488.13333333333682.6739035.834900
M718737.63695.1295115.07097e-063e-06
M817131.23686.1730364.64742.7e-051.4e-05
M914072.43679.1918153.82490.0003850.000192
M108435.43674.1971072.29580.0261910.013096
M115438.599999999993671.197021.48140.1451670.072584
t-594.485.70651-6.935300

\begin{tabular}{lllllllll}
\hline
Multiple Linear Regression - Ordinary Least Squares \tabularnewline
Variable & Parameter & S.D. & T-STATH0: parameter = 0 & 2-tail p-value & 1-tail p-value \tabularnewline
(Intercept) & 124865.4 & 3137.468953 & 39.7981 & 0 & 0 \tabularnewline
D & -577.333333333319 & 3028.94565 & -0.1906 & 0.849656 & 0.424828 \tabularnewline
M1 & -686.999999999996 & 3521.1267 & -0.1951 & 0.846149 & 0.423075 \tabularnewline
M2 & 34812.9333333333 & 3697.623706 & 9.4149 & 0 & 0 \tabularnewline
M3 & 43102.3333333334 & 3690.90785 & 11.678 & 0 & 0 \tabularnewline
M4 & 41845.5333333334 & 3686.173036 & 11.352 & 0 & 0 \tabularnewline
M5 & 31248.9333333333 & 3683.426904 & 8.4837 & 0 & 0 \tabularnewline
M6 & 21488.1333333333 & 3682.673903 & 5.8349 & 0 & 0 \tabularnewline
M7 & 18737.6 & 3695.129511 & 5.0709 & 7e-06 & 3e-06 \tabularnewline
M8 & 17131.2 & 3686.173036 & 4.6474 & 2.7e-05 & 1.4e-05 \tabularnewline
M9 & 14072.4 & 3679.191815 & 3.8249 & 0.000385 & 0.000192 \tabularnewline
M10 & 8435.4 & 3674.197107 & 2.2958 & 0.026191 & 0.013096 \tabularnewline
M11 & 5438.59999999999 & 3671.19702 & 1.4814 & 0.145167 & 0.072584 \tabularnewline
t & -594.4 & 85.70651 & -6.9353 & 0 & 0 \tabularnewline
\hline
\end{tabular}
%Source: https://freestatistics.org/blog/index.php?pk=34936&T=2

[TABLE]
[ROW][C]Multiple Linear Regression - Ordinary Least Squares[/C][/ROW]
[ROW][C]Variable[/C][C]Parameter[/C][C]S.D.[/C][C]T-STATH0: parameter = 0[/C][C]2-tail p-value[/C][C]1-tail p-value[/C][/ROW]
[ROW][C](Intercept)[/C][C]124865.4[/C][C]3137.468953[/C][C]39.7981[/C][C]0[/C][C]0[/C][/ROW]
[ROW][C]D[/C][C]-577.333333333319[/C][C]3028.94565[/C][C]-0.1906[/C][C]0.849656[/C][C]0.424828[/C][/ROW]
[ROW][C]M1[/C][C]-686.999999999996[/C][C]3521.1267[/C][C]-0.1951[/C][C]0.846149[/C][C]0.423075[/C][/ROW]
[ROW][C]M2[/C][C]34812.9333333333[/C][C]3697.623706[/C][C]9.4149[/C][C]0[/C][C]0[/C][/ROW]
[ROW][C]M3[/C][C]43102.3333333334[/C][C]3690.90785[/C][C]11.678[/C][C]0[/C][C]0[/C][/ROW]
[ROW][C]M4[/C][C]41845.5333333334[/C][C]3686.173036[/C][C]11.352[/C][C]0[/C][C]0[/C][/ROW]
[ROW][C]M5[/C][C]31248.9333333333[/C][C]3683.426904[/C][C]8.4837[/C][C]0[/C][C]0[/C][/ROW]
[ROW][C]M6[/C][C]21488.1333333333[/C][C]3682.673903[/C][C]5.8349[/C][C]0[/C][C]0[/C][/ROW]
[ROW][C]M7[/C][C]18737.6[/C][C]3695.129511[/C][C]5.0709[/C][C]7e-06[/C][C]3e-06[/C][/ROW]
[ROW][C]M8[/C][C]17131.2[/C][C]3686.173036[/C][C]4.6474[/C][C]2.7e-05[/C][C]1.4e-05[/C][/ROW]
[ROW][C]M9[/C][C]14072.4[/C][C]3679.191815[/C][C]3.8249[/C][C]0.000385[/C][C]0.000192[/C][/ROW]
[ROW][C]M10[/C][C]8435.4[/C][C]3674.197107[/C][C]2.2958[/C][C]0.026191[/C][C]0.013096[/C][/ROW]
[ROW][C]M11[/C][C]5438.59999999999[/C][C]3671.19702[/C][C]1.4814[/C][C]0.145167[/C][C]0.072584[/C][/ROW]
[ROW][C]t[/C][C]-594.4[/C][C]85.70651[/C][C]-6.9353[/C][C]0[/C][C]0[/C][/ROW]
[/TABLE]
Source: https://freestatistics.org/blog/index.php?pk=34936&T=2

Globally Unique Identifier (entire table): ba.freestatistics.org/blog/index.php?pk=34936&T=2

As an alternative you can also use a QR Code:  

The GUIDs for individual cells are displayed in the table below:

Multiple Linear Regression - Ordinary Least Squares
VariableParameterS.D.T-STATH0: parameter = 02-tail p-value1-tail p-value
(Intercept)124865.43137.46895339.798100
D-577.3333333333193028.94565-0.19060.8496560.424828
M1-686.9999999999963521.1267-0.19510.8461490.423075
M234812.93333333333697.6237069.414900
M343102.33333333343690.9078511.67800
M441845.53333333343686.17303611.35200
M531248.93333333333683.4269048.483700
M621488.13333333333682.6739035.834900
M718737.63695.1295115.07097e-063e-06
M817131.23686.1730364.64742.7e-051.4e-05
M914072.43679.1918153.82490.0003850.000192
M108435.43674.1971072.29580.0261910.013096
M115438.599999999993671.197021.48140.1451670.072584
t-594.485.70651-6.935300


Multiple Linear Regression - Regression Statistics
Multiple R0.967436908828479
R-squared0.935934172563603
Adjusted R-squared0.918213837315237
F-TEST (value)52.8169563072993
F-TEST (DF numerator)13
F-TEST (DF denominator)47
p-value0
Multiple Linear Regression - Residual Statistics
Residual Standard Deviation5803.09011593107
Sum Squared Residuals1582765179.99999

\begin{tabular}{lllllllll}
\hline
Multiple Linear Regression - Regression Statistics \tabularnewline
Multiple R & 0.967436908828479 \tabularnewline
R-squared & 0.935934172563603 \tabularnewline
Adjusted R-squared & 0.918213837315237 \tabularnewline
F-TEST (value) & 52.8169563072993 \tabularnewline
F-TEST (DF numerator) & 13 \tabularnewline
F-TEST (DF denominator) & 47 \tabularnewline
p-value & 0 \tabularnewline
Multiple Linear Regression - Residual Statistics \tabularnewline
Residual Standard Deviation & 5803.09011593107 \tabularnewline
Sum Squared Residuals & 1582765179.99999 \tabularnewline
\hline
\end{tabular}
%Source: https://freestatistics.org/blog/index.php?pk=34936&T=3

[TABLE]
[ROW][C]Multiple Linear Regression - Regression Statistics[/C][/ROW]
[ROW][C]Multiple R[/C][C]0.967436908828479[/C][/ROW]
[ROW][C]R-squared[/C][C]0.935934172563603[/C][/ROW]
[ROW][C]Adjusted R-squared[/C][C]0.918213837315237[/C][/ROW]
[ROW][C]F-TEST (value)[/C][C]52.8169563072993[/C][/ROW]
[ROW][C]F-TEST (DF numerator)[/C][C]13[/C][/ROW]
[ROW][C]F-TEST (DF denominator)[/C][C]47[/C][/ROW]
[ROW][C]p-value[/C][C]0[/C][/ROW]
[ROW][C]Multiple Linear Regression - Residual Statistics[/C][/ROW]
[ROW][C]Residual Standard Deviation[/C][C]5803.09011593107[/C][/ROW]
[ROW][C]Sum Squared Residuals[/C][C]1582765179.99999[/C][/ROW]
[/TABLE]
Source: https://freestatistics.org/blog/index.php?pk=34936&T=3

Globally Unique Identifier (entire table): ba.freestatistics.org/blog/index.php?pk=34936&T=3

As an alternative you can also use a QR Code:  

The GUIDs for individual cells are displayed in the table below:

Multiple Linear Regression - Regression Statistics
Multiple R0.967436908828479
R-squared0.935934172563603
Adjusted R-squared0.918213837315237
F-TEST (value)52.8169563072993
F-TEST (DF numerator)13
F-TEST (DF denominator)47
p-value0
Multiple Linear Regression - Residual Statistics
Residual Standard Deviation5803.09011593107
Sum Squared Residuals1582765179.99999


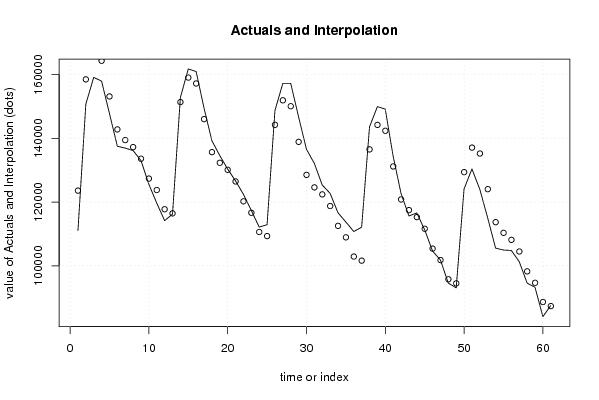
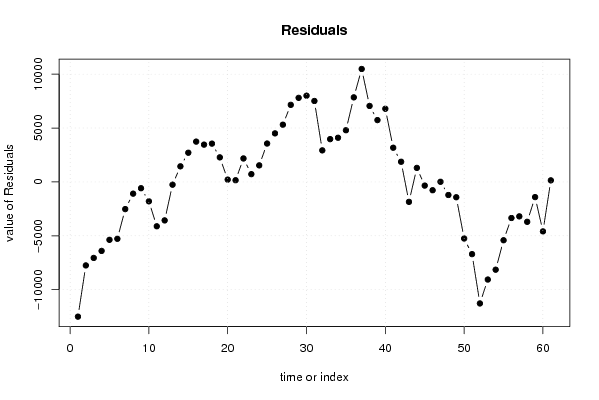
Multiple Linear Regression - Actuals, Interpolation, and Residuals
Time or IndexActualsInterpolationForecastResidualsPrediction Error
1111078123584.000000000-12505.9999999998
2150739158489.533333333-7750.53333333337
3159129166184.533333333-7055.53333333327
4157928164333.333333333-6405.33333333330
5147768153142.333333333-5374.3333333334
6137507142787.133333333-5280.13333333338
7136919139442.2-2523.20000000002
8136151137241.4-1090.39999999999
9133001133588.2-587.200000000042
10125554127356.8-1802.80
11119647123765.6-4118.60000000001
12114158117732.6-3574.60000000002
13116193116451.2-258.20000000005
14152803151356.7333333331446.26666666668
15161761159051.7333333332709.26666666665
16160942157200.5333333333741.46666666664
17149470146009.5333333333460.46666666668
18139208135654.3333333333553.66666666667
19134588132309.42278.6
20130322130108.6213.399999999997
21126611126455.4155.600000000010
221224011202242177.00000000000
23117352116632.8719.200000000004
24112135110599.81535.19999999999
25112879109318.43560.59999999995
26148729144223.9333333334505.06666666667
27157230151918.9333333335311.06666666666
28157221150067.7333333337153.26666666665
29146681138876.7333333337804.26666666669
30136524128521.5333333338002.46666666669
31132111124599.2666666677511.73333333333
32125326122398.4666666672927.53333333333
33122716118745.2666666673970.73333333334
34116615112513.8666666674101.13333333333
35113719108922.6666666674796.33333333333
36110737102889.6666666677847.33333333332
37112093101608.26666666710484.7333333333
38143565136513.87051.20000000001
39149946144208.85737.19999999998
40149147142357.66789.4
41134339131166.63172.40000000001
42122683120811.41871.60000000001
43115614117466.466666667-1852.46666666666
44116566115265.6666666671300.33333333333
45111272111612.466666667-340.466666666654
46104609105381.066666667-772.066666666665
47101802101789.86666666712.1333333333389
489454295756.8666666667-1214.86666666667
499305194475.4666666667-1424.46666666671
50124129129381-5251.99999999998
51130374137076-6702.00000000001
52123946135224.8-11278.8
53114971124033.8-9062.79999999998
54105531113678.6-8147.59999999998
55104919110333.666666667-5414.66666666665
56104782108132.866666667-3350.86666666666
57101281104479.666666667-3198.66666666665
589454598248.2666666667-3703.26666666666
599324894657.0666666667-1409.06666666665
608403188624.0666666667-4593.06666666666
618748687342.6666666667143.333333333301

\begin{tabular}{lllllllll}
\hline
Multiple Linear Regression - Actuals, Interpolation, and Residuals \tabularnewline
Time or Index & Actuals & InterpolationForecast & ResidualsPrediction Error \tabularnewline
1 & 111078 & 123584.000000000 & -12505.9999999998 \tabularnewline
2 & 150739 & 158489.533333333 & -7750.53333333337 \tabularnewline
3 & 159129 & 166184.533333333 & -7055.53333333327 \tabularnewline
4 & 157928 & 164333.333333333 & -6405.33333333330 \tabularnewline
5 & 147768 & 153142.333333333 & -5374.3333333334 \tabularnewline
6 & 137507 & 142787.133333333 & -5280.13333333338 \tabularnewline
7 & 136919 & 139442.2 & -2523.20000000002 \tabularnewline
8 & 136151 & 137241.4 & -1090.39999999999 \tabularnewline
9 & 133001 & 133588.2 & -587.200000000042 \tabularnewline
10 & 125554 & 127356.8 & -1802.80 \tabularnewline
11 & 119647 & 123765.6 & -4118.60000000001 \tabularnewline
12 & 114158 & 117732.6 & -3574.60000000002 \tabularnewline
13 & 116193 & 116451.2 & -258.20000000005 \tabularnewline
14 & 152803 & 151356.733333333 & 1446.26666666668 \tabularnewline
15 & 161761 & 159051.733333333 & 2709.26666666665 \tabularnewline
16 & 160942 & 157200.533333333 & 3741.46666666664 \tabularnewline
17 & 149470 & 146009.533333333 & 3460.46666666668 \tabularnewline
18 & 139208 & 135654.333333333 & 3553.66666666667 \tabularnewline
19 & 134588 & 132309.4 & 2278.6 \tabularnewline
20 & 130322 & 130108.6 & 213.399999999997 \tabularnewline
21 & 126611 & 126455.4 & 155.600000000010 \tabularnewline
22 & 122401 & 120224 & 2177.00000000000 \tabularnewline
23 & 117352 & 116632.8 & 719.200000000004 \tabularnewline
24 & 112135 & 110599.8 & 1535.19999999999 \tabularnewline
25 & 112879 & 109318.4 & 3560.59999999995 \tabularnewline
26 & 148729 & 144223.933333333 & 4505.06666666667 \tabularnewline
27 & 157230 & 151918.933333333 & 5311.06666666666 \tabularnewline
28 & 157221 & 150067.733333333 & 7153.26666666665 \tabularnewline
29 & 146681 & 138876.733333333 & 7804.26666666669 \tabularnewline
30 & 136524 & 128521.533333333 & 8002.46666666669 \tabularnewline
31 & 132111 & 124599.266666667 & 7511.73333333333 \tabularnewline
32 & 125326 & 122398.466666667 & 2927.53333333333 \tabularnewline
33 & 122716 & 118745.266666667 & 3970.73333333334 \tabularnewline
34 & 116615 & 112513.866666667 & 4101.13333333333 \tabularnewline
35 & 113719 & 108922.666666667 & 4796.33333333333 \tabularnewline
36 & 110737 & 102889.666666667 & 7847.33333333332 \tabularnewline
37 & 112093 & 101608.266666667 & 10484.7333333333 \tabularnewline
38 & 143565 & 136513.8 & 7051.20000000001 \tabularnewline
39 & 149946 & 144208.8 & 5737.19999999998 \tabularnewline
40 & 149147 & 142357.6 & 6789.4 \tabularnewline
41 & 134339 & 131166.6 & 3172.40000000001 \tabularnewline
42 & 122683 & 120811.4 & 1871.60000000001 \tabularnewline
43 & 115614 & 117466.466666667 & -1852.46666666666 \tabularnewline
44 & 116566 & 115265.666666667 & 1300.33333333333 \tabularnewline
45 & 111272 & 111612.466666667 & -340.466666666654 \tabularnewline
46 & 104609 & 105381.066666667 & -772.066666666665 \tabularnewline
47 & 101802 & 101789.866666667 & 12.1333333333389 \tabularnewline
48 & 94542 & 95756.8666666667 & -1214.86666666667 \tabularnewline
49 & 93051 & 94475.4666666667 & -1424.46666666671 \tabularnewline
50 & 124129 & 129381 & -5251.99999999998 \tabularnewline
51 & 130374 & 137076 & -6702.00000000001 \tabularnewline
52 & 123946 & 135224.8 & -11278.8 \tabularnewline
53 & 114971 & 124033.8 & -9062.79999999998 \tabularnewline
54 & 105531 & 113678.6 & -8147.59999999998 \tabularnewline
55 & 104919 & 110333.666666667 & -5414.66666666665 \tabularnewline
56 & 104782 & 108132.866666667 & -3350.86666666666 \tabularnewline
57 & 101281 & 104479.666666667 & -3198.66666666665 \tabularnewline
58 & 94545 & 98248.2666666667 & -3703.26666666666 \tabularnewline
59 & 93248 & 94657.0666666667 & -1409.06666666665 \tabularnewline
60 & 84031 & 88624.0666666667 & -4593.06666666666 \tabularnewline
61 & 87486 & 87342.6666666667 & 143.333333333301 \tabularnewline
\hline
\end{tabular}
%Source: https://freestatistics.org/blog/index.php?pk=34936&T=4

[TABLE]
[ROW][C]Multiple Linear Regression - Actuals, Interpolation, and Residuals[/C][/ROW]
[ROW][C]Time or Index[/C][C]Actuals[/C][C]InterpolationForecast[/C][C]ResidualsPrediction Error[/C][/ROW]
[ROW][C]1[/C][C]111078[/C][C]123584.000000000[/C][C]-12505.9999999998[/C][/ROW]
[ROW][C]2[/C][C]150739[/C][C]158489.533333333[/C][C]-7750.53333333337[/C][/ROW]
[ROW][C]3[/C][C]159129[/C][C]166184.533333333[/C][C]-7055.53333333327[/C][/ROW]
[ROW][C]4[/C][C]157928[/C][C]164333.333333333[/C][C]-6405.33333333330[/C][/ROW]
[ROW][C]5[/C][C]147768[/C][C]153142.333333333[/C][C]-5374.3333333334[/C][/ROW]
[ROW][C]6[/C][C]137507[/C][C]142787.133333333[/C][C]-5280.13333333338[/C][/ROW]
[ROW][C]7[/C][C]136919[/C][C]139442.2[/C][C]-2523.20000000002[/C][/ROW]
[ROW][C]8[/C][C]136151[/C][C]137241.4[/C][C]-1090.39999999999[/C][/ROW]
[ROW][C]9[/C][C]133001[/C][C]133588.2[/C][C]-587.200000000042[/C][/ROW]
[ROW][C]10[/C][C]125554[/C][C]127356.8[/C][C]-1802.80[/C][/ROW]
[ROW][C]11[/C][C]119647[/C][C]123765.6[/C][C]-4118.60000000001[/C][/ROW]
[ROW][C]12[/C][C]114158[/C][C]117732.6[/C][C]-3574.60000000002[/C][/ROW]
[ROW][C]13[/C][C]116193[/C][C]116451.2[/C][C]-258.20000000005[/C][/ROW]
[ROW][C]14[/C][C]152803[/C][C]151356.733333333[/C][C]1446.26666666668[/C][/ROW]
[ROW][C]15[/C][C]161761[/C][C]159051.733333333[/C][C]2709.26666666665[/C][/ROW]
[ROW][C]16[/C][C]160942[/C][C]157200.533333333[/C][C]3741.46666666664[/C][/ROW]
[ROW][C]17[/C][C]149470[/C][C]146009.533333333[/C][C]3460.46666666668[/C][/ROW]
[ROW][C]18[/C][C]139208[/C][C]135654.333333333[/C][C]3553.66666666667[/C][/ROW]
[ROW][C]19[/C][C]134588[/C][C]132309.4[/C][C]2278.6[/C][/ROW]
[ROW][C]20[/C][C]130322[/C][C]130108.6[/C][C]213.399999999997[/C][/ROW]
[ROW][C]21[/C][C]126611[/C][C]126455.4[/C][C]155.600000000010[/C][/ROW]
[ROW][C]22[/C][C]122401[/C][C]120224[/C][C]2177.00000000000[/C][/ROW]
[ROW][C]23[/C][C]117352[/C][C]116632.8[/C][C]719.200000000004[/C][/ROW]
[ROW][C]24[/C][C]112135[/C][C]110599.8[/C][C]1535.19999999999[/C][/ROW]
[ROW][C]25[/C][C]112879[/C][C]109318.4[/C][C]3560.59999999995[/C][/ROW]
[ROW][C]26[/C][C]148729[/C][C]144223.933333333[/C][C]4505.06666666667[/C][/ROW]
[ROW][C]27[/C][C]157230[/C][C]151918.933333333[/C][C]5311.06666666666[/C][/ROW]
[ROW][C]28[/C][C]157221[/C][C]150067.733333333[/C][C]7153.26666666665[/C][/ROW]
[ROW][C]29[/C][C]146681[/C][C]138876.733333333[/C][C]7804.26666666669[/C][/ROW]
[ROW][C]30[/C][C]136524[/C][C]128521.533333333[/C][C]8002.46666666669[/C][/ROW]
[ROW][C]31[/C][C]132111[/C][C]124599.266666667[/C][C]7511.73333333333[/C][/ROW]
[ROW][C]32[/C][C]125326[/C][C]122398.466666667[/C][C]2927.53333333333[/C][/ROW]
[ROW][C]33[/C][C]122716[/C][C]118745.266666667[/C][C]3970.73333333334[/C][/ROW]
[ROW][C]34[/C][C]116615[/C][C]112513.866666667[/C][C]4101.13333333333[/C][/ROW]
[ROW][C]35[/C][C]113719[/C][C]108922.666666667[/C][C]4796.33333333333[/C][/ROW]
[ROW][C]36[/C][C]110737[/C][C]102889.666666667[/C][C]7847.33333333332[/C][/ROW]
[ROW][C]37[/C][C]112093[/C][C]101608.266666667[/C][C]10484.7333333333[/C][/ROW]
[ROW][C]38[/C][C]143565[/C][C]136513.8[/C][C]7051.20000000001[/C][/ROW]
[ROW][C]39[/C][C]149946[/C][C]144208.8[/C][C]5737.19999999998[/C][/ROW]
[ROW][C]40[/C][C]149147[/C][C]142357.6[/C][C]6789.4[/C][/ROW]
[ROW][C]41[/C][C]134339[/C][C]131166.6[/C][C]3172.40000000001[/C][/ROW]
[ROW][C]42[/C][C]122683[/C][C]120811.4[/C][C]1871.60000000001[/C][/ROW]
[ROW][C]43[/C][C]115614[/C][C]117466.466666667[/C][C]-1852.46666666666[/C][/ROW]
[ROW][C]44[/C][C]116566[/C][C]115265.666666667[/C][C]1300.33333333333[/C][/ROW]
[ROW][C]45[/C][C]111272[/C][C]111612.466666667[/C][C]-340.466666666654[/C][/ROW]
[ROW][C]46[/C][C]104609[/C][C]105381.066666667[/C][C]-772.066666666665[/C][/ROW]
[ROW][C]47[/C][C]101802[/C][C]101789.866666667[/C][C]12.1333333333389[/C][/ROW]
[ROW][C]48[/C][C]94542[/C][C]95756.8666666667[/C][C]-1214.86666666667[/C][/ROW]
[ROW][C]49[/C][C]93051[/C][C]94475.4666666667[/C][C]-1424.46666666671[/C][/ROW]
[ROW][C]50[/C][C]124129[/C][C]129381[/C][C]-5251.99999999998[/C][/ROW]
[ROW][C]51[/C][C]130374[/C][C]137076[/C][C]-6702.00000000001[/C][/ROW]
[ROW][C]52[/C][C]123946[/C][C]135224.8[/C][C]-11278.8[/C][/ROW]
[ROW][C]53[/C][C]114971[/C][C]124033.8[/C][C]-9062.79999999998[/C][/ROW]
[ROW][C]54[/C][C]105531[/C][C]113678.6[/C][C]-8147.59999999998[/C][/ROW]
[ROW][C]55[/C][C]104919[/C][C]110333.666666667[/C][C]-5414.66666666665[/C][/ROW]
[ROW][C]56[/C][C]104782[/C][C]108132.866666667[/C][C]-3350.86666666666[/C][/ROW]
[ROW][C]57[/C][C]101281[/C][C]104479.666666667[/C][C]-3198.66666666665[/C][/ROW]
[ROW][C]58[/C][C]94545[/C][C]98248.2666666667[/C][C]-3703.26666666666[/C][/ROW]
[ROW][C]59[/C][C]93248[/C][C]94657.0666666667[/C][C]-1409.06666666665[/C][/ROW]
[ROW][C]60[/C][C]84031[/C][C]88624.0666666667[/C][C]-4593.06666666666[/C][/ROW]
[ROW][C]61[/C][C]87486[/C][C]87342.6666666667[/C][C]143.333333333301[/C][/ROW]
[/TABLE]
Source: https://freestatistics.org/blog/index.php?pk=34936&T=4

Globally Unique Identifier (entire table): ba.freestatistics.org/blog/index.php?pk=34936&T=4

As an alternative you can also use a QR Code:  

The GUIDs for individual cells are displayed in the table below:

Multiple Linear Regression - Actuals, Interpolation, and Residuals
Time or IndexActualsInterpolationForecastResidualsPrediction Error
1111078123584.000000000-12505.9999999998
2150739158489.533333333-7750.53333333337
3159129166184.533333333-7055.53333333327
4157928164333.333333333-6405.33333333330
5147768153142.333333333-5374.3333333334
6137507142787.133333333-5280.13333333338
7136919139442.2-2523.20000000002
8136151137241.4-1090.39999999999
9133001133588.2-587.200000000042
10125554127356.8-1802.80
11119647123765.6-4118.60000000001
12114158117732.6-3574.60000000002
13116193116451.2-258.20000000005
14152803151356.7333333331446.26666666668
15161761159051.7333333332709.26666666665
16160942157200.5333333333741.46666666664
17149470146009.5333333333460.46666666668
18139208135654.3333333333553.66666666667
19134588132309.42278.6
20130322130108.6213.399999999997
21126611126455.4155.600000000010
221224011202242177.00000000000
23117352116632.8719.200000000004
24112135110599.81535.19999999999
25112879109318.43560.59999999995
26148729144223.9333333334505.06666666667
27157230151918.9333333335311.06666666666
28157221150067.7333333337153.26666666665
29146681138876.7333333337804.26666666669
30136524128521.5333333338002.46666666669
31132111124599.2666666677511.73333333333
32125326122398.4666666672927.53333333333
33122716118745.2666666673970.73333333334
34116615112513.8666666674101.13333333333
35113719108922.6666666674796.33333333333
36110737102889.6666666677847.33333333332
37112093101608.26666666710484.7333333333
38143565136513.87051.20000000001
39149946144208.85737.19999999998
40149147142357.66789.4
41134339131166.63172.40000000001
42122683120811.41871.60000000001
43115614117466.466666667-1852.46666666666
44116566115265.6666666671300.33333333333
45111272111612.466666667-340.466666666654
46104609105381.066666667-772.066666666665
47101802101789.86666666712.1333333333389
489454295756.8666666667-1214.86666666667
499305194475.4666666667-1424.46666666671
50124129129381-5251.99999999998
51130374137076-6702.00000000001
52123946135224.8-11278.8
53114971124033.8-9062.79999999998
54105531113678.6-8147.59999999998
55104919110333.666666667-5414.66666666665
56104782108132.866666667-3350.86666666666
57101281104479.666666667-3198.66666666665
589454598248.2666666667-3703.26666666666
599324894657.0666666667-1409.06666666665
608403188624.0666666667-4593.06666666666
618748687342.6666666667143.333333333301


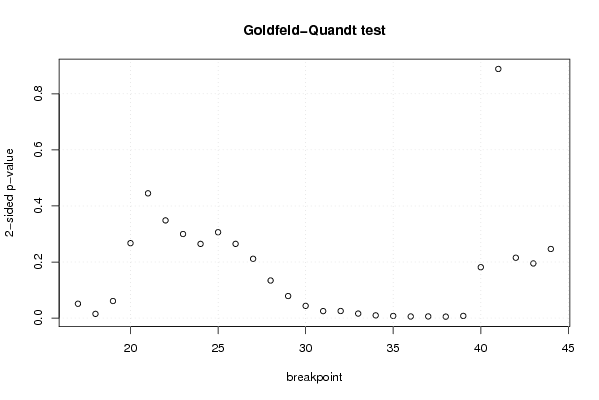
Goldfeld-Quandt test for Heteroskedasticity
p-valuesAlternative Hypothesis
breakpoint indexgreater2-sidedless
170.02559876681819110.05119753363638230.974401233181809
180.007570249066104580.01514049813220920.992429750933895
190.03048115300825220.06096230601650440.969518846991748
200.1336185996487340.2672371992974680.866381400351266
210.2225322224344660.4450644448689320.777467777565534
220.1742489738839420.3484979477678830.825751026116058
230.1499422542577840.2998845085155680.850057745742216
240.1323688088306830.2647376176613660.867631191169317
250.1531413632070550.306282726414110.846858636792945
260.1324001081846110.2648002163692220.86759989181539
270.1057975478243180.2115950956486370.894202452175682
280.0670408627585140.1340817255170280.932959137241486
290.03938094551434280.07876189102868560.960619054485657
300.02184127806747680.04368255613495360.978158721932523
310.01250419947377180.02500839894754350.987495800526228
320.01267235598714080.02534471197428170.98732764401286
330.008056033228340520.01611206645668100.99194396677166
340.004890050368021150.00978010073604230.995109949631979
350.003845950137236350.00769190027447270.996154049862764
360.002904308328116500.005808616656232990.997095691671883
370.003020170710330520.006040341420661040.99697982928967
380.002601774085122060.005203548170244120.997398225914878
390.003927575761713860.007855151523427710.996072424238286
400.09076120877918650.1815224175583730.909238791220814
410.4442818058835530.8885636117671070.555718194116447
420.8923542930714940.2152914138570120.107645706928506
430.902504153206410.1949916935871790.0974958467935894
440.8767403650546250.2465192698907500.123259634945375

\begin{tabular}{lllllllll}
\hline
Goldfeld-Quandt test for Heteroskedasticity \tabularnewline
p-values & Alternative Hypothesis \tabularnewline
breakpoint index & greater & 2-sided & less \tabularnewline
17 & 0.0255987668181911 & 0.0511975336363823 & 0.974401233181809 \tabularnewline
18 & 0.00757024906610458 & 0.0151404981322092 & 0.992429750933895 \tabularnewline
19 & 0.0304811530082522 & 0.0609623060165044 & 0.969518846991748 \tabularnewline
20 & 0.133618599648734 & 0.267237199297468 & 0.866381400351266 \tabularnewline
21 & 0.222532222434466 & 0.445064444868932 & 0.777467777565534 \tabularnewline
22 & 0.174248973883942 & 0.348497947767883 & 0.825751026116058 \tabularnewline
23 & 0.149942254257784 & 0.299884508515568 & 0.850057745742216 \tabularnewline
24 & 0.132368808830683 & 0.264737617661366 & 0.867631191169317 \tabularnewline
25 & 0.153141363207055 & 0.30628272641411 & 0.846858636792945 \tabularnewline
26 & 0.132400108184611 & 0.264800216369222 & 0.86759989181539 \tabularnewline
27 & 0.105797547824318 & 0.211595095648637 & 0.894202452175682 \tabularnewline
28 & 0.067040862758514 & 0.134081725517028 & 0.932959137241486 \tabularnewline
29 & 0.0393809455143428 & 0.0787618910286856 & 0.960619054485657 \tabularnewline
30 & 0.0218412780674768 & 0.0436825561349536 & 0.978158721932523 \tabularnewline
31 & 0.0125041994737718 & 0.0250083989475435 & 0.987495800526228 \tabularnewline
32 & 0.0126723559871408 & 0.0253447119742817 & 0.98732764401286 \tabularnewline
33 & 0.00805603322834052 & 0.0161120664566810 & 0.99194396677166 \tabularnewline
34 & 0.00489005036802115 & 0.0097801007360423 & 0.995109949631979 \tabularnewline
35 & 0.00384595013723635 & 0.0076919002744727 & 0.996154049862764 \tabularnewline
36 & 0.00290430832811650 & 0.00580861665623299 & 0.997095691671883 \tabularnewline
37 & 0.00302017071033052 & 0.00604034142066104 & 0.99697982928967 \tabularnewline
38 & 0.00260177408512206 & 0.00520354817024412 & 0.997398225914878 \tabularnewline
39 & 0.00392757576171386 & 0.00785515152342771 & 0.996072424238286 \tabularnewline
40 & 0.0907612087791865 & 0.181522417558373 & 0.909238791220814 \tabularnewline
41 & 0.444281805883553 & 0.888563611767107 & 0.555718194116447 \tabularnewline
42 & 0.892354293071494 & 0.215291413857012 & 0.107645706928506 \tabularnewline
43 & 0.90250415320641 & 0.194991693587179 & 0.0974958467935894 \tabularnewline
44 & 0.876740365054625 & 0.246519269890750 & 0.123259634945375 \tabularnewline
\hline
\end{tabular}
%Source: https://freestatistics.org/blog/index.php?pk=34936&T=5

[TABLE]
[ROW][C]Goldfeld-Quandt test for Heteroskedasticity[/C][/ROW]
[ROW][C]p-values[/C][C]Alternative Hypothesis[/C][/ROW]
[ROW][C]breakpoint index[/C][C]greater[/C][C]2-sided[/C][C]less[/C][/ROW]
[ROW][C]17[/C][C]0.0255987668181911[/C][C]0.0511975336363823[/C][C]0.974401233181809[/C][/ROW]
[ROW][C]18[/C][C]0.00757024906610458[/C][C]0.0151404981322092[/C][C]0.992429750933895[/C][/ROW]
[ROW][C]19[/C][C]0.0304811530082522[/C][C]0.0609623060165044[/C][C]0.969518846991748[/C][/ROW]
[ROW][C]20[/C][C]0.133618599648734[/C][C]0.267237199297468[/C][C]0.866381400351266[/C][/ROW]
[ROW][C]21[/C][C]0.222532222434466[/C][C]0.445064444868932[/C][C]0.777467777565534[/C][/ROW]
[ROW][C]22[/C][C]0.174248973883942[/C][C]0.348497947767883[/C][C]0.825751026116058[/C][/ROW]
[ROW][C]23[/C][C]0.149942254257784[/C][C]0.299884508515568[/C][C]0.850057745742216[/C][/ROW]
[ROW][C]24[/C][C]0.132368808830683[/C][C]0.264737617661366[/C][C]0.867631191169317[/C][/ROW]
[ROW][C]25[/C][C]0.153141363207055[/C][C]0.30628272641411[/C][C]0.846858636792945[/C][/ROW]
[ROW][C]26[/C][C]0.132400108184611[/C][C]0.264800216369222[/C][C]0.86759989181539[/C][/ROW]
[ROW][C]27[/C][C]0.105797547824318[/C][C]0.211595095648637[/C][C]0.894202452175682[/C][/ROW]
[ROW][C]28[/C][C]0.067040862758514[/C][C]0.134081725517028[/C][C]0.932959137241486[/C][/ROW]
[ROW][C]29[/C][C]0.0393809455143428[/C][C]0.0787618910286856[/C][C]0.960619054485657[/C][/ROW]
[ROW][C]30[/C][C]0.0218412780674768[/C][C]0.0436825561349536[/C][C]0.978158721932523[/C][/ROW]
[ROW][C]31[/C][C]0.0125041994737718[/C][C]0.0250083989475435[/C][C]0.987495800526228[/C][/ROW]
[ROW][C]32[/C][C]0.0126723559871408[/C][C]0.0253447119742817[/C][C]0.98732764401286[/C][/ROW]
[ROW][C]33[/C][C]0.00805603322834052[/C][C]0.0161120664566810[/C][C]0.99194396677166[/C][/ROW]
[ROW][C]34[/C][C]0.00489005036802115[/C][C]0.0097801007360423[/C][C]0.995109949631979[/C][/ROW]
[ROW][C]35[/C][C]0.00384595013723635[/C][C]0.0076919002744727[/C][C]0.996154049862764[/C][/ROW]
[ROW][C]36[/C][C]0.00290430832811650[/C][C]0.00580861665623299[/C][C]0.997095691671883[/C][/ROW]
[ROW][C]37[/C][C]0.00302017071033052[/C][C]0.00604034142066104[/C][C]0.99697982928967[/C][/ROW]
[ROW][C]38[/C][C]0.00260177408512206[/C][C]0.00520354817024412[/C][C]0.997398225914878[/C][/ROW]
[ROW][C]39[/C][C]0.00392757576171386[/C][C]0.00785515152342771[/C][C]0.996072424238286[/C][/ROW]
[ROW][C]40[/C][C]0.0907612087791865[/C][C]0.181522417558373[/C][C]0.909238791220814[/C][/ROW]
[ROW][C]41[/C][C]0.444281805883553[/C][C]0.888563611767107[/C][C]0.555718194116447[/C][/ROW]
[ROW][C]42[/C][C]0.892354293071494[/C][C]0.215291413857012[/C][C]0.107645706928506[/C][/ROW]
[ROW][C]43[/C][C]0.90250415320641[/C][C]0.194991693587179[/C][C]0.0974958467935894[/C][/ROW]
[ROW][C]44[/C][C]0.876740365054625[/C][C]0.246519269890750[/C][C]0.123259634945375[/C][/ROW]
[/TABLE]
Source: https://freestatistics.org/blog/index.php?pk=34936&T=5

Globally Unique Identifier (entire table): ba.freestatistics.org/blog/index.php?pk=34936&T=5

As an alternative you can also use a QR Code:  

The GUIDs for individual cells are displayed in the table below:

Goldfeld-Quandt test for Heteroskedasticity
p-valuesAlternative Hypothesis
breakpoint indexgreater2-sidedless
170.02559876681819110.05119753363638230.974401233181809
180.007570249066104580.01514049813220920.992429750933895
190.03048115300825220.06096230601650440.969518846991748
200.1336185996487340.2672371992974680.866381400351266
210.2225322224344660.4450644448689320.777467777565534
220.1742489738839420.3484979477678830.825751026116058
230.1499422542577840.2998845085155680.850057745742216
240.1323688088306830.2647376176613660.867631191169317
250.1531413632070550.306282726414110.846858636792945
260.1324001081846110.2648002163692220.86759989181539
270.1057975478243180.2115950956486370.894202452175682
280.0670408627585140.1340817255170280.932959137241486
290.03938094551434280.07876189102868560.960619054485657
300.02184127806747680.04368255613495360.978158721932523
310.01250419947377180.02500839894754350.987495800526228
320.01267235598714080.02534471197428170.98732764401286
330.008056033228340520.01611206645668100.99194396677166
340.004890050368021150.00978010073604230.995109949631979
350.003845950137236350.00769190027447270.996154049862764
360.002904308328116500.005808616656232990.997095691671883
370.003020170710330520.006040341420661040.99697982928967
380.002601774085122060.005203548170244120.997398225914878
390.003927575761713860.007855151523427710.996072424238286
400.09076120877918650.1815224175583730.909238791220814
410.4442818058835530.8885636117671070.555718194116447
420.8923542930714940.2152914138570120.107645706928506
430.902504153206410.1949916935871790.0974958467935894
440.8767403650546250.2465192698907500.123259634945375


Meta Analysis of Goldfeld-Quandt test for Heteroskedasticity
Description# significant tests% significant testsOK/NOK
1% type I error level60.214285714285714NOK
5% type I error level110.392857142857143NOK
10% type I error level140.5NOK

\begin{tabular}{lllllllll}
\hline
Meta Analysis of Goldfeld-Quandt test for Heteroskedasticity \tabularnewline
Description & # significant tests & % significant tests & OK/NOK \tabularnewline
1% type I error level & 6 & 0.214285714285714 & NOK \tabularnewline
5% type I error level & 11 & 0.392857142857143 & NOK \tabularnewline
10% type I error level & 14 & 0.5 & NOK \tabularnewline
\hline
\end{tabular}
%Source: https://freestatistics.org/blog/index.php?pk=34936&T=6

[TABLE]
[ROW][C]Meta Analysis of Goldfeld-Quandt test for Heteroskedasticity[/C][/ROW]
[ROW][C]Description[/C][C]# significant tests[/C][C]% significant tests[/C][C]OK/NOK[/C][/ROW]
[ROW][C]1% type I error level[/C][C]6[/C][C]0.214285714285714[/C][C]NOK[/C][/ROW]
[ROW][C]5% type I error level[/C][C]11[/C][C]0.392857142857143[/C][C]NOK[/C][/ROW]
[ROW][C]10% type I error level[/C][C]14[/C][C]0.5[/C][C]NOK[/C][/ROW]
[/TABLE]
Source: https://freestatistics.org/blog/index.php?pk=34936&T=6

Globally Unique Identifier (entire table): ba.freestatistics.org/blog/index.php?pk=34936&T=6

As an alternative you can also use a QR Code:  

The GUIDs for individual cells are displayed in the table below:

Meta Analysis of Goldfeld-Quandt test for Heteroskedasticity
Description# significant tests% significant testsOK/NOK
1% type I error level60.214285714285714NOK
5% type I error level110.392857142857143NOK
10% type I error level140.5NOK


Parameters (Session):
par1 = 1 ; par2 = Include Monthly Dummies ; par3 = Linear Trend ;
Parameters (R input):
par1 = 1 ; par2 = Include Monthly Dummies ; par3 = Linear Trend ;
R code (references can be found in the software module):
library(lattice)
library(lmtest)
n25 <- 25 #minimum number of obs. for Goldfeld-Quandt test
par1 <- as.numeric(par1)
x <- t(y)
k <- length(x[1,])
n <- length(x[,1])
x1 <- cbind(x[,par1], x[,1:k!=par1])
mycolnames <- c(colnames(x)[par1], colnames(x)[1:k!=par1])
colnames(x1) <- mycolnames #colnames(x)[par1]
x <- x1
if (par3 == 'First Differences'){
x2 <- array(0, dim=c(n-1,k), dimnames=list(1:(n-1), paste('(1-B)',colnames(x),sep='')))
for (i in 1:n-1) {
for (j in 1:k) {
x2[i,j] <- x[i+1,j] - x[i,j]
}
}
x <- x2
}
if (par2 == 'Include Monthly Dummies'){
x2 <- array(0, dim=c(n,11), dimnames=list(1:n, paste('M', seq(1:11), sep ='')))
for (i in 1:11){
x2[seq(i,n,12),i] <- 1
}
x <- cbind(x, x2)
}
if (par2 == 'Include Quarterly Dummies'){
x2 <- array(0, dim=c(n,3), dimnames=list(1:n, paste('Q', seq(1:3), sep ='')))
for (i in 1:3){
x2[seq(i,n,4),i] <- 1
}
x <- cbind(x, x2)
}
k <- length(x[1,])
if (par3 == 'Linear Trend'){
x <- cbind(x, c(1:n))
colnames(x)[k+1] <- 't'
}
x
k <- length(x[1,])
df <- as.data.frame(x)
(mylm <- lm(df))
(mysum <- summary(mylm))
if (n > n25) {
kp3 <- k + 3
nmkm3 <- n - k - 3
gqarr <- array(NA, dim=c(nmkm3-kp3+1,3))
numgqtests <- 0
numsignificant1 <- 0
numsignificant5 <- 0
numsignificant10 <- 0
for (mypoint in kp3:nmkm3) {
j <- 0
numgqtests <- numgqtests + 1
for (myalt in c('greater', 'two.sided', 'less')) {
j <- j + 1
gqarr[mypoint-kp3+1,j] <- gqtest(mylm, point=mypoint, alternative=myalt)$p.value
}
if (gqarr[mypoint-kp3+1,2] < 0.01) numsignificant1 <- numsignificant1 + 1
if (gqarr[mypoint-kp3+1,2] < 0.05) numsignificant5 <- numsignificant5 + 1
if (gqarr[mypoint-kp3+1,2] < 0.10) numsignificant10 <- numsignificant10 + 1
}
gqarr
}
bitmap(file='test0.png')
plot(x[,1], type='l', main='Actuals and Interpolation', ylab='value of Actuals and Interpolation (dots)', xlab='time or index')
points(x[,1]-mysum$resid)
grid()
dev.off()
bitmap(file='test1.png')
plot(mysum$resid, type='b', pch=19, main='Residuals', ylab='value of Residuals', xlab='time or index')
grid()
dev.off()
bitmap(file='test2.png')
hist(mysum$resid, main='Residual Histogram', xlab='values of Residuals')
grid()
dev.off()
bitmap(file='test3.png')
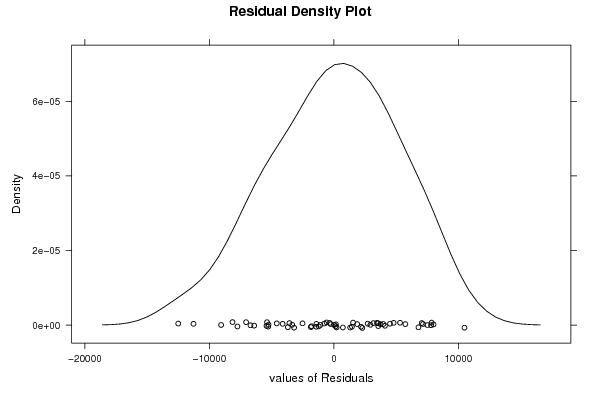
densityplot(~mysum$resid,col='black',main='Residual Density Plot', xlab='values of Residuals')
dev.off()
bitmap(file='test4.png')
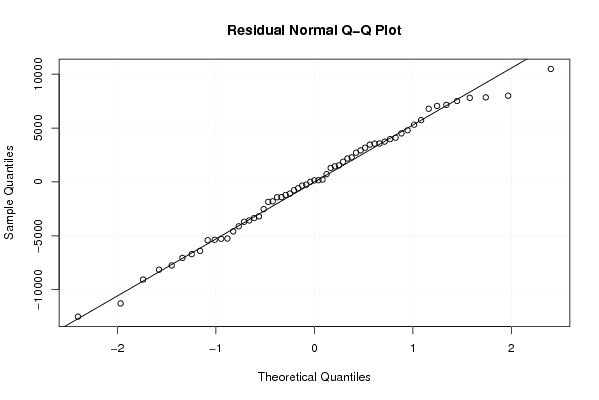
qqnorm(mysum$resid, main='Residual Normal Q-Q Plot')
qqline(mysum$resid)
grid()
dev.off()
(myerror <- as.ts(mysum$resid))
bitmap(file='test5.png')
dum <- cbind(lag(myerror,k=1),myerror)
dum
dum1 <- dum[2:length(myerror),]
dum1
z <- as.data.frame(dum1)
z
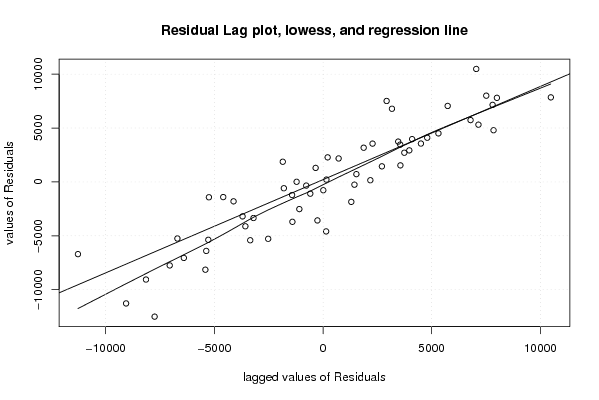
plot(z,main=paste('Residual Lag plot, lowess, and regression line'), ylab='values of Residuals', xlab='lagged values of Residuals')
lines(lowess(z))
abline(lm(z))
grid()
dev.off()
bitmap(file='test6.png')
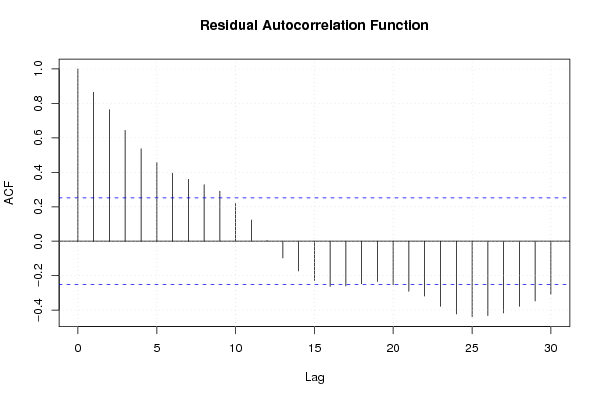
acf(mysum$resid, lag.max=length(mysum$resid)/2, main='Residual Autocorrelation Function')
grid()
dev.off()
bitmap(file='test7.png')
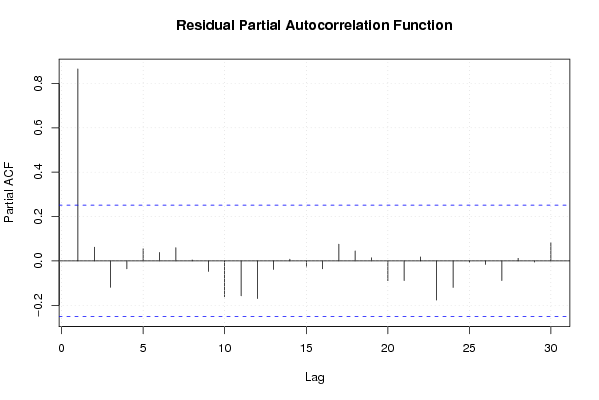
pacf(mysum$resid, lag.max=length(mysum$resid)/2, main='Residual Partial Autocorrelation Function')
grid()
dev.off()
bitmap(file='test8.png')
opar <- par(mfrow = c(2,2), oma = c(0, 0, 1.1, 0))
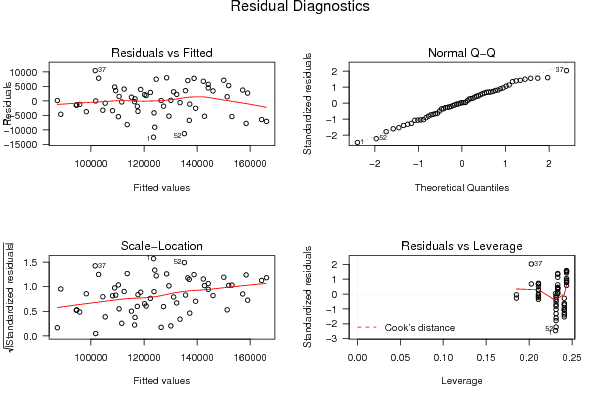
plot(mylm, las = 1, sub='Residual Diagnostics')
par(opar)
dev.off()
if (n > n25) {
bitmap(file='test9.png')
plot(kp3:nmkm3,gqarr[,2], main='Goldfeld-Quandt test',ylab='2-sided p-value',xlab='breakpoint')
grid()
dev.off()
}
load(file='createtable')
a<-table.start()
a<-table.row.start(a)
a<-table.element(a, 'Multiple Linear Regression - Estimated Regression Equation', 1, TRUE)
a<-table.row.end(a)
myeq <- colnames(x)[1]
myeq <- paste(myeq, '[t] = ', sep='')
for (i in 1:k){
if (mysum$coefficients[i,1] > 0) myeq <- paste(myeq, '+', '')
myeq <- paste(myeq, mysum$coefficients[i,1], sep=' ')
if (rownames(mysum$coefficients)[i] != '(Intercept)') {
myeq <- paste(myeq, rownames(mysum$coefficients)[i], sep='')
if (rownames(mysum$coefficients)[i] != 't') myeq <- paste(myeq, '[t]', sep='')
}
}
myeq <- paste(myeq, ' + e[t]')
a<-table.row.start(a)
a<-table.element(a, myeq)
a<-table.row.end(a)
a<-table.end(a)
table.save(a,file='mytable1.tab')
a<-table.start()
a<-table.row.start(a)
a<-table.element(a,hyperlink('ols1.htm','Multiple Linear Regression - Ordinary Least Squares',''), 6, TRUE)
a<-table.row.end(a)
a<-table.row.start(a)
a<-table.element(a,'Variable',header=TRUE)
a<-table.element(a,'Parameter',header=TRUE)
a<-table.element(a,'S.D.',header=TRUE)
a<-table.element(a,'T-STAT
H0: parameter = 0',header=TRUE)
a<-table.element(a,'2-tail p-value',header=TRUE)
a<-table.element(a,'1-tail p-value',header=TRUE)
a<-table.row.end(a)
for (i in 1:k){
a<-table.row.start(a)
a<-table.element(a,rownames(mysum$coefficients)[i],header=TRUE)
a<-table.element(a,mysum$coefficients[i,1])
a<-table.element(a, round(mysum$coefficients[i,2],6))
a<-table.element(a, round(mysum$coefficients[i,3],4))
a<-table.element(a, round(mysum$coefficients[i,4],6))
a<-table.element(a, round(mysum$coefficients[i,4]/2,6))
a<-table.row.end(a)
}
a<-table.end(a)
table.save(a,file='mytable2.tab')
a<-table.start()
a<-table.row.start(a)
a<-table.element(a, 'Multiple Linear Regression - Regression Statistics', 2, TRUE)
a<-table.row.end(a)
a<-table.row.start(a)
a<-table.element(a, 'Multiple R',1,TRUE)
a<-table.element(a, sqrt(mysum$r.squared))
a<-table.row.end(a)
a<-table.row.start(a)
a<-table.element(a, 'R-squared',1,TRUE)
a<-table.element(a, mysum$r.squared)
a<-table.row.end(a)
a<-table.row.start(a)
a<-table.element(a, 'Adjusted R-squared',1,TRUE)
a<-table.element(a, mysum$adj.r.squared)
a<-table.row.end(a)
a<-table.row.start(a)
a<-table.element(a, 'F-TEST (value)',1,TRUE)
a<-table.element(a, mysum$fstatistic[1])
a<-table.row.end(a)
a<-table.row.start(a)
a<-table.element(a, 'F-TEST (DF numerator)',1,TRUE)
a<-table.element(a, mysum$fstatistic[2])
a<-table.row.end(a)
a<-table.row.start(a)
a<-table.element(a, 'F-TEST (DF denominator)',1,TRUE)
a<-table.element(a, mysum$fstatistic[3])
a<-table.row.end(a)
a<-table.row.start(a)
a<-table.element(a, 'p-value',1,TRUE)
a<-table.element(a, 1-pf(mysum$fstatistic[1],mysum$fstatistic[2],mysum$fstatistic[3]))
a<-table.row.end(a)
a<-table.row.start(a)
a<-table.element(a, 'Multiple Linear Regression - Residual Statistics', 2, TRUE)
a<-table.row.end(a)
a<-table.row.start(a)
a<-table.element(a, 'Residual Standard Deviation',1,TRUE)
a<-table.element(a, mysum$sigma)
a<-table.row.end(a)
a<-table.row.start(a)
a<-table.element(a, 'Sum Squared Residuals',1,TRUE)
a<-table.element(a, sum(myerror*myerror))
a<-table.row.end(a)
a<-table.end(a)
table.save(a,file='mytable3.tab')
a<-table.start()
a<-table.row.start(a)
a<-table.element(a, 'Multiple Linear Regression - Actuals, Interpolation, and Residuals', 4, TRUE)
a<-table.row.end(a)
a<-table.row.start(a)
a<-table.element(a, 'Time or Index', 1, TRUE)
a<-table.element(a, 'Actuals', 1, TRUE)
a<-table.element(a, 'Interpolation
Forecast', 1, TRUE)
a<-table.element(a, 'Residuals
Prediction Error', 1, TRUE)
a<-table.row.end(a)
for (i in 1:n) {
a<-table.row.start(a)
a<-table.element(a,i, 1, TRUE)
a<-table.element(a,x[i])
a<-table.element(a,x[i]-mysum$resid[i])
a<-table.element(a,mysum$resid[i])
a<-table.row.end(a)
}
a<-table.end(a)
table.save(a,file='mytable4.tab')
if (n > n25) {
a<-table.start()
a<-table.row.start(a)
a<-table.element(a,'Goldfeld-Quandt test for Heteroskedasticity',4,TRUE)
a<-table.row.end(a)
a<-table.row.start(a)
a<-table.element(a,'p-values',header=TRUE)
a<-table.element(a,'Alternative Hypothesis',3,header=TRUE)
a<-table.row.end(a)
a<-table.row.start(a)
a<-table.element(a,'breakpoint index',header=TRUE)
a<-table.element(a,'greater',header=TRUE)
a<-table.element(a,'2-sided',header=TRUE)
a<-table.element(a,'less',header=TRUE)
a<-table.row.end(a)
for (mypoint in kp3:nmkm3) {
a<-table.row.start(a)
a<-table.element(a,mypoint,header=TRUE)
a<-table.element(a,gqarr[mypoint-kp3+1,1])
a<-table.element(a,gqarr[mypoint-kp3+1,2])
a<-table.element(a,gqarr[mypoint-kp3+1,3])
a<-table.row.end(a)
}
a<-table.end(a)
table.save(a,file='mytable5.tab')
a<-table.start()
a<-table.row.start(a)
a<-table.element(a,'Meta Analysis of Goldfeld-Quandt test for Heteroskedasticity',4,TRUE)
a<-table.row.end(a)
a<-table.row.start(a)
a<-table.element(a,'Description',header=TRUE)
a<-table.element(a,'# significant tests',header=TRUE)
a<-table.element(a,'% significant tests',header=TRUE)
a<-table.element(a,'OK/NOK',header=TRUE)
a<-table.row.end(a)
a<-table.row.start(a)
a<-table.element(a,'1% type I error level',header=TRUE)
a<-table.element(a,numsignificant1)
a<-table.element(a,numsignificant1/numgqtests)
if (numsignificant1/numgqtests < 0.01) dum <- 'OK' else dum <- 'NOK'
a<-table.element(a,dum)
a<-table.row.end(a)
a<-table.row.start(a)
a<-table.element(a,'5% type I error level',header=TRUE)
a<-table.element(a,numsignificant5)
a<-table.element(a,numsignificant5/numgqtests)
if (numsignificant5/numgqtests < 0.05) dum <- 'OK' else dum <- 'NOK'
a<-table.element(a,dum)
a<-table.row.end(a)
a<-table.row.start(a)
a<-table.element(a,'10% type I error level',header=TRUE)
a<-table.element(a,numsignificant10)
a<-table.element(a,numsignificant10/numgqtests)
if (numsignificant10/numgqtests < 0.1) dum <- 'OK' else dum <- 'NOK'
a<-table.element(a,dum)
a<-table.row.end(a)
a<-table.end(a)
table.save(a,file='mytable6.tab')
}