Free Statistics

of Irreproducible Research!

Author's title

Author*Unverified author*
R Software Modulerwasp_notchedbox1.wasp
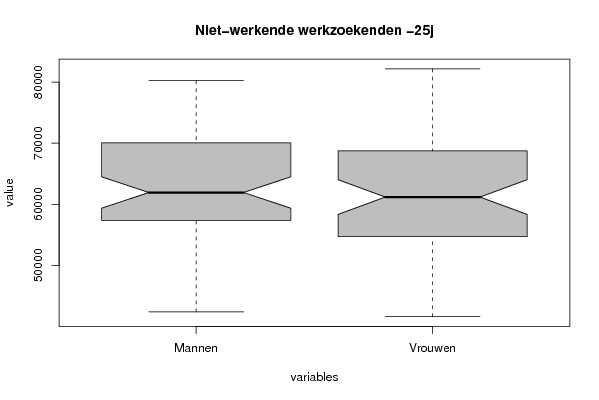
Title produced by softwareNotched Boxplots
Date of computationThu, 18 Dec 2008 10:20:14 -0700
Cite this page as followsStatistical Computations at FreeStatistics.org, Office for Research Development and Education, URL https://freestatistics.org/blog/index.php?v=date/2008/Dec/18/t1229620888wa37i3zg4apwyas.htm/, Retrieved Sat, 11 May 2024 06:07:18 +0000
Statistical Computations at FreeStatistics.org, Office for Research Development and Education, URL https://freestatistics.org/blog/index.php?pk=34895, Retrieved Sat, 11 May 2024 06:07:18 +0000
QR Codes:

Original text written by user:
IsPrivate?No (this computation is public)
User-defined keywords
Estimated Impact134
Family? (F = Feedback message, R = changed R code, M = changed R Module, P = changed Parameters, D = changed Data)
-       [Notched Boxplots] [paper boxplots] [2008-12-18 17:20:14] [4940af498c7c54f3992f17142bd40069] [Current]
Feedback Forum

Post a new message
Dataseries X:
55777	55301
73944	76795
78201	80928
78715	79213
75009	72759
69705	67802
69979	66940
69755	66396
68155	64846
64211	61343
61110	58537
58373	55785
58288	57905
74822	77981
79606	82155
80232	80710
75631	73839
70996	68212
69144	65444
67141	63181
65413	61198
63391	59010
60964	56388
58412	53723
57539	55340
73377	75352
77413	79817
78932	78289
74789	71892
70076	66448
67944	64167
64076	61250
63136	59580
60198	56417
59057	54662
57388	53349
56708	55385
70019	73546
72263	77683
74152	74995
67057	67282
61941	60742
58331	57283
59252	57314
56568	54704
53031	51578
51840	49962
48290	46252
45817	47234
59421	64708
61621	68753
60976	62970
57497	57474
53037	52494
53088	51831
53119	51663
51644	49637
47866	46679
47691	45557
42401	41630
43069	44417


Summary of computational transaction
Raw Inputview raw input (R code)
Raw Outputview raw output of R engine
Computing time1 seconds
R Server'Gwilym Jenkins' @ 72.249.127.135

\begin{tabular}{lllllllll}
\hline
Summary of computational transaction \tabularnewline
Raw Input & view raw input (R code)  \tabularnewline
Raw Output & view raw output of R engine  \tabularnewline
Computing time & 1 seconds \tabularnewline
R Server & 'Gwilym Jenkins' @ 72.249.127.135 \tabularnewline
\hline
\end{tabular}
%Source: https://freestatistics.org/blog/index.php?pk=34895&T=0

[TABLE]
[ROW][C]Summary of computational transaction[/C][/ROW]
[ROW][C]Raw Input[/C][C]view raw input (R code) [/C][/ROW]
[ROW][C]Raw Output[/C][C]view raw output of R engine [/C][/ROW]
[ROW][C]Computing time[/C][C]1 seconds[/C][/ROW]
[ROW][C]R Server[/C][C]'Gwilym Jenkins' @ 72.249.127.135[/C][/ROW]
[/TABLE]
Source: https://freestatistics.org/blog/index.php?pk=34895&T=0

Globally Unique Identifier (entire table): ba.freestatistics.org/blog/index.php?pk=34895&T=0

As an alternative you can also use a QR Code:  

The GUIDs for individual cells are displayed in the table below:

Summary of computational transaction
Raw Inputview raw input (R code)
Raw Outputview raw output of R engine
Computing time1 seconds
R Server'Gwilym Jenkins' @ 72.249.127.135


Boxplot statistics
Variablelower whiskerlower hingemedianupper hingeupper whisker
Mannen4240157388619417007680232
Vrouwen4163054704611986875382155

\begin{tabular}{lllllllll}
\hline
Boxplot statistics \tabularnewline
Variable & lower whisker & lower hinge & median & upper hinge & upper whisker \tabularnewline
Mannen & 42401 & 57388 & 61941 & 70076 & 80232 \tabularnewline
Vrouwen & 41630 & 54704 & 61198 & 68753 & 82155 \tabularnewline
\hline
\end{tabular}
%Source: https://freestatistics.org/blog/index.php?pk=34895&T=1

[TABLE]
[ROW][C]Boxplot statistics[/C][/ROW]
[ROW][C]Variable[/C][C]lower whisker[/C][C]lower hinge[/C][C]median[/C][C]upper hinge[/C][C]upper whisker[/C][/ROW]
[ROW][C]Mannen[/C][C]42401[/C][C]57388[/C][C]61941[/C][C]70076[/C][C]80232[/C][/ROW]
[ROW][C]Vrouwen[/C][C]41630[/C][C]54704[/C][C]61198[/C][C]68753[/C][C]82155[/C][/ROW]
[/TABLE]
Source: https://freestatistics.org/blog/index.php?pk=34895&T=1

Globally Unique Identifier (entire table): ba.freestatistics.org/blog/index.php?pk=34895&T=1

As an alternative you can also use a QR Code:  

The GUIDs for individual cells are displayed in the table below:

Boxplot statistics
Variablelower whiskerlower hingemedianupper hingeupper whisker
Mannen4240157388619417007680232
Vrouwen4163054704611986875382155


Boxplot Notches
Variablelower boundmedianupper bound
Mannen59374.239546516194164507.76045349
Vrouwen58355.91160063996119864040.08839936

\begin{tabular}{lllllllll}
\hline
Boxplot Notches \tabularnewline
Variable & lower bound & median & upper bound \tabularnewline
Mannen & 59374.23954651 & 61941 & 64507.76045349 \tabularnewline
Vrouwen & 58355.9116006399 & 61198 & 64040.08839936 \tabularnewline
\hline
\end{tabular}
%Source: https://freestatistics.org/blog/index.php?pk=34895&T=2

[TABLE]
[ROW][C]Boxplot Notches[/C][/ROW]
[ROW][C]Variable[/C][C]lower bound[/C][C]median[/C][C]upper bound[/C][/ROW]
[ROW][C]Mannen[/C][C]59374.23954651[/C][C]61941[/C][C]64507.76045349[/C][/ROW]
[ROW][C]Vrouwen[/C][C]58355.9116006399[/C][C]61198[/C][C]64040.08839936[/C][/ROW]
[/TABLE]
Source: https://freestatistics.org/blog/index.php?pk=34895&T=2

Globally Unique Identifier (entire table): ba.freestatistics.org/blog/index.php?pk=34895&T=2

As an alternative you can also use a QR Code:  

The GUIDs for individual cells are displayed in the table below:

Boxplot Notches
Variablelower boundmedianupper bound
Mannen59374.239546516194164507.76045349
Vrouwen58355.91160063996119864040.08839936


Parameters (Session):
par1 = grey ;
Parameters (R input):
par1 = grey ;
R code (references can be found in the software module):
z <- as.data.frame(t(y))
bitmap(file='test1.png')
(r<-boxplot(z ,xlab=xlab,ylab=ylab,main=main,notch=TRUE,col=par1))
dev.off()
load(file='createtable')
a<-table.start()
a<-table.row.start(a)
a<-table.element(a,hyperlink('overview.htm','Boxplot statistics','Boxplot overview'),6,TRUE)
a<-table.row.end(a)
a<-table.row.start(a)
a<-table.element(a,'Variable',1,TRUE)
a<-table.element(a,hyperlink('lower_whisker.htm','lower whisker','definition of lower whisker'),1,TRUE)
a<-table.element(a,hyperlink('lower_hinge.htm','lower hinge','definition of lower hinge'),1,TRUE)
a<-table.element(a,hyperlink('central_tendency.htm','median','definitions about measures of central tendency'),1,TRUE)
a<-table.element(a,hyperlink('upper_hinge.htm','upper hinge','definition of upper hinge'),1,TRUE)
a<-table.element(a,hyperlink('upper_whisker.htm','upper whisker','definition of upper whisker'),1,TRUE)
a<-table.row.end(a)
for (i in 1:length(y[,1]))
{
a<-table.row.start(a)
a<-table.element(a,dimnames(t(x))[[2]][i],1,TRUE)
for (j in 1:5)
{
a<-table.element(a,r$stats[j,i])
}
a<-table.row.end(a)
}
a<-table.end(a)
table.save(a,file='mytable.tab')
a<-table.start()
a<-table.row.start(a)
a<-table.element(a,'Boxplot Notches',4,TRUE)
a<-table.row.end(a)
a<-table.row.start(a)
a<-table.element(a,'Variable',1,TRUE)
a<-table.element(a,'lower bound',1,TRUE)
a<-table.element(a,'median',1,TRUE)
a<-table.element(a,'upper bound',1,TRUE)
a<-table.row.end(a)
for (i in 1:length(y[,1]))
{
a<-table.row.start(a)
a<-table.element(a,dimnames(t(x))[[2]][i],1,TRUE)
a<-table.element(a,r$conf[1,i])
a<-table.element(a,r$stats[3,i])
a<-table.element(a,r$conf[2,i])
a<-table.row.end(a)
}
a<-table.end(a)
table.save(a,file='mytable1.tab')