Free Statistics
of Irreproducible Research!
Description of Statistical Computation | |||||||||||||||||||||
|---|---|---|---|---|---|---|---|---|---|---|---|---|---|---|---|---|---|---|---|---|---|
| Author's title | |||||||||||||||||||||
| Author | *The author of this computation has been verified* | ||||||||||||||||||||
| R Software Module | rwasp_meanplot.wasp | ||||||||||||||||||||
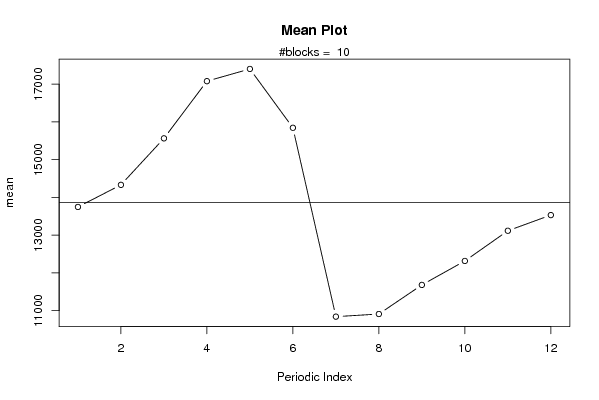
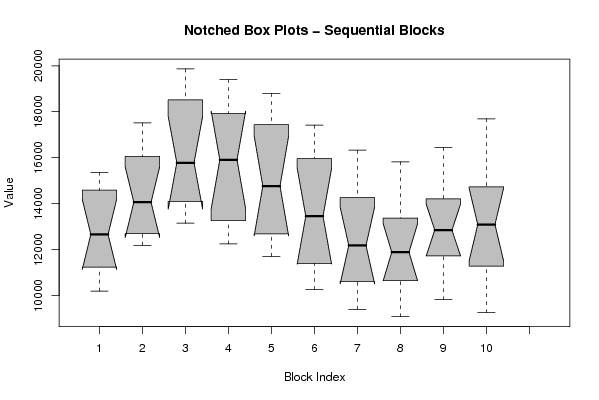
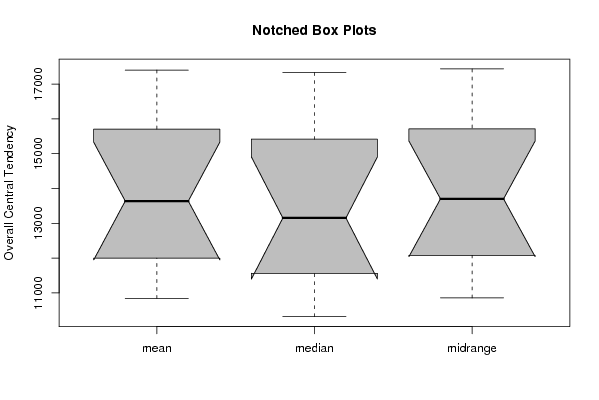
| Title produced by software | Mean Plot | ||||||||||||||||||||
| Date of computation | Thu, 18 Dec 2008 09:03:30 -0700 | ||||||||||||||||||||
| Cite this page as follows | Statistical Computations at FreeStatistics.org, Office for Research Development and Education, URL https://freestatistics.org/blog/index.php?v=date/2008/Dec/18/t1229616294zeua68nugvu9hap.htm/, Retrieved Sat, 11 May 2024 06:16:36 +0000 | ||||||||||||||||||||
| Statistical Computations at FreeStatistics.org, Office for Research Development and Education, URL https://freestatistics.org/blog/index.php?pk=34867, Retrieved Sat, 11 May 2024 06:16:36 +0000 | |||||||||||||||||||||
| QR Codes: | |||||||||||||||||||||
|
| |||||||||||||||||||||
| Original text written by user: | |||||||||||||||||||||
| IsPrivate? | No (this computation is public) | ||||||||||||||||||||
| User-defined keywords | |||||||||||||||||||||
| Estimated Impact | 224 | ||||||||||||||||||||
Tree of Dependent Computations | |||||||||||||||||||||
| Family? (F = Feedback message, R = changed R code, M = changed R Module, P = changed Parameters, D = changed Data) | |||||||||||||||||||||
| - [(Partial) Autocorrelation Function] [(Partial) Autocor...] [2008-12-11 14:56:15] [87cabf13a90315c7085b765dcebb7412] - P [(Partial) Autocorrelation Function] [(Partial) Autocor...] [2008-12-11 15:06:01] [87cabf13a90315c7085b765dcebb7412] - PD [(Partial) Autocorrelation Function] [(Partial) Autocor...] [2008-12-11 15:23:01] [87cabf13a90315c7085b765dcebb7412] - P [(Partial) Autocorrelation Function] [(Partial) Autocor...] [2008-12-12 09:41:51] [87cabf13a90315c7085b765dcebb7412] - PD [(Partial) Autocorrelation Function] [autocorrelation 2...] [2008-12-18 15:13:35] [631938996a408f8d8cf3d9850ca0cd03] - RM D [Central Tendency] [central tendency ...] [2008-12-18 15:43:24] [631938996a408f8d8cf3d9850ca0cd03] - RM [Mean Plot] [mean plot tijdree...] [2008-12-18 16:03:30] [4e8974eee929007194de34cbeefcb780] [Current] - D [Mean Plot] [mean plot tijdree...] [2008-12-18 16:10:04] [631938996a408f8d8cf3d9850ca0cd03] | |||||||||||||||||||||
| Feedback Forum | |||||||||||||||||||||
Post a new message | |||||||||||||||||||||
Dataset | |||||||||||||||||||||
| Dataseries X: | |||||||||||||||||||||
12460 12870 14122 15366 15366 15046 10356 10194 11027 11449 12107 12862 12587 13951 15210 17511 17247 16900 12237 12188 12801 13276 14171 14629 16242 17239 18516 19862 19542 18515 13182 13148 13853 14341 14895 15317 15649 16373 17543 18911 19401 18295 12665 12246 12969 13563 15714 16094 15823 15460 16827 18279 18789 18041 12129 11708 12387 12982 13664 14073 14222 14715 15697 16908 17412 16232 10281 10258 11013 11779 12333 12684 12654 13239 14729 16146 16324 13797 9399 9626 10290 10931 11382 11704 11716 12470 13662 15097 15821 13083 9081 9479 10295 10999 11643 12055 12431 12940 14168 16031 16445 14245 9820 10389 11298 12156 12759 13414 13683 14070 15176 16694 17694 14294 9255 9868 10878 11685 12496 12488 | |||||||||||||||||||||
Tables (Output of Computation) | |||||||||||||||||||||
| |||||||||||||||||||||
Figures (Output of Computation) | |||||||||||||||||||||
Input Parameters & R Code | |||||||||||||||||||||
| Parameters (Session): | |||||||||||||||||||||
| par1 = 60 ; par2 = 1 ; par3 = 1 ; par4 = 0 ; par5 = 12 ; | |||||||||||||||||||||
| Parameters (R input): | |||||||||||||||||||||
| par1 = 12 ; | |||||||||||||||||||||
| R code (references can be found in the software module): | |||||||||||||||||||||
par1 <- as.numeric(par1) | |||||||||||||||||||||