Free Statistics

of Irreproducible Research!

Author's title

Author*The author of this computation has been verified*
R Software Modulerwasp_autocorrelation.wasp
Title produced by software(Partial) Autocorrelation Function
Date of computationThu, 18 Dec 2008 07:46:54 -0700
Cite this page as followsStatistical Computations at FreeStatistics.org, Office for Research Development and Education, URL https://freestatistics.org/blog/index.php?v=date/2008/Dec/18/t1229611676qp83q8ugg836bu5.htm/, Retrieved Sat, 11 May 2024 23:34:18 +0000
Statistical Computations at FreeStatistics.org, Office for Research Development and Education, URL https://freestatistics.org/blog/index.php?pk=34808, Retrieved Sat, 11 May 2024 23:34:18 +0000
QR Codes:

Original text written by user:
IsPrivate?No (this computation is public)
User-defined keywords
Estimated Impact161
Family? (F = Feedback message, R = changed R code, M = changed R Module, P = changed Parameters, D = changed Data)
-     [(Partial) Autocorrelation Function] [(Partial) Autocor...] [2008-12-11 14:56:15] [87cabf13a90315c7085b765dcebb7412]
-   P   [(Partial) Autocorrelation Function] [(Partial) Autocor...] [2008-12-11 15:06:01] [87cabf13a90315c7085b765dcebb7412]
-   PD    [(Partial) Autocorrelation Function] [(Partial) Autocor...] [2008-12-11 15:23:01] [87cabf13a90315c7085b765dcebb7412]
-   P       [(Partial) Autocorrelation Function] [(Partial) Autocor...] [2008-12-12 09:41:51] [87cabf13a90315c7085b765dcebb7412]
-   PD          [(Partial) Autocorrelation Function] [autocorrelation <...] [2008-12-18 14:46:54] [4e8974eee929007194de34cbeefcb780] [Current]
Feedback Forum

Post a new message
Dataseries X:
12460
12870
14122
15366
15366
15046
10356
10194
11027
11449
12107
12862
12587
13951
15210
17511
17247
16900
12237
12188
12801
13276
14171
14629
16242
17239
18516
19862
19542
18515
13182
13148
13853
14341
14895
15317
15649
16373
17543
18911
19401
18295
12665
12246
12969
13563
15714
16094
15823
15460
16827
18279
18789
18041
12129
11708
12387
12982
13664
14073
14222
14715
15697
16908
17412
16232
10281
10258
11013
11779
12333
12684
12654
13239
14729
16146
16324
13797
9399
9626
10290
10931
11382
11704
11716
12470
13662
15097
15821
13083
9081
9479
10295
10999
11643
12055
12431
12940
14168
16031
16445
14245
9820
10389
11298
12156
12759
13414
13683
14070
15176
16694
17694
14294
9255
9868
10878
11685
12496
12488


Summary of computational transaction
Raw Inputview raw input (R code)
Raw Outputview raw output of R engine
Computing time2 seconds
R Server'Sir Ronald Aylmer Fisher' @ 193.190.124.24

\begin{tabular}{lllllllll}
\hline
Summary of computational transaction \tabularnewline
Raw Input & view raw input (R code)  \tabularnewline
Raw Output & view raw output of R engine  \tabularnewline
Computing time & 2 seconds \tabularnewline
R Server & 'Sir Ronald Aylmer Fisher' @ 193.190.124.24 \tabularnewline
\hline
\end{tabular}
%Source: https://freestatistics.org/blog/index.php?pk=34808&T=0

[TABLE]
[ROW][C]Summary of computational transaction[/C][/ROW]
[ROW][C]Raw Input[/C][C]view raw input (R code) [/C][/ROW]
[ROW][C]Raw Output[/C][C]view raw output of R engine [/C][/ROW]
[ROW][C]Computing time[/C][C]2 seconds[/C][/ROW]
[ROW][C]R Server[/C][C]'Sir Ronald Aylmer Fisher' @ 193.190.124.24[/C][/ROW]
[/TABLE]
Source: https://freestatistics.org/blog/index.php?pk=34808&T=0

Globally Unique Identifier (entire table): ba.freestatistics.org/blog/index.php?pk=34808&T=0

As an alternative you can also use a QR Code:  

The GUIDs for individual cells are displayed in the table below:

Summary of computational transaction
Raw Inputview raw input (R code)
Raw Outputview raw output of R engine
Computing time2 seconds
R Server'Sir Ronald Aylmer Fisher' @ 193.190.124.24


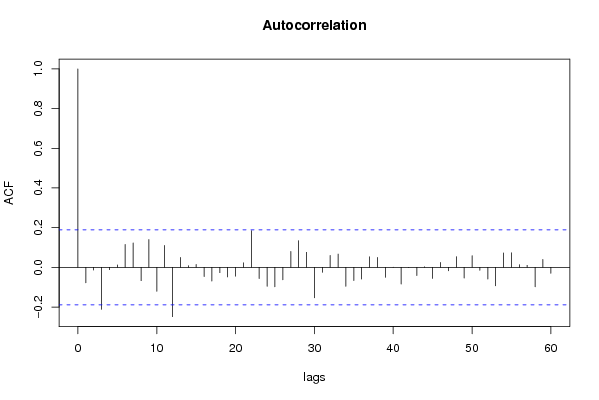
Autocorrelation Function
Time lag kACF(k)T-STATP-value
1-0.0782-0.80890.210182
2-0.013118-0.13570.446158
3-0.21147-2.18750.015443
4-0.011741-0.12140.451782
50.0115670.11970.452491
60.1148181.18770.118792
70.1230621.2730.102894
8-0.067243-0.69560.244103
90.1397961.44610.075541
10-0.120554-1.2470.107556
110.1105791.14380.127622
12-0.248533-2.57080.00576
130.0497290.51440.304017
140.0085290.08820.464933
150.0145090.15010.440493
16-0.046095-0.47680.317233
17-0.069014-0.71390.238425
18-0.026806-0.27730.39105
19-0.048108-0.49760.309881
20-0.044475-0.46010.323206
210.0226330.23410.40767
220.1845321.90880.029483
23-0.055976-0.5790.281896
24-0.0952-0.98480.163483
25-0.098192-1.01570.156029
26-0.062306-0.64450.260315
270.0803960.83160.203736
280.1345841.39210.083382
290.0755880.78190.218004
30-0.153273-1.58550.057906
31-0.024906-0.25760.398595
320.0598710.61930.268515
330.0668510.69150.245371
34-0.095329-0.98610.163156
35-0.066564-0.68850.246301
36-0.059316-0.61360.270399
370.0529030.54720.29268
380.049960.51680.303186
39-0.049732-0.51440.304006
40-0.000257-0.00270.498943
41-0.084318-0.87220.192529
422.6e-053e-040.499892
43-0.040924-0.42330.336456
440.0026340.02720.489158
45-0.055714-0.57630.282809
460.0250260.25890.398118
47-0.017787-0.1840.427186
480.0530720.5490.292081
49-0.054314-0.56180.287705
500.0584230.60430.273451
51-0.014669-0.15170.439839
52-0.059305-0.61350.270439
53-0.093103-0.96310.168843
540.0725590.75060.227283
550.0732040.75720.225288
560.0132210.13680.44574
570.0101630.10510.458236
58-0.098-1.01370.156503
590.0393480.4070.342404
60-0.029857-0.30880.379022

\begin{tabular}{lllllllll}
\hline
Autocorrelation Function \tabularnewline
Time lag k & ACF(k) & T-STAT & P-value \tabularnewline
1 & -0.0782 & -0.8089 & 0.210182 \tabularnewline
2 & -0.013118 & -0.1357 & 0.446158 \tabularnewline
3 & -0.21147 & -2.1875 & 0.015443 \tabularnewline
4 & -0.011741 & -0.1214 & 0.451782 \tabularnewline
5 & 0.011567 & 0.1197 & 0.452491 \tabularnewline
6 & 0.114818 & 1.1877 & 0.118792 \tabularnewline
7 & 0.123062 & 1.273 & 0.102894 \tabularnewline
8 & -0.067243 & -0.6956 & 0.244103 \tabularnewline
9 & 0.139796 & 1.4461 & 0.075541 \tabularnewline
10 & -0.120554 & -1.247 & 0.107556 \tabularnewline
11 & 0.110579 & 1.1438 & 0.127622 \tabularnewline
12 & -0.248533 & -2.5708 & 0.00576 \tabularnewline
13 & 0.049729 & 0.5144 & 0.304017 \tabularnewline
14 & 0.008529 & 0.0882 & 0.464933 \tabularnewline
15 & 0.014509 & 0.1501 & 0.440493 \tabularnewline
16 & -0.046095 & -0.4768 & 0.317233 \tabularnewline
17 & -0.069014 & -0.7139 & 0.238425 \tabularnewline
18 & -0.026806 & -0.2773 & 0.39105 \tabularnewline
19 & -0.048108 & -0.4976 & 0.309881 \tabularnewline
20 & -0.044475 & -0.4601 & 0.323206 \tabularnewline
21 & 0.022633 & 0.2341 & 0.40767 \tabularnewline
22 & 0.184532 & 1.9088 & 0.029483 \tabularnewline
23 & -0.055976 & -0.579 & 0.281896 \tabularnewline
24 & -0.0952 & -0.9848 & 0.163483 \tabularnewline
25 & -0.098192 & -1.0157 & 0.156029 \tabularnewline
26 & -0.062306 & -0.6445 & 0.260315 \tabularnewline
27 & 0.080396 & 0.8316 & 0.203736 \tabularnewline
28 & 0.134584 & 1.3921 & 0.083382 \tabularnewline
29 & 0.075588 & 0.7819 & 0.218004 \tabularnewline
30 & -0.153273 & -1.5855 & 0.057906 \tabularnewline
31 & -0.024906 & -0.2576 & 0.398595 \tabularnewline
32 & 0.059871 & 0.6193 & 0.268515 \tabularnewline
33 & 0.066851 & 0.6915 & 0.245371 \tabularnewline
34 & -0.095329 & -0.9861 & 0.163156 \tabularnewline
35 & -0.066564 & -0.6885 & 0.246301 \tabularnewline
36 & -0.059316 & -0.6136 & 0.270399 \tabularnewline
37 & 0.052903 & 0.5472 & 0.29268 \tabularnewline
38 & 0.04996 & 0.5168 & 0.303186 \tabularnewline
39 & -0.049732 & -0.5144 & 0.304006 \tabularnewline
40 & -0.000257 & -0.0027 & 0.498943 \tabularnewline
41 & -0.084318 & -0.8722 & 0.192529 \tabularnewline
42 & 2.6e-05 & 3e-04 & 0.499892 \tabularnewline
43 & -0.040924 & -0.4233 & 0.336456 \tabularnewline
44 & 0.002634 & 0.0272 & 0.489158 \tabularnewline
45 & -0.055714 & -0.5763 & 0.282809 \tabularnewline
46 & 0.025026 & 0.2589 & 0.398118 \tabularnewline
47 & -0.017787 & -0.184 & 0.427186 \tabularnewline
48 & 0.053072 & 0.549 & 0.292081 \tabularnewline
49 & -0.054314 & -0.5618 & 0.287705 \tabularnewline
50 & 0.058423 & 0.6043 & 0.273451 \tabularnewline
51 & -0.014669 & -0.1517 & 0.439839 \tabularnewline
52 & -0.059305 & -0.6135 & 0.270439 \tabularnewline
53 & -0.093103 & -0.9631 & 0.168843 \tabularnewline
54 & 0.072559 & 0.7506 & 0.227283 \tabularnewline
55 & 0.073204 & 0.7572 & 0.225288 \tabularnewline
56 & 0.013221 & 0.1368 & 0.44574 \tabularnewline
57 & 0.010163 & 0.1051 & 0.458236 \tabularnewline
58 & -0.098 & -1.0137 & 0.156503 \tabularnewline
59 & 0.039348 & 0.407 & 0.342404 \tabularnewline
60 & -0.029857 & -0.3088 & 0.379022 \tabularnewline
\hline
\end{tabular}
%Source: https://freestatistics.org/blog/index.php?pk=34808&T=1

[TABLE]
[ROW][C]Autocorrelation Function[/C][/ROW]
[ROW][C]Time lag k[/C][C]ACF(k)[/C][C]T-STAT[/C][C]P-value[/C][/ROW]
[ROW][C]1[/C][C]-0.0782[/C][C]-0.8089[/C][C]0.210182[/C][/ROW]
[ROW][C]2[/C][C]-0.013118[/C][C]-0.1357[/C][C]0.446158[/C][/ROW]
[ROW][C]3[/C][C]-0.21147[/C][C]-2.1875[/C][C]0.015443[/C][/ROW]
[ROW][C]4[/C][C]-0.011741[/C][C]-0.1214[/C][C]0.451782[/C][/ROW]
[ROW][C]5[/C][C]0.011567[/C][C]0.1197[/C][C]0.452491[/C][/ROW]
[ROW][C]6[/C][C]0.114818[/C][C]1.1877[/C][C]0.118792[/C][/ROW]
[ROW][C]7[/C][C]0.123062[/C][C]1.273[/C][C]0.102894[/C][/ROW]
[ROW][C]8[/C][C]-0.067243[/C][C]-0.6956[/C][C]0.244103[/C][/ROW]
[ROW][C]9[/C][C]0.139796[/C][C]1.4461[/C][C]0.075541[/C][/ROW]
[ROW][C]10[/C][C]-0.120554[/C][C]-1.247[/C][C]0.107556[/C][/ROW]
[ROW][C]11[/C][C]0.110579[/C][C]1.1438[/C][C]0.127622[/C][/ROW]
[ROW][C]12[/C][C]-0.248533[/C][C]-2.5708[/C][C]0.00576[/C][/ROW]
[ROW][C]13[/C][C]0.049729[/C][C]0.5144[/C][C]0.304017[/C][/ROW]
[ROW][C]14[/C][C]0.008529[/C][C]0.0882[/C][C]0.464933[/C][/ROW]
[ROW][C]15[/C][C]0.014509[/C][C]0.1501[/C][C]0.440493[/C][/ROW]
[ROW][C]16[/C][C]-0.046095[/C][C]-0.4768[/C][C]0.317233[/C][/ROW]
[ROW][C]17[/C][C]-0.069014[/C][C]-0.7139[/C][C]0.238425[/C][/ROW]
[ROW][C]18[/C][C]-0.026806[/C][C]-0.2773[/C][C]0.39105[/C][/ROW]
[ROW][C]19[/C][C]-0.048108[/C][C]-0.4976[/C][C]0.309881[/C][/ROW]
[ROW][C]20[/C][C]-0.044475[/C][C]-0.4601[/C][C]0.323206[/C][/ROW]
[ROW][C]21[/C][C]0.022633[/C][C]0.2341[/C][C]0.40767[/C][/ROW]
[ROW][C]22[/C][C]0.184532[/C][C]1.9088[/C][C]0.029483[/C][/ROW]
[ROW][C]23[/C][C]-0.055976[/C][C]-0.579[/C][C]0.281896[/C][/ROW]
[ROW][C]24[/C][C]-0.0952[/C][C]-0.9848[/C][C]0.163483[/C][/ROW]
[ROW][C]25[/C][C]-0.098192[/C][C]-1.0157[/C][C]0.156029[/C][/ROW]
[ROW][C]26[/C][C]-0.062306[/C][C]-0.6445[/C][C]0.260315[/C][/ROW]
[ROW][C]27[/C][C]0.080396[/C][C]0.8316[/C][C]0.203736[/C][/ROW]
[ROW][C]28[/C][C]0.134584[/C][C]1.3921[/C][C]0.083382[/C][/ROW]
[ROW][C]29[/C][C]0.075588[/C][C]0.7819[/C][C]0.218004[/C][/ROW]
[ROW][C]30[/C][C]-0.153273[/C][C]-1.5855[/C][C]0.057906[/C][/ROW]
[ROW][C]31[/C][C]-0.024906[/C][C]-0.2576[/C][C]0.398595[/C][/ROW]
[ROW][C]32[/C][C]0.059871[/C][C]0.6193[/C][C]0.268515[/C][/ROW]
[ROW][C]33[/C][C]0.066851[/C][C]0.6915[/C][C]0.245371[/C][/ROW]
[ROW][C]34[/C][C]-0.095329[/C][C]-0.9861[/C][C]0.163156[/C][/ROW]
[ROW][C]35[/C][C]-0.066564[/C][C]-0.6885[/C][C]0.246301[/C][/ROW]
[ROW][C]36[/C][C]-0.059316[/C][C]-0.6136[/C][C]0.270399[/C][/ROW]
[ROW][C]37[/C][C]0.052903[/C][C]0.5472[/C][C]0.29268[/C][/ROW]
[ROW][C]38[/C][C]0.04996[/C][C]0.5168[/C][C]0.303186[/C][/ROW]
[ROW][C]39[/C][C]-0.049732[/C][C]-0.5144[/C][C]0.304006[/C][/ROW]
[ROW][C]40[/C][C]-0.000257[/C][C]-0.0027[/C][C]0.498943[/C][/ROW]
[ROW][C]41[/C][C]-0.084318[/C][C]-0.8722[/C][C]0.192529[/C][/ROW]
[ROW][C]42[/C][C]2.6e-05[/C][C]3e-04[/C][C]0.499892[/C][/ROW]
[ROW][C]43[/C][C]-0.040924[/C][C]-0.4233[/C][C]0.336456[/C][/ROW]
[ROW][C]44[/C][C]0.002634[/C][C]0.0272[/C][C]0.489158[/C][/ROW]
[ROW][C]45[/C][C]-0.055714[/C][C]-0.5763[/C][C]0.282809[/C][/ROW]
[ROW][C]46[/C][C]0.025026[/C][C]0.2589[/C][C]0.398118[/C][/ROW]
[ROW][C]47[/C][C]-0.017787[/C][C]-0.184[/C][C]0.427186[/C][/ROW]
[ROW][C]48[/C][C]0.053072[/C][C]0.549[/C][C]0.292081[/C][/ROW]
[ROW][C]49[/C][C]-0.054314[/C][C]-0.5618[/C][C]0.287705[/C][/ROW]
[ROW][C]50[/C][C]0.058423[/C][C]0.6043[/C][C]0.273451[/C][/ROW]
[ROW][C]51[/C][C]-0.014669[/C][C]-0.1517[/C][C]0.439839[/C][/ROW]
[ROW][C]52[/C][C]-0.059305[/C][C]-0.6135[/C][C]0.270439[/C][/ROW]
[ROW][C]53[/C][C]-0.093103[/C][C]-0.9631[/C][C]0.168843[/C][/ROW]
[ROW][C]54[/C][C]0.072559[/C][C]0.7506[/C][C]0.227283[/C][/ROW]
[ROW][C]55[/C][C]0.073204[/C][C]0.7572[/C][C]0.225288[/C][/ROW]
[ROW][C]56[/C][C]0.013221[/C][C]0.1368[/C][C]0.44574[/C][/ROW]
[ROW][C]57[/C][C]0.010163[/C][C]0.1051[/C][C]0.458236[/C][/ROW]
[ROW][C]58[/C][C]-0.098[/C][C]-1.0137[/C][C]0.156503[/C][/ROW]
[ROW][C]59[/C][C]0.039348[/C][C]0.407[/C][C]0.342404[/C][/ROW]
[ROW][C]60[/C][C]-0.029857[/C][C]-0.3088[/C][C]0.379022[/C][/ROW]
[/TABLE]
Source: https://freestatistics.org/blog/index.php?pk=34808&T=1

Globally Unique Identifier (entire table): ba.freestatistics.org/blog/index.php?pk=34808&T=1

As an alternative you can also use a QR Code:  

The GUIDs for individual cells are displayed in the table below:

Autocorrelation Function
Time lag kACF(k)T-STATP-value
1-0.0782-0.80890.210182
2-0.013118-0.13570.446158
3-0.21147-2.18750.015443
4-0.011741-0.12140.451782
50.0115670.11970.452491
60.1148181.18770.118792
70.1230621.2730.102894
8-0.067243-0.69560.244103
90.1397961.44610.075541
10-0.120554-1.2470.107556
110.1105791.14380.127622
12-0.248533-2.57080.00576
130.0497290.51440.304017
140.0085290.08820.464933
150.0145090.15010.440493
16-0.046095-0.47680.317233
17-0.069014-0.71390.238425
18-0.026806-0.27730.39105
19-0.048108-0.49760.309881
20-0.044475-0.46010.323206
210.0226330.23410.40767
220.1845321.90880.029483
23-0.055976-0.5790.281896
24-0.0952-0.98480.163483
25-0.098192-1.01570.156029
26-0.062306-0.64450.260315
270.0803960.83160.203736
280.1345841.39210.083382
290.0755880.78190.218004
30-0.153273-1.58550.057906
31-0.024906-0.25760.398595
320.0598710.61930.268515
330.0668510.69150.245371
34-0.095329-0.98610.163156
35-0.066564-0.68850.246301
36-0.059316-0.61360.270399
370.0529030.54720.29268
380.049960.51680.303186
39-0.049732-0.51440.304006
40-0.000257-0.00270.498943
41-0.084318-0.87220.192529
422.6e-053e-040.499892
43-0.040924-0.42330.336456
440.0026340.02720.489158
45-0.055714-0.57630.282809
460.0250260.25890.398118
47-0.017787-0.1840.427186
480.0530720.5490.292081
49-0.054314-0.56180.287705
500.0584230.60430.273451
51-0.014669-0.15170.439839
52-0.059305-0.61350.270439
53-0.093103-0.96310.168843
540.0725590.75060.227283
550.0732040.75720.225288
560.0132210.13680.44574
570.0101630.10510.458236
58-0.098-1.01370.156503
590.0393480.4070.342404
60-0.029857-0.30880.379022


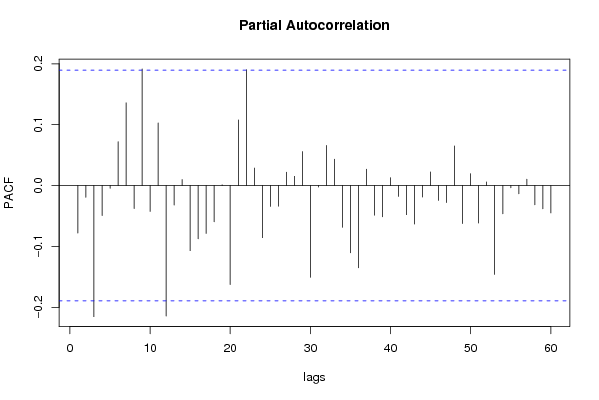
Partial Autocorrelation Function
Time lag kPACF(k)T-STATP-value
1-0.0782-0.80890.210182
2-0.019352-0.20020.420861
3-0.215426-2.22840.013973
4-0.049403-0.5110.305191
5-0.004647-0.04810.480877
60.0719150.74390.229284
70.1357531.40420.081571
8-0.037938-0.39240.34776
90.1914751.98060.025099
10-0.042562-0.44030.330315
110.1026091.06140.145451
12-0.21449-2.21870.014309
13-0.032055-0.33160.370427
140.0096870.10020.460186
15-0.107047-1.10730.135324
16-0.08741-0.90420.183968
17-0.078717-0.81430.208653
18-0.059705-0.61760.269076
190.0011260.01160.495366
20-0.162781-1.68380.047566
210.1075461.11250.134216
220.1901191.96660.025909
230.0286340.29620.383829
24-0.085659-0.88610.188784
25-0.034297-0.35480.36173
26-0.033945-0.35110.36309
270.0217480.2250.41122
280.0150860.1560.438144
290.0556690.57580.282964
30-0.150783-1.55970.060891
31-0.002417-0.0250.490049
320.0657450.68010.248964
330.0432470.44730.327764
34-0.068663-0.71030.239545
35-0.110551-1.14360.127681
36-0.135215-1.39870.082401
370.0266560.27570.391645
38-0.048722-0.5040.307656
39-0.051239-0.530.298597
400.0129510.1340.44684
41-0.017859-0.18470.426894
42-0.047833-0.49480.310883
43-0.063257-0.65430.257148
44-0.018792-0.19440.423121
450.0222060.22970.40938
46-0.024512-0.25360.400162
47-0.027834-0.28790.386983
480.0650310.67270.251297
49-0.062419-0.64570.259939
500.0195060.20180.420238
51-0.061743-0.63870.262199
520.0057260.05920.476439
53-0.146013-1.51040.066948
54-0.046407-0.480.316091
55-0.003751-0.03880.484559
56-0.013551-0.14020.444395
570.0104730.10830.456968
58-0.031645-0.32730.372025
59-0.038377-0.3970.346088
60-0.045047-0.4660.321094

\begin{tabular}{lllllllll}
\hline
Partial Autocorrelation Function \tabularnewline
Time lag k & PACF(k) & T-STAT & P-value \tabularnewline
1 & -0.0782 & -0.8089 & 0.210182 \tabularnewline
2 & -0.019352 & -0.2002 & 0.420861 \tabularnewline
3 & -0.215426 & -2.2284 & 0.013973 \tabularnewline
4 & -0.049403 & -0.511 & 0.305191 \tabularnewline
5 & -0.004647 & -0.0481 & 0.480877 \tabularnewline
6 & 0.071915 & 0.7439 & 0.229284 \tabularnewline
7 & 0.135753 & 1.4042 & 0.081571 \tabularnewline
8 & -0.037938 & -0.3924 & 0.34776 \tabularnewline
9 & 0.191475 & 1.9806 & 0.025099 \tabularnewline
10 & -0.042562 & -0.4403 & 0.330315 \tabularnewline
11 & 0.102609 & 1.0614 & 0.145451 \tabularnewline
12 & -0.21449 & -2.2187 & 0.014309 \tabularnewline
13 & -0.032055 & -0.3316 & 0.370427 \tabularnewline
14 & 0.009687 & 0.1002 & 0.460186 \tabularnewline
15 & -0.107047 & -1.1073 & 0.135324 \tabularnewline
16 & -0.08741 & -0.9042 & 0.183968 \tabularnewline
17 & -0.078717 & -0.8143 & 0.208653 \tabularnewline
18 & -0.059705 & -0.6176 & 0.269076 \tabularnewline
19 & 0.001126 & 0.0116 & 0.495366 \tabularnewline
20 & -0.162781 & -1.6838 & 0.047566 \tabularnewline
21 & 0.107546 & 1.1125 & 0.134216 \tabularnewline
22 & 0.190119 & 1.9666 & 0.025909 \tabularnewline
23 & 0.028634 & 0.2962 & 0.383829 \tabularnewline
24 & -0.085659 & -0.8861 & 0.188784 \tabularnewline
25 & -0.034297 & -0.3548 & 0.36173 \tabularnewline
26 & -0.033945 & -0.3511 & 0.36309 \tabularnewline
27 & 0.021748 & 0.225 & 0.41122 \tabularnewline
28 & 0.015086 & 0.156 & 0.438144 \tabularnewline
29 & 0.055669 & 0.5758 & 0.282964 \tabularnewline
30 & -0.150783 & -1.5597 & 0.060891 \tabularnewline
31 & -0.002417 & -0.025 & 0.490049 \tabularnewline
32 & 0.065745 & 0.6801 & 0.248964 \tabularnewline
33 & 0.043247 & 0.4473 & 0.327764 \tabularnewline
34 & -0.068663 & -0.7103 & 0.239545 \tabularnewline
35 & -0.110551 & -1.1436 & 0.127681 \tabularnewline
36 & -0.135215 & -1.3987 & 0.082401 \tabularnewline
37 & 0.026656 & 0.2757 & 0.391645 \tabularnewline
38 & -0.048722 & -0.504 & 0.307656 \tabularnewline
39 & -0.051239 & -0.53 & 0.298597 \tabularnewline
40 & 0.012951 & 0.134 & 0.44684 \tabularnewline
41 & -0.017859 & -0.1847 & 0.426894 \tabularnewline
42 & -0.047833 & -0.4948 & 0.310883 \tabularnewline
43 & -0.063257 & -0.6543 & 0.257148 \tabularnewline
44 & -0.018792 & -0.1944 & 0.423121 \tabularnewline
45 & 0.022206 & 0.2297 & 0.40938 \tabularnewline
46 & -0.024512 & -0.2536 & 0.400162 \tabularnewline
47 & -0.027834 & -0.2879 & 0.386983 \tabularnewline
48 & 0.065031 & 0.6727 & 0.251297 \tabularnewline
49 & -0.062419 & -0.6457 & 0.259939 \tabularnewline
50 & 0.019506 & 0.2018 & 0.420238 \tabularnewline
51 & -0.061743 & -0.6387 & 0.262199 \tabularnewline
52 & 0.005726 & 0.0592 & 0.476439 \tabularnewline
53 & -0.146013 & -1.5104 & 0.066948 \tabularnewline
54 & -0.046407 & -0.48 & 0.316091 \tabularnewline
55 & -0.003751 & -0.0388 & 0.484559 \tabularnewline
56 & -0.013551 & -0.1402 & 0.444395 \tabularnewline
57 & 0.010473 & 0.1083 & 0.456968 \tabularnewline
58 & -0.031645 & -0.3273 & 0.372025 \tabularnewline
59 & -0.038377 & -0.397 & 0.346088 \tabularnewline
60 & -0.045047 & -0.466 & 0.321094 \tabularnewline
\hline
\end{tabular}
%Source: https://freestatistics.org/blog/index.php?pk=34808&T=2

[TABLE]
[ROW][C]Partial Autocorrelation Function[/C][/ROW]
[ROW][C]Time lag k[/C][C]PACF(k)[/C][C]T-STAT[/C][C]P-value[/C][/ROW]
[ROW][C]1[/C][C]-0.0782[/C][C]-0.8089[/C][C]0.210182[/C][/ROW]
[ROW][C]2[/C][C]-0.019352[/C][C]-0.2002[/C][C]0.420861[/C][/ROW]
[ROW][C]3[/C][C]-0.215426[/C][C]-2.2284[/C][C]0.013973[/C][/ROW]
[ROW][C]4[/C][C]-0.049403[/C][C]-0.511[/C][C]0.305191[/C][/ROW]
[ROW][C]5[/C][C]-0.004647[/C][C]-0.0481[/C][C]0.480877[/C][/ROW]
[ROW][C]6[/C][C]0.071915[/C][C]0.7439[/C][C]0.229284[/C][/ROW]
[ROW][C]7[/C][C]0.135753[/C][C]1.4042[/C][C]0.081571[/C][/ROW]
[ROW][C]8[/C][C]-0.037938[/C][C]-0.3924[/C][C]0.34776[/C][/ROW]
[ROW][C]9[/C][C]0.191475[/C][C]1.9806[/C][C]0.025099[/C][/ROW]
[ROW][C]10[/C][C]-0.042562[/C][C]-0.4403[/C][C]0.330315[/C][/ROW]
[ROW][C]11[/C][C]0.102609[/C][C]1.0614[/C][C]0.145451[/C][/ROW]
[ROW][C]12[/C][C]-0.21449[/C][C]-2.2187[/C][C]0.014309[/C][/ROW]
[ROW][C]13[/C][C]-0.032055[/C][C]-0.3316[/C][C]0.370427[/C][/ROW]
[ROW][C]14[/C][C]0.009687[/C][C]0.1002[/C][C]0.460186[/C][/ROW]
[ROW][C]15[/C][C]-0.107047[/C][C]-1.1073[/C][C]0.135324[/C][/ROW]
[ROW][C]16[/C][C]-0.08741[/C][C]-0.9042[/C][C]0.183968[/C][/ROW]
[ROW][C]17[/C][C]-0.078717[/C][C]-0.8143[/C][C]0.208653[/C][/ROW]
[ROW][C]18[/C][C]-0.059705[/C][C]-0.6176[/C][C]0.269076[/C][/ROW]
[ROW][C]19[/C][C]0.001126[/C][C]0.0116[/C][C]0.495366[/C][/ROW]
[ROW][C]20[/C][C]-0.162781[/C][C]-1.6838[/C][C]0.047566[/C][/ROW]
[ROW][C]21[/C][C]0.107546[/C][C]1.1125[/C][C]0.134216[/C][/ROW]
[ROW][C]22[/C][C]0.190119[/C][C]1.9666[/C][C]0.025909[/C][/ROW]
[ROW][C]23[/C][C]0.028634[/C][C]0.2962[/C][C]0.383829[/C][/ROW]
[ROW][C]24[/C][C]-0.085659[/C][C]-0.8861[/C][C]0.188784[/C][/ROW]
[ROW][C]25[/C][C]-0.034297[/C][C]-0.3548[/C][C]0.36173[/C][/ROW]
[ROW][C]26[/C][C]-0.033945[/C][C]-0.3511[/C][C]0.36309[/C][/ROW]
[ROW][C]27[/C][C]0.021748[/C][C]0.225[/C][C]0.41122[/C][/ROW]
[ROW][C]28[/C][C]0.015086[/C][C]0.156[/C][C]0.438144[/C][/ROW]
[ROW][C]29[/C][C]0.055669[/C][C]0.5758[/C][C]0.282964[/C][/ROW]
[ROW][C]30[/C][C]-0.150783[/C][C]-1.5597[/C][C]0.060891[/C][/ROW]
[ROW][C]31[/C][C]-0.002417[/C][C]-0.025[/C][C]0.490049[/C][/ROW]
[ROW][C]32[/C][C]0.065745[/C][C]0.6801[/C][C]0.248964[/C][/ROW]
[ROW][C]33[/C][C]0.043247[/C][C]0.4473[/C][C]0.327764[/C][/ROW]
[ROW][C]34[/C][C]-0.068663[/C][C]-0.7103[/C][C]0.239545[/C][/ROW]
[ROW][C]35[/C][C]-0.110551[/C][C]-1.1436[/C][C]0.127681[/C][/ROW]
[ROW][C]36[/C][C]-0.135215[/C][C]-1.3987[/C][C]0.082401[/C][/ROW]
[ROW][C]37[/C][C]0.026656[/C][C]0.2757[/C][C]0.391645[/C][/ROW]
[ROW][C]38[/C][C]-0.048722[/C][C]-0.504[/C][C]0.307656[/C][/ROW]
[ROW][C]39[/C][C]-0.051239[/C][C]-0.53[/C][C]0.298597[/C][/ROW]
[ROW][C]40[/C][C]0.012951[/C][C]0.134[/C][C]0.44684[/C][/ROW]
[ROW][C]41[/C][C]-0.017859[/C][C]-0.1847[/C][C]0.426894[/C][/ROW]
[ROW][C]42[/C][C]-0.047833[/C][C]-0.4948[/C][C]0.310883[/C][/ROW]
[ROW][C]43[/C][C]-0.063257[/C][C]-0.6543[/C][C]0.257148[/C][/ROW]
[ROW][C]44[/C][C]-0.018792[/C][C]-0.1944[/C][C]0.423121[/C][/ROW]
[ROW][C]45[/C][C]0.022206[/C][C]0.2297[/C][C]0.40938[/C][/ROW]
[ROW][C]46[/C][C]-0.024512[/C][C]-0.2536[/C][C]0.400162[/C][/ROW]
[ROW][C]47[/C][C]-0.027834[/C][C]-0.2879[/C][C]0.386983[/C][/ROW]
[ROW][C]48[/C][C]0.065031[/C][C]0.6727[/C][C]0.251297[/C][/ROW]
[ROW][C]49[/C][C]-0.062419[/C][C]-0.6457[/C][C]0.259939[/C][/ROW]
[ROW][C]50[/C][C]0.019506[/C][C]0.2018[/C][C]0.420238[/C][/ROW]
[ROW][C]51[/C][C]-0.061743[/C][C]-0.6387[/C][C]0.262199[/C][/ROW]
[ROW][C]52[/C][C]0.005726[/C][C]0.0592[/C][C]0.476439[/C][/ROW]
[ROW][C]53[/C][C]-0.146013[/C][C]-1.5104[/C][C]0.066948[/C][/ROW]
[ROW][C]54[/C][C]-0.046407[/C][C]-0.48[/C][C]0.316091[/C][/ROW]
[ROW][C]55[/C][C]-0.003751[/C][C]-0.0388[/C][C]0.484559[/C][/ROW]
[ROW][C]56[/C][C]-0.013551[/C][C]-0.1402[/C][C]0.444395[/C][/ROW]
[ROW][C]57[/C][C]0.010473[/C][C]0.1083[/C][C]0.456968[/C][/ROW]
[ROW][C]58[/C][C]-0.031645[/C][C]-0.3273[/C][C]0.372025[/C][/ROW]
[ROW][C]59[/C][C]-0.038377[/C][C]-0.397[/C][C]0.346088[/C][/ROW]
[ROW][C]60[/C][C]-0.045047[/C][C]-0.466[/C][C]0.321094[/C][/ROW]
[/TABLE]
Source: https://freestatistics.org/blog/index.php?pk=34808&T=2

Globally Unique Identifier (entire table): ba.freestatistics.org/blog/index.php?pk=34808&T=2

As an alternative you can also use a QR Code:  

The GUIDs for individual cells are displayed in the table below:

Partial Autocorrelation Function
Time lag kPACF(k)T-STATP-value
1-0.0782-0.80890.210182
2-0.019352-0.20020.420861
3-0.215426-2.22840.013973
4-0.049403-0.5110.305191
5-0.004647-0.04810.480877
60.0719150.74390.229284
70.1357531.40420.081571
8-0.037938-0.39240.34776
90.1914751.98060.025099
10-0.042562-0.44030.330315
110.1026091.06140.145451
12-0.21449-2.21870.014309
13-0.032055-0.33160.370427
140.0096870.10020.460186
15-0.107047-1.10730.135324
16-0.08741-0.90420.183968
17-0.078717-0.81430.208653
18-0.059705-0.61760.269076
190.0011260.01160.495366
20-0.162781-1.68380.047566
210.1075461.11250.134216
220.1901191.96660.025909
230.0286340.29620.383829
24-0.085659-0.88610.188784
25-0.034297-0.35480.36173
26-0.033945-0.35110.36309
270.0217480.2250.41122
280.0150860.1560.438144
290.0556690.57580.282964
30-0.150783-1.55970.060891
31-0.002417-0.0250.490049
320.0657450.68010.248964
330.0432470.44730.327764
34-0.068663-0.71030.239545
35-0.110551-1.14360.127681
36-0.135215-1.39870.082401
370.0266560.27570.391645
38-0.048722-0.5040.307656
39-0.051239-0.530.298597
400.0129510.1340.44684
41-0.017859-0.18470.426894
42-0.047833-0.49480.310883
43-0.063257-0.65430.257148
44-0.018792-0.19440.423121
450.0222060.22970.40938
46-0.024512-0.25360.400162
47-0.027834-0.28790.386983
480.0650310.67270.251297
49-0.062419-0.64570.259939
500.0195060.20180.420238
51-0.061743-0.63870.262199
520.0057260.05920.476439
53-0.146013-1.51040.066948
54-0.046407-0.480.316091
55-0.003751-0.03880.484559
56-0.013551-0.14020.444395
570.0104730.10830.456968
58-0.031645-0.32730.372025
59-0.038377-0.3970.346088
60-0.045047-0.4660.321094


Parameters (Session):
par1 = 60 ; par2 = 1 ; par3 = 1 ; par4 = 0 ; par5 = 12 ;
Parameters (R input):
par1 = 60 ; par2 = 1 ; par3 = 1 ; par4 = 1 ; par5 = 12 ;
R code (references can be found in the software module):
if (par1 == 'Default') {
par1 = 10*log10(length(x))
} else {
par1 <- as.numeric(par1)
}
par2 <- as.numeric(par2)
par3 <- as.numeric(par3)
par4 <- as.numeric(par4)
par5 <- as.numeric(par5)
if (par2 == 0) {
x <- log(x)
} else {
x <- (x ^ par2 - 1) / par2
}
if (par3 > 0) x <- diff(x,lag=1,difference=par3)
if (par4 > 0) x <- diff(x,lag=par5,difference=par4)
bitmap(file='pic1.png')
racf <- acf(x,par1,main='Autocorrelation',xlab='lags',ylab='ACF')
dev.off()
bitmap(file='pic2.png')
rpacf <- pacf(x,par1,main='Partial Autocorrelation',xlab='lags',ylab='PACF')
dev.off()
(myacf <- c(racf$acf))
(mypacf <- c(rpacf$acf))
lengthx <- length(x)
sqrtn <- sqrt(lengthx)
load(file='createtable')
a<-table.start()
a<-table.row.start(a)
a<-table.element(a,'Autocorrelation Function',4,TRUE)
a<-table.row.end(a)
a<-table.row.start(a)
a<-table.element(a,'Time lag k',header=TRUE)
a<-table.element(a,hyperlink('basics.htm','ACF(k)','click here for more information about the Autocorrelation Function'),header=TRUE)
a<-table.element(a,'T-STAT',header=TRUE)
a<-table.element(a,'P-value',header=TRUE)
a<-table.row.end(a)
for (i in 2:(par1+1)) {
a<-table.row.start(a)
a<-table.element(a,i-1,header=TRUE)
a<-table.element(a,round(myacf[i],6))
mytstat <- myacf[i]*sqrtn
a<-table.element(a,round(mytstat,4))
a<-table.element(a,round(1-pt(abs(mytstat),lengthx),6))
a<-table.row.end(a)
}
a<-table.end(a)
table.save(a,file='mytable.tab')
a<-table.start()
a<-table.row.start(a)
a<-table.element(a,'Partial Autocorrelation Function',4,TRUE)
a<-table.row.end(a)
a<-table.row.start(a)
a<-table.element(a,'Time lag k',header=TRUE)
a<-table.element(a,hyperlink('basics.htm','PACF(k)','click here for more information about the Partial Autocorrelation Function'),header=TRUE)
a<-table.element(a,'T-STAT',header=TRUE)
a<-table.element(a,'P-value',header=TRUE)
a<-table.row.end(a)
for (i in 1:par1) {
a<-table.row.start(a)
a<-table.element(a,i,header=TRUE)
a<-table.element(a,round(mypacf[i],6))
mytstat <- mypacf[i]*sqrtn
a<-table.element(a,round(mytstat,4))
a<-table.element(a,round(1-pt(abs(mytstat),lengthx),6))
a<-table.row.end(a)
}
a<-table.end(a)
table.save(a,file='mytable1.tab')