Free Statistics

of Irreproducible Research!

Author's title

Author*The author of this computation has been verified*
R Software Modulerwasp_cross.wasp
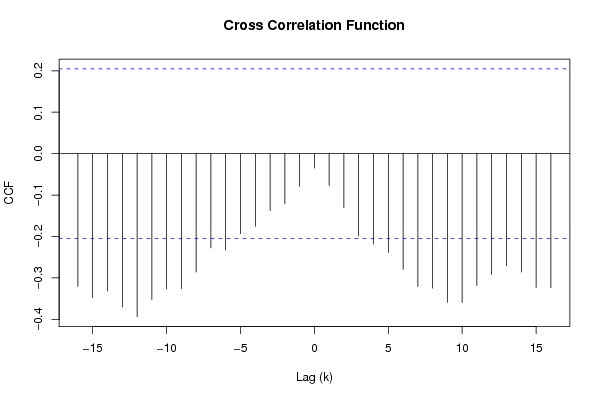
Title produced by softwareCross Correlation Function
Date of computationThu, 18 Dec 2008 07:43:24 -0700
Cite this page as followsStatistical Computations at FreeStatistics.org, Office for Research Development and Education, URL https://freestatistics.org/blog/index.php?v=date/2008/Dec/18/t12296114492yg85023pkmt7rw.htm/, Retrieved Sun, 12 May 2024 12:07:49 +0000
Statistical Computations at FreeStatistics.org, Office for Research Development and Education, URL https://freestatistics.org/blog/index.php?pk=34806, Retrieved Sun, 12 May 2024 12:07:49 +0000
QR Codes:

Original text written by user:
IsPrivate?No (this computation is public)
User-defined keywordsk_vanderheggen
Estimated Impact161
Family? (F = Feedback message, R = changed R code, M = changed R Module, P = changed Parameters, D = changed Data)
F     [Cross Correlation Function] [Non Stationary Ti...] [2008-12-02 15:31:19] [42e82fcd8ee0f4c6e81d502bb09e62b7]
-         [Cross Correlation Function] [Paper Cross corre...] [2008-12-18 14:43:24] [547f3960ab1cda94661cd6e0871d2c7b] [Current]
Feedback Forum

Post a new message
Dataseries X:
25
27
25
23
24
24
26
25
24
24
22
22
22
27
24
24
22
23
25
23
21
21
22
20
22
22
20
21
20
21
21
21
19
21
21
22
19
24
22
22
22
24
22
23
24
21
20
22
23
23
22
20
21
21
20
20
17
18
19
19
20
21
20
21
19
22
20
18
16
17
18
19
18
20
21
18
19
19
19
21
19
19
17
16
16
17
16
15
16
16
16
18
Dataseries Y:
27
25
20
19
19
17
12
13
13
11
4
8
1
5
4
3
4
2
8
-2
1
0
1
7
1
0
-3
0
3
1
3
2
6
2
3
9
12
8
7
9
11
13
9
9
13
14
16
20
19
18
18
19
16
10
11
17
3
14
15
17
20
19
21
17
15
18
19
16
21
26
23
24
23
19
25
21
19
20
20
17
25
19
13
15
15
13
11
9
2
-2
-4
-2


Summary of computational transaction
Raw Inputview raw input (R code)
Raw Outputview raw output of R engine
Computing time2 seconds
R Server'Sir Ronald Aylmer Fisher' @ 193.190.124.24

\begin{tabular}{lllllllll}
\hline
Summary of computational transaction \tabularnewline
Raw Input & view raw input (R code)  \tabularnewline
Raw Output & view raw output of R engine  \tabularnewline
Computing time & 2 seconds \tabularnewline
R Server & 'Sir Ronald Aylmer Fisher' @ 193.190.124.24 \tabularnewline
\hline
\end{tabular}
%Source: https://freestatistics.org/blog/index.php?pk=34806&T=0

[TABLE]
[ROW][C]Summary of computational transaction[/C][/ROW]
[ROW][C]Raw Input[/C][C]view raw input (R code) [/C][/ROW]
[ROW][C]Raw Output[/C][C]view raw output of R engine [/C][/ROW]
[ROW][C]Computing time[/C][C]2 seconds[/C][/ROW]
[ROW][C]R Server[/C][C]'Sir Ronald Aylmer Fisher' @ 193.190.124.24[/C][/ROW]
[/TABLE]
Source: https://freestatistics.org/blog/index.php?pk=34806&T=0

Globally Unique Identifier (entire table): ba.freestatistics.org/blog/index.php?pk=34806&T=0

As an alternative you can also use a QR Code:  

The GUIDs for individual cells are displayed in the table below:

Summary of computational transaction
Raw Inputview raw input (R code)
Raw Outputview raw output of R engine
Computing time2 seconds
R Server'Sir Ronald Aylmer Fisher' @ 193.190.124.24


Cross Correlation Function
ParameterValue
Box-Cox transformation parameter (lambda) of X series1
Degree of non-seasonal differencing (d) of X series0
Degree of seasonal differencing (D) of X series0
Seasonal Period (s)12
Box-Cox transformation parameter (lambda) of Y series1
Degree of non-seasonal differencing (d) of Y series0
Degree of seasonal differencing (D) of Y series0
krho(Y[t],X[t+k])
-16-0.320502558233017
-15-0.347389374535441
-14-0.331395620678965
-13-0.370127777494611
-12-0.393503647993947
-11-0.352397334748406
-10-0.326844183284768
-9-0.325862183679814
-8-0.286019154671832
-7-0.227560456639377
-6-0.232501127291034
-5-0.193204974576368
-4-0.175422935240749
-3-0.137406473052442
-2-0.121412719195967
-1-0.078682183359277
0-0.0350000827722175
1-0.0771235859233267
2-0.130808053915134
3-0.198590992748625
4-0.218314442925515
5-0.238951176512243
6-0.279439519546337
7-0.320879427330802
8-0.324705183660999
9-0.35860913612357
10-0.359580198202658
11-0.318255847756694
12-0.291708094756126
13-0.270782230050845
14-0.285966606993213
15-0.322960410513020
16-0.323614284341984

\begin{tabular}{lllllllll}
\hline
Cross Correlation Function \tabularnewline
Parameter & Value \tabularnewline
Box-Cox transformation parameter (lambda) of X series & 1 \tabularnewline
Degree of non-seasonal differencing (d) of X series & 0 \tabularnewline
Degree of seasonal differencing (D) of X series & 0 \tabularnewline
Seasonal Period (s) & 12 \tabularnewline
Box-Cox transformation parameter (lambda) of Y series & 1 \tabularnewline
Degree of non-seasonal differencing (d) of Y series & 0 \tabularnewline
Degree of seasonal differencing (D) of Y series & 0 \tabularnewline
k & rho(Y[t],X[t+k]) \tabularnewline
-16 & -0.320502558233017 \tabularnewline
-15 & -0.347389374535441 \tabularnewline
-14 & -0.331395620678965 \tabularnewline
-13 & -0.370127777494611 \tabularnewline
-12 & -0.393503647993947 \tabularnewline
-11 & -0.352397334748406 \tabularnewline
-10 & -0.326844183284768 \tabularnewline
-9 & -0.325862183679814 \tabularnewline
-8 & -0.286019154671832 \tabularnewline
-7 & -0.227560456639377 \tabularnewline
-6 & -0.232501127291034 \tabularnewline
-5 & -0.193204974576368 \tabularnewline
-4 & -0.175422935240749 \tabularnewline
-3 & -0.137406473052442 \tabularnewline
-2 & -0.121412719195967 \tabularnewline
-1 & -0.078682183359277 \tabularnewline
0 & -0.0350000827722175 \tabularnewline
1 & -0.0771235859233267 \tabularnewline
2 & -0.130808053915134 \tabularnewline
3 & -0.198590992748625 \tabularnewline
4 & -0.218314442925515 \tabularnewline
5 & -0.238951176512243 \tabularnewline
6 & -0.279439519546337 \tabularnewline
7 & -0.320879427330802 \tabularnewline
8 & -0.324705183660999 \tabularnewline
9 & -0.35860913612357 \tabularnewline
10 & -0.359580198202658 \tabularnewline
11 & -0.318255847756694 \tabularnewline
12 & -0.291708094756126 \tabularnewline
13 & -0.270782230050845 \tabularnewline
14 & -0.285966606993213 \tabularnewline
15 & -0.322960410513020 \tabularnewline
16 & -0.323614284341984 \tabularnewline
\hline
\end{tabular}
%Source: https://freestatistics.org/blog/index.php?pk=34806&T=1

[TABLE]
[ROW][C]Cross Correlation Function[/C][/ROW]
[ROW][C]Parameter[/C][C]Value[/C][/ROW]
[ROW][C]Box-Cox transformation parameter (lambda) of X series[/C][C]1[/C][/ROW]
[ROW][C]Degree of non-seasonal differencing (d) of X series[/C][C]0[/C][/ROW]
[ROW][C]Degree of seasonal differencing (D) of X series[/C][C]0[/C][/ROW]
[ROW][C]Seasonal Period (s)[/C][C]12[/C][/ROW]
[ROW][C]Box-Cox transformation parameter (lambda) of Y series[/C][C]1[/C][/ROW]
[ROW][C]Degree of non-seasonal differencing (d) of Y series[/C][C]0[/C][/ROW]
[ROW][C]Degree of seasonal differencing (D) of Y series[/C][C]0[/C][/ROW]
[ROW][C]k[/C][C]rho(Y[t],X[t+k])[/C][/ROW]
[ROW][C]-16[/C][C]-0.320502558233017[/C][/ROW]
[ROW][C]-15[/C][C]-0.347389374535441[/C][/ROW]
[ROW][C]-14[/C][C]-0.331395620678965[/C][/ROW]
[ROW][C]-13[/C][C]-0.370127777494611[/C][/ROW]
[ROW][C]-12[/C][C]-0.393503647993947[/C][/ROW]
[ROW][C]-11[/C][C]-0.352397334748406[/C][/ROW]
[ROW][C]-10[/C][C]-0.326844183284768[/C][/ROW]
[ROW][C]-9[/C][C]-0.325862183679814[/C][/ROW]
[ROW][C]-8[/C][C]-0.286019154671832[/C][/ROW]
[ROW][C]-7[/C][C]-0.227560456639377[/C][/ROW]
[ROW][C]-6[/C][C]-0.232501127291034[/C][/ROW]
[ROW][C]-5[/C][C]-0.193204974576368[/C][/ROW]
[ROW][C]-4[/C][C]-0.175422935240749[/C][/ROW]
[ROW][C]-3[/C][C]-0.137406473052442[/C][/ROW]
[ROW][C]-2[/C][C]-0.121412719195967[/C][/ROW]
[ROW][C]-1[/C][C]-0.078682183359277[/C][/ROW]
[ROW][C]0[/C][C]-0.0350000827722175[/C][/ROW]
[ROW][C]1[/C][C]-0.0771235859233267[/C][/ROW]
[ROW][C]2[/C][C]-0.130808053915134[/C][/ROW]
[ROW][C]3[/C][C]-0.198590992748625[/C][/ROW]
[ROW][C]4[/C][C]-0.218314442925515[/C][/ROW]
[ROW][C]5[/C][C]-0.238951176512243[/C][/ROW]
[ROW][C]6[/C][C]-0.279439519546337[/C][/ROW]
[ROW][C]7[/C][C]-0.320879427330802[/C][/ROW]
[ROW][C]8[/C][C]-0.324705183660999[/C][/ROW]
[ROW][C]9[/C][C]-0.35860913612357[/C][/ROW]
[ROW][C]10[/C][C]-0.359580198202658[/C][/ROW]
[ROW][C]11[/C][C]-0.318255847756694[/C][/ROW]
[ROW][C]12[/C][C]-0.291708094756126[/C][/ROW]
[ROW][C]13[/C][C]-0.270782230050845[/C][/ROW]
[ROW][C]14[/C][C]-0.285966606993213[/C][/ROW]
[ROW][C]15[/C][C]-0.322960410513020[/C][/ROW]
[ROW][C]16[/C][C]-0.323614284341984[/C][/ROW]
[/TABLE]
Source: https://freestatistics.org/blog/index.php?pk=34806&T=1

Globally Unique Identifier (entire table): ba.freestatistics.org/blog/index.php?pk=34806&T=1

As an alternative you can also use a QR Code:  

The GUIDs for individual cells are displayed in the table below:

Cross Correlation Function
ParameterValue
Box-Cox transformation parameter (lambda) of X series1
Degree of non-seasonal differencing (d) of X series0
Degree of seasonal differencing (D) of X series0
Seasonal Period (s)12
Box-Cox transformation parameter (lambda) of Y series1
Degree of non-seasonal differencing (d) of Y series0
Degree of seasonal differencing (D) of Y series0
krho(Y[t],X[t+k])
-16-0.320502558233017
-15-0.347389374535441
-14-0.331395620678965
-13-0.370127777494611
-12-0.393503647993947
-11-0.352397334748406
-10-0.326844183284768
-9-0.325862183679814
-8-0.286019154671832
-7-0.227560456639377
-6-0.232501127291034
-5-0.193204974576368
-4-0.175422935240749
-3-0.137406473052442
-2-0.121412719195967
-1-0.078682183359277
0-0.0350000827722175
1-0.0771235859233267
2-0.130808053915134
3-0.198590992748625
4-0.218314442925515
5-0.238951176512243
6-0.279439519546337
7-0.320879427330802
8-0.324705183660999
9-0.35860913612357
10-0.359580198202658
11-0.318255847756694
12-0.291708094756126
13-0.270782230050845
14-0.285966606993213
15-0.322960410513020
16-0.323614284341984


Parameters (Session):
par1 = 1 ; par2 = 0 ; par3 = 0 ; par4 = 12 ; par5 = 1 ; par6 = 0 ; par7 = 0 ;
Parameters (R input):
par1 = 1 ; par2 = 0 ; par3 = 0 ; par4 = 12 ; par5 = 1 ; par6 = 0 ; par7 = 0 ; par8 = ; par9 = ; par10 = ; par11 = ; par12 = ; par13 = ; par14 = ; par15 = ; par16 = ; par17 = ; par18 = ; par19 = ; par20 = ;
R code (references can be found in the software module):
par1 <- as.numeric(par1)
par2 <- as.numeric(par2)
par3 <- as.numeric(par3)
par4 <- as.numeric(par4)
par5 <- as.numeric(par5)
par6 <- as.numeric(par6)
par7 <- as.numeric(par7)
if (par1 == 0) {
x <- log(x)
} else {
x <- (x ^ par1 - 1) / par1
}
if (par5 == 0) {
y <- log(y)
} else {
y <- (y ^ par5 - 1) / par5
}
if (par2 > 0) x <- diff(x,lag=1,difference=par2)
if (par6 > 0) y <- diff(y,lag=1,difference=par6)
if (par3 > 0) x <- diff(x,lag=par4,difference=par3)
if (par7 > 0) y <- diff(y,lag=par4,difference=par7)
x
y
bitmap(file='test1.png')
(r <- ccf(x,y,main='Cross Correlation Function',ylab='CCF',xlab='Lag (k)'))
dev.off()
load(file='createtable')
a<-table.start()
a<-table.row.start(a)
a<-table.element(a,'Cross Correlation Function',2,TRUE)
a<-table.row.end(a)
a<-table.row.start(a)
a<-table.element(a,'Parameter',header=TRUE)
a<-table.element(a,'Value',header=TRUE)
a<-table.row.end(a)
a<-table.row.start(a)
a<-table.element(a,'Box-Cox transformation parameter (lambda) of X series',header=TRUE)
a<-table.element(a,par1)
a<-table.row.end(a)
a<-table.row.start(a)
a<-table.element(a,'Degree of non-seasonal differencing (d) of X series',header=TRUE)
a<-table.element(a,par2)
a<-table.row.end(a)
a<-table.row.start(a)
a<-table.element(a,'Degree of seasonal differencing (D) of X series',header=TRUE)
a<-table.element(a,par3)
a<-table.row.end(a)
a<-table.row.start(a)
a<-table.element(a,'Seasonal Period (s)',header=TRUE)
a<-table.element(a,par4)
a<-table.row.end(a)
a<-table.row.start(a)
a<-table.element(a,'Box-Cox transformation parameter (lambda) of Y series',header=TRUE)
a<-table.element(a,par5)
a<-table.row.end(a)
a<-table.row.start(a)
a<-table.element(a,'Degree of non-seasonal differencing (d) of Y series',header=TRUE)
a<-table.element(a,par6)
a<-table.row.end(a)
a<-table.row.start(a)
a<-table.element(a,'Degree of seasonal differencing (D) of Y series',header=TRUE)
a<-table.element(a,par7)
a<-table.row.end(a)
a<-table.row.start(a)
a<-table.element(a,'k',header=TRUE)
a<-table.element(a,'rho(Y[t],X[t+k])',header=TRUE)
a<-table.row.end(a)
mylength <- length(r$acf)
myhalf <- floor((mylength-1)/2)
for (i in 1:mylength) {
a<-table.row.start(a)
a<-table.element(a,i-myhalf-1,header=TRUE)
a<-table.element(a,r$acf[i])
a<-table.row.end(a)
}
a<-table.end(a)
table.save(a,file='mytable.tab')