Free Statistics

of Irreproducible Research!

Author's title

Author*The author of this computation has been verified*
R Software Modulerwasp_autocorrelation.wasp
Title produced by software(Partial) Autocorrelation Function
Date of computationThu, 18 Dec 2008 07:42:48 -0700
Cite this page as followsStatistical Computations at FreeStatistics.org, Office for Research Development and Education, URL https://freestatistics.org/blog/index.php?v=date/2008/Dec/18/t1229611414zyoay8rmcd9urdv.htm/, Retrieved Sat, 11 May 2024 06:52:57 +0000
Statistical Computations at FreeStatistics.org, Office for Research Development and Education, URL https://freestatistics.org/blog/index.php?pk=34805, Retrieved Sat, 11 May 2024 06:52:57 +0000
QR Codes:

Original text written by user:
IsPrivate?No (this computation is public)
User-defined keywords
Estimated Impact178
Family? (F = Feedback message, R = changed R code, M = changed R Module, P = changed Parameters, D = changed Data)
-     [(Partial) Autocorrelation Function] [(Partial) Autocor...] [2008-12-11 14:56:15] [87cabf13a90315c7085b765dcebb7412]
-   P   [(Partial) Autocorrelation Function] [(Partial) Autocor...] [2008-12-11 15:06:01] [87cabf13a90315c7085b765dcebb7412]
-   PD    [(Partial) Autocorrelation Function] [(Partial) Autocor...] [2008-12-11 15:23:01] [87cabf13a90315c7085b765dcebb7412]
-   P       [(Partial) Autocorrelation Function] [(Partial) Autocor...] [2008-12-12 09:41:51] [87cabf13a90315c7085b765dcebb7412]
-   PD          [(Partial) Autocorrelation Function] [autocorrelation <...] [2008-12-18 14:42:48] [4e8974eee929007194de34cbeefcb780] [Current]
Feedback Forum

Post a new message
Dataseries X:
12460
12870
14122
15366
15366
15046
10356
10194
11027
11449
12107
12862
12587
13951
15210
17511
17247
16900
12237
12188
12801
13276
14171
14629
16242
17239
18516
19862
19542
18515
13182
13148
13853
14341
14895
15317
15649
16373
17543
18911
19401
18295
12665
12246
12969
13563
15714
16094
15823
15460
16827
18279
18789
18041
12129
11708
12387
12982
13664
14073
14222
14715
15697
16908
17412
16232
10281
10258
11013
11779
12333
12684
12654
13239
14729
16146
16324
13797
9399
9626
10290
10931
11382
11704
11716
12470
13662
15097
15821
13083
9081
9479
10295
10999
11643
12055
12431
12940
14168
16031
16445
14245
9820
10389
11298
12156
12759
13414
13683
14070
15176
16694
17694
14294
9255
9868
10878
11685
12496
12488


Summary of computational transaction
Raw Inputview raw input (R code)
Raw Outputview raw output of R engine
Computing time1 seconds
R Server'George Udny Yule' @ 72.249.76.132

\begin{tabular}{lllllllll}
\hline
Summary of computational transaction \tabularnewline
Raw Input & view raw input (R code)  \tabularnewline
Raw Output & view raw output of R engine  \tabularnewline
Computing time & 1 seconds \tabularnewline
R Server & 'George Udny Yule' @ 72.249.76.132 \tabularnewline
\hline
\end{tabular}
%Source: https://freestatistics.org/blog/index.php?pk=34805&T=0

[TABLE]
[ROW][C]Summary of computational transaction[/C][/ROW]
[ROW][C]Raw Input[/C][C]view raw input (R code) [/C][/ROW]
[ROW][C]Raw Output[/C][C]view raw output of R engine [/C][/ROW]
[ROW][C]Computing time[/C][C]1 seconds[/C][/ROW]
[ROW][C]R Server[/C][C]'George Udny Yule' @ 72.249.76.132[/C][/ROW]
[/TABLE]
Source: https://freestatistics.org/blog/index.php?pk=34805&T=0

Globally Unique Identifier (entire table): ba.freestatistics.org/blog/index.php?pk=34805&T=0

As an alternative you can also use a QR Code:  

The GUIDs for individual cells are displayed in the table below:

Summary of computational transaction
Raw Inputview raw input (R code)
Raw Outputview raw output of R engine
Computing time1 seconds
R Server'George Udny Yule' @ 72.249.76.132


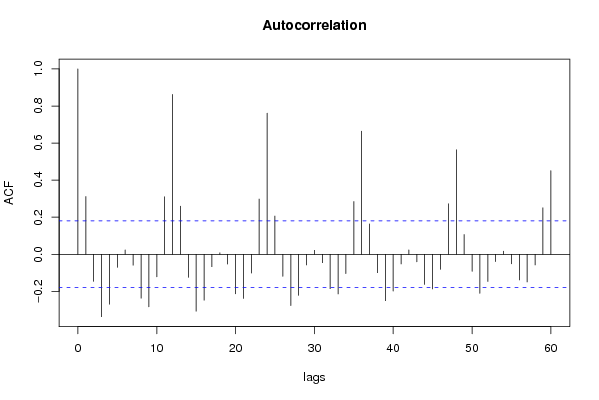
Autocorrelation Function
Time lag kACF(k)T-STATP-value
10.3114523.39750.000463
2-0.145977-1.59240.056971
3-0.336563-3.67150.000181
4-0.269402-2.93880.001979
5-0.070579-0.76990.221433
60.0235190.25660.39898
7-0.059146-0.64520.260018
8-0.237085-2.58630.005453
9-0.283386-3.09140.001241
10-0.121366-1.32390.09403
110.3102633.38460.000483
120.8621549.4050
130.2592782.82840.002746
14-0.124625-1.35950.088279
15-0.306919-3.34810.000545
16-0.247702-2.70210.003949
17-0.067214-0.73320.232432
180.0080690.0880.465004
19-0.053066-0.57890.281881
20-0.213206-2.32580.010861
21-0.238472-2.60140.005231
22-0.101657-1.1090.134844
230.2981393.25230.000745
240.7613138.30490
250.2063742.25130.013102
26-0.11905-1.29870.098281
27-0.276805-3.01960.001549
28-0.221268-2.41380.008657
29-0.057476-0.6270.265934
300.0211860.23110.408814
31-0.045492-0.49630.310315
32-0.185369-2.02210.022703
33-0.2139-2.33340.010653
34-0.103799-1.13230.129889
350.2847493.10620.001185
360.6643937.24770
370.1638811.78770.038183
38-0.099133-1.08140.14085
39-0.250269-2.73010.003647
40-0.198548-2.16590.016157
41-0.052272-0.57020.2848
420.0234510.25580.399266
43-0.040697-0.4440.328942
44-0.162981-1.77790.038986
45-0.187158-2.04170.021698
46-0.081015-0.88380.189302
470.2726082.97380.001781
480.5637316.14960
490.1064731.16150.123884
50-0.09222-1.0060.158229
51-0.210489-2.29620.011708
52-0.146462-1.59770.05638
53-0.039293-0.42860.334481
540.0165170.18020.428658
55-0.05148-0.56160.287729
56-0.138419-1.510.06685
57-0.149135-1.62690.053204
58-0.057501-0.62730.265846
590.2505592.73330.003614
600.4510794.92071e-06

\begin{tabular}{lllllllll}
\hline
Autocorrelation Function \tabularnewline
Time lag k & ACF(k) & T-STAT & P-value \tabularnewline
1 & 0.311452 & 3.3975 & 0.000463 \tabularnewline
2 & -0.145977 & -1.5924 & 0.056971 \tabularnewline
3 & -0.336563 & -3.6715 & 0.000181 \tabularnewline
4 & -0.269402 & -2.9388 & 0.001979 \tabularnewline
5 & -0.070579 & -0.7699 & 0.221433 \tabularnewline
6 & 0.023519 & 0.2566 & 0.39898 \tabularnewline
7 & -0.059146 & -0.6452 & 0.260018 \tabularnewline
8 & -0.237085 & -2.5863 & 0.005453 \tabularnewline
9 & -0.283386 & -3.0914 & 0.001241 \tabularnewline
10 & -0.121366 & -1.3239 & 0.09403 \tabularnewline
11 & 0.310263 & 3.3846 & 0.000483 \tabularnewline
12 & 0.862154 & 9.405 & 0 \tabularnewline
13 & 0.259278 & 2.8284 & 0.002746 \tabularnewline
14 & -0.124625 & -1.3595 & 0.088279 \tabularnewline
15 & -0.306919 & -3.3481 & 0.000545 \tabularnewline
16 & -0.247702 & -2.7021 & 0.003949 \tabularnewline
17 & -0.067214 & -0.7332 & 0.232432 \tabularnewline
18 & 0.008069 & 0.088 & 0.465004 \tabularnewline
19 & -0.053066 & -0.5789 & 0.281881 \tabularnewline
20 & -0.213206 & -2.3258 & 0.010861 \tabularnewline
21 & -0.238472 & -2.6014 & 0.005231 \tabularnewline
22 & -0.101657 & -1.109 & 0.134844 \tabularnewline
23 & 0.298139 & 3.2523 & 0.000745 \tabularnewline
24 & 0.761313 & 8.3049 & 0 \tabularnewline
25 & 0.206374 & 2.2513 & 0.013102 \tabularnewline
26 & -0.11905 & -1.2987 & 0.098281 \tabularnewline
27 & -0.276805 & -3.0196 & 0.001549 \tabularnewline
28 & -0.221268 & -2.4138 & 0.008657 \tabularnewline
29 & -0.057476 & -0.627 & 0.265934 \tabularnewline
30 & 0.021186 & 0.2311 & 0.408814 \tabularnewline
31 & -0.045492 & -0.4963 & 0.310315 \tabularnewline
32 & -0.185369 & -2.0221 & 0.022703 \tabularnewline
33 & -0.2139 & -2.3334 & 0.010653 \tabularnewline
34 & -0.103799 & -1.1323 & 0.129889 \tabularnewline
35 & 0.284749 & 3.1062 & 0.001185 \tabularnewline
36 & 0.664393 & 7.2477 & 0 \tabularnewline
37 & 0.163881 & 1.7877 & 0.038183 \tabularnewline
38 & -0.099133 & -1.0814 & 0.14085 \tabularnewline
39 & -0.250269 & -2.7301 & 0.003647 \tabularnewline
40 & -0.198548 & -2.1659 & 0.016157 \tabularnewline
41 & -0.052272 & -0.5702 & 0.2848 \tabularnewline
42 & 0.023451 & 0.2558 & 0.399266 \tabularnewline
43 & -0.040697 & -0.444 & 0.328942 \tabularnewline
44 & -0.162981 & -1.7779 & 0.038986 \tabularnewline
45 & -0.187158 & -2.0417 & 0.021698 \tabularnewline
46 & -0.081015 & -0.8838 & 0.189302 \tabularnewline
47 & 0.272608 & 2.9738 & 0.001781 \tabularnewline
48 & 0.563731 & 6.1496 & 0 \tabularnewline
49 & 0.106473 & 1.1615 & 0.123884 \tabularnewline
50 & -0.09222 & -1.006 & 0.158229 \tabularnewline
51 & -0.210489 & -2.2962 & 0.011708 \tabularnewline
52 & -0.146462 & -1.5977 & 0.05638 \tabularnewline
53 & -0.039293 & -0.4286 & 0.334481 \tabularnewline
54 & 0.016517 & 0.1802 & 0.428658 \tabularnewline
55 & -0.05148 & -0.5616 & 0.287729 \tabularnewline
56 & -0.138419 & -1.51 & 0.06685 \tabularnewline
57 & -0.149135 & -1.6269 & 0.053204 \tabularnewline
58 & -0.057501 & -0.6273 & 0.265846 \tabularnewline
59 & 0.250559 & 2.7333 & 0.003614 \tabularnewline
60 & 0.451079 & 4.9207 & 1e-06 \tabularnewline
\hline
\end{tabular}
%Source: https://freestatistics.org/blog/index.php?pk=34805&T=1

[TABLE]
[ROW][C]Autocorrelation Function[/C][/ROW]
[ROW][C]Time lag k[/C][C]ACF(k)[/C][C]T-STAT[/C][C]P-value[/C][/ROW]
[ROW][C]1[/C][C]0.311452[/C][C]3.3975[/C][C]0.000463[/C][/ROW]
[ROW][C]2[/C][C]-0.145977[/C][C]-1.5924[/C][C]0.056971[/C][/ROW]
[ROW][C]3[/C][C]-0.336563[/C][C]-3.6715[/C][C]0.000181[/C][/ROW]
[ROW][C]4[/C][C]-0.269402[/C][C]-2.9388[/C][C]0.001979[/C][/ROW]
[ROW][C]5[/C][C]-0.070579[/C][C]-0.7699[/C][C]0.221433[/C][/ROW]
[ROW][C]6[/C][C]0.023519[/C][C]0.2566[/C][C]0.39898[/C][/ROW]
[ROW][C]7[/C][C]-0.059146[/C][C]-0.6452[/C][C]0.260018[/C][/ROW]
[ROW][C]8[/C][C]-0.237085[/C][C]-2.5863[/C][C]0.005453[/C][/ROW]
[ROW][C]9[/C][C]-0.283386[/C][C]-3.0914[/C][C]0.001241[/C][/ROW]
[ROW][C]10[/C][C]-0.121366[/C][C]-1.3239[/C][C]0.09403[/C][/ROW]
[ROW][C]11[/C][C]0.310263[/C][C]3.3846[/C][C]0.000483[/C][/ROW]
[ROW][C]12[/C][C]0.862154[/C][C]9.405[/C][C]0[/C][/ROW]
[ROW][C]13[/C][C]0.259278[/C][C]2.8284[/C][C]0.002746[/C][/ROW]
[ROW][C]14[/C][C]-0.124625[/C][C]-1.3595[/C][C]0.088279[/C][/ROW]
[ROW][C]15[/C][C]-0.306919[/C][C]-3.3481[/C][C]0.000545[/C][/ROW]
[ROW][C]16[/C][C]-0.247702[/C][C]-2.7021[/C][C]0.003949[/C][/ROW]
[ROW][C]17[/C][C]-0.067214[/C][C]-0.7332[/C][C]0.232432[/C][/ROW]
[ROW][C]18[/C][C]0.008069[/C][C]0.088[/C][C]0.465004[/C][/ROW]
[ROW][C]19[/C][C]-0.053066[/C][C]-0.5789[/C][C]0.281881[/C][/ROW]
[ROW][C]20[/C][C]-0.213206[/C][C]-2.3258[/C][C]0.010861[/C][/ROW]
[ROW][C]21[/C][C]-0.238472[/C][C]-2.6014[/C][C]0.005231[/C][/ROW]
[ROW][C]22[/C][C]-0.101657[/C][C]-1.109[/C][C]0.134844[/C][/ROW]
[ROW][C]23[/C][C]0.298139[/C][C]3.2523[/C][C]0.000745[/C][/ROW]
[ROW][C]24[/C][C]0.761313[/C][C]8.3049[/C][C]0[/C][/ROW]
[ROW][C]25[/C][C]0.206374[/C][C]2.2513[/C][C]0.013102[/C][/ROW]
[ROW][C]26[/C][C]-0.11905[/C][C]-1.2987[/C][C]0.098281[/C][/ROW]
[ROW][C]27[/C][C]-0.276805[/C][C]-3.0196[/C][C]0.001549[/C][/ROW]
[ROW][C]28[/C][C]-0.221268[/C][C]-2.4138[/C][C]0.008657[/C][/ROW]
[ROW][C]29[/C][C]-0.057476[/C][C]-0.627[/C][C]0.265934[/C][/ROW]
[ROW][C]30[/C][C]0.021186[/C][C]0.2311[/C][C]0.408814[/C][/ROW]
[ROW][C]31[/C][C]-0.045492[/C][C]-0.4963[/C][C]0.310315[/C][/ROW]
[ROW][C]32[/C][C]-0.185369[/C][C]-2.0221[/C][C]0.022703[/C][/ROW]
[ROW][C]33[/C][C]-0.2139[/C][C]-2.3334[/C][C]0.010653[/C][/ROW]
[ROW][C]34[/C][C]-0.103799[/C][C]-1.1323[/C][C]0.129889[/C][/ROW]
[ROW][C]35[/C][C]0.284749[/C][C]3.1062[/C][C]0.001185[/C][/ROW]
[ROW][C]36[/C][C]0.664393[/C][C]7.2477[/C][C]0[/C][/ROW]
[ROW][C]37[/C][C]0.163881[/C][C]1.7877[/C][C]0.038183[/C][/ROW]
[ROW][C]38[/C][C]-0.099133[/C][C]-1.0814[/C][C]0.14085[/C][/ROW]
[ROW][C]39[/C][C]-0.250269[/C][C]-2.7301[/C][C]0.003647[/C][/ROW]
[ROW][C]40[/C][C]-0.198548[/C][C]-2.1659[/C][C]0.016157[/C][/ROW]
[ROW][C]41[/C][C]-0.052272[/C][C]-0.5702[/C][C]0.2848[/C][/ROW]
[ROW][C]42[/C][C]0.023451[/C][C]0.2558[/C][C]0.399266[/C][/ROW]
[ROW][C]43[/C][C]-0.040697[/C][C]-0.444[/C][C]0.328942[/C][/ROW]
[ROW][C]44[/C][C]-0.162981[/C][C]-1.7779[/C][C]0.038986[/C][/ROW]
[ROW][C]45[/C][C]-0.187158[/C][C]-2.0417[/C][C]0.021698[/C][/ROW]
[ROW][C]46[/C][C]-0.081015[/C][C]-0.8838[/C][C]0.189302[/C][/ROW]
[ROW][C]47[/C][C]0.272608[/C][C]2.9738[/C][C]0.001781[/C][/ROW]
[ROW][C]48[/C][C]0.563731[/C][C]6.1496[/C][C]0[/C][/ROW]
[ROW][C]49[/C][C]0.106473[/C][C]1.1615[/C][C]0.123884[/C][/ROW]
[ROW][C]50[/C][C]-0.09222[/C][C]-1.006[/C][C]0.158229[/C][/ROW]
[ROW][C]51[/C][C]-0.210489[/C][C]-2.2962[/C][C]0.011708[/C][/ROW]
[ROW][C]52[/C][C]-0.146462[/C][C]-1.5977[/C][C]0.05638[/C][/ROW]
[ROW][C]53[/C][C]-0.039293[/C][C]-0.4286[/C][C]0.334481[/C][/ROW]
[ROW][C]54[/C][C]0.016517[/C][C]0.1802[/C][C]0.428658[/C][/ROW]
[ROW][C]55[/C][C]-0.05148[/C][C]-0.5616[/C][C]0.287729[/C][/ROW]
[ROW][C]56[/C][C]-0.138419[/C][C]-1.51[/C][C]0.06685[/C][/ROW]
[ROW][C]57[/C][C]-0.149135[/C][C]-1.6269[/C][C]0.053204[/C][/ROW]
[ROW][C]58[/C][C]-0.057501[/C][C]-0.6273[/C][C]0.265846[/C][/ROW]
[ROW][C]59[/C][C]0.250559[/C][C]2.7333[/C][C]0.003614[/C][/ROW]
[ROW][C]60[/C][C]0.451079[/C][C]4.9207[/C][C]1e-06[/C][/ROW]
[/TABLE]
Source: https://freestatistics.org/blog/index.php?pk=34805&T=1

Globally Unique Identifier (entire table): ba.freestatistics.org/blog/index.php?pk=34805&T=1

As an alternative you can also use a QR Code:  

The GUIDs for individual cells are displayed in the table below:

Autocorrelation Function
Time lag kACF(k)T-STATP-value
10.3114523.39750.000463
2-0.145977-1.59240.056971
3-0.336563-3.67150.000181
4-0.269402-2.93880.001979
5-0.070579-0.76990.221433
60.0235190.25660.39898
7-0.059146-0.64520.260018
8-0.237085-2.58630.005453
9-0.283386-3.09140.001241
10-0.121366-1.32390.09403
110.3102633.38460.000483
120.8621549.4050
130.2592782.82840.002746
14-0.124625-1.35950.088279
15-0.306919-3.34810.000545
16-0.247702-2.70210.003949
17-0.067214-0.73320.232432
180.0080690.0880.465004
19-0.053066-0.57890.281881
20-0.213206-2.32580.010861
21-0.238472-2.60140.005231
22-0.101657-1.1090.134844
230.2981393.25230.000745
240.7613138.30490
250.2063742.25130.013102
26-0.11905-1.29870.098281
27-0.276805-3.01960.001549
28-0.221268-2.41380.008657
29-0.057476-0.6270.265934
300.0211860.23110.408814
31-0.045492-0.49630.310315
32-0.185369-2.02210.022703
33-0.2139-2.33340.010653
34-0.103799-1.13230.129889
350.2847493.10620.001185
360.6643937.24770
370.1638811.78770.038183
38-0.099133-1.08140.14085
39-0.250269-2.73010.003647
40-0.198548-2.16590.016157
41-0.052272-0.57020.2848
420.0234510.25580.399266
43-0.040697-0.4440.328942
44-0.162981-1.77790.038986
45-0.187158-2.04170.021698
46-0.081015-0.88380.189302
470.2726082.97380.001781
480.5637316.14960
490.1064731.16150.123884
50-0.09222-1.0060.158229
51-0.210489-2.29620.011708
52-0.146462-1.59770.05638
53-0.039293-0.42860.334481
540.0165170.18020.428658
55-0.05148-0.56160.287729
56-0.138419-1.510.06685
57-0.149135-1.62690.053204
58-0.057501-0.62730.265846
590.2505592.73330.003614
600.4510794.92071e-06


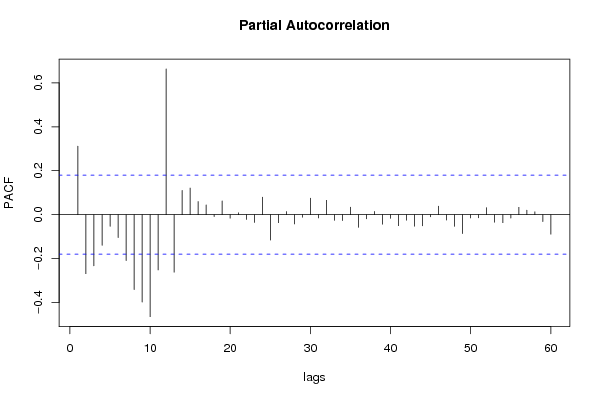
Partial Autocorrelation Function
Time lag kPACF(k)T-STATP-value
10.3114523.39750.000463
2-0.269081-2.93530.002
3-0.232873-2.54030.006181
4-0.139836-1.52540.064903
5-0.053198-0.58030.281399
6-0.104215-1.13680.128943
7-0.209317-2.28340.012091
8-0.341044-3.72030.000153
9-0.397807-4.33961.5e-05
10-0.464481-5.06691e-06
11-0.251731-2.74610.003484
120.6634147.2370
13-0.262323-2.86160.00249
140.1101991.20210.115851
150.1211971.32210.094334
160.0595350.64950.258649
170.0442610.48280.315051
18-0.008891-0.0970.461451
190.0623660.68030.248808
20-0.016173-0.17640.430129
210.0081060.08840.464842
22-0.021725-0.2370.406536
23-0.035716-0.38960.348759
240.0796360.86870.193373
25-0.11555-1.26050.104978
26-0.036769-0.40110.344532
270.013820.15080.440211
28-0.042068-0.45890.323569
29-0.011411-0.12450.450572
300.0748480.81650.207926
31-0.014855-0.16210.435769
320.065180.7110.239229
33-0.025714-0.28050.389788
34-0.026706-0.29130.385652
350.0340470.37140.355496
36-0.057737-0.62980.265006
37-0.019189-0.20930.417275
380.0147780.16120.436101
39-0.043391-0.47330.318418
40-0.016463-0.17960.428891
41-0.050019-0.54560.293165
42-0.025147-0.27430.392155
43-0.052832-0.57630.282742
44-0.050598-0.5520.291004
45-0.00973-0.10610.457826
460.0385360.42040.337482
47-0.024437-0.26660.395128
48-0.053221-0.58060.281315
49-0.086273-0.94110.174274
50-0.01495-0.16310.435364
51-0.01423-0.15520.43845
520.0316450.34520.365273
53-0.03461-0.37750.353219
54-0.036814-0.40160.344351
55-0.01539-0.16790.433481
560.033260.36280.358688
570.0203570.22210.412322
580.0128510.14020.444373
59-0.03168-0.34560.365133
60-0.089146-0.97250.166394

\begin{tabular}{lllllllll}
\hline
Partial Autocorrelation Function \tabularnewline
Time lag k & PACF(k) & T-STAT & P-value \tabularnewline
1 & 0.311452 & 3.3975 & 0.000463 \tabularnewline
2 & -0.269081 & -2.9353 & 0.002 \tabularnewline
3 & -0.232873 & -2.5403 & 0.006181 \tabularnewline
4 & -0.139836 & -1.5254 & 0.064903 \tabularnewline
5 & -0.053198 & -0.5803 & 0.281399 \tabularnewline
6 & -0.104215 & -1.1368 & 0.128943 \tabularnewline
7 & -0.209317 & -2.2834 & 0.012091 \tabularnewline
8 & -0.341044 & -3.7203 & 0.000153 \tabularnewline
9 & -0.397807 & -4.3396 & 1.5e-05 \tabularnewline
10 & -0.464481 & -5.0669 & 1e-06 \tabularnewline
11 & -0.251731 & -2.7461 & 0.003484 \tabularnewline
12 & 0.663414 & 7.237 & 0 \tabularnewline
13 & -0.262323 & -2.8616 & 0.00249 \tabularnewline
14 & 0.110199 & 1.2021 & 0.115851 \tabularnewline
15 & 0.121197 & 1.3221 & 0.094334 \tabularnewline
16 & 0.059535 & 0.6495 & 0.258649 \tabularnewline
17 & 0.044261 & 0.4828 & 0.315051 \tabularnewline
18 & -0.008891 & -0.097 & 0.461451 \tabularnewline
19 & 0.062366 & 0.6803 & 0.248808 \tabularnewline
20 & -0.016173 & -0.1764 & 0.430129 \tabularnewline
21 & 0.008106 & 0.0884 & 0.464842 \tabularnewline
22 & -0.021725 & -0.237 & 0.406536 \tabularnewline
23 & -0.035716 & -0.3896 & 0.348759 \tabularnewline
24 & 0.079636 & 0.8687 & 0.193373 \tabularnewline
25 & -0.11555 & -1.2605 & 0.104978 \tabularnewline
26 & -0.036769 & -0.4011 & 0.344532 \tabularnewline
27 & 0.01382 & 0.1508 & 0.440211 \tabularnewline
28 & -0.042068 & -0.4589 & 0.323569 \tabularnewline
29 & -0.011411 & -0.1245 & 0.450572 \tabularnewline
30 & 0.074848 & 0.8165 & 0.207926 \tabularnewline
31 & -0.014855 & -0.1621 & 0.435769 \tabularnewline
32 & 0.06518 & 0.711 & 0.239229 \tabularnewline
33 & -0.025714 & -0.2805 & 0.389788 \tabularnewline
34 & -0.026706 & -0.2913 & 0.385652 \tabularnewline
35 & 0.034047 & 0.3714 & 0.355496 \tabularnewline
36 & -0.057737 & -0.6298 & 0.265006 \tabularnewline
37 & -0.019189 & -0.2093 & 0.417275 \tabularnewline
38 & 0.014778 & 0.1612 & 0.436101 \tabularnewline
39 & -0.043391 & -0.4733 & 0.318418 \tabularnewline
40 & -0.016463 & -0.1796 & 0.428891 \tabularnewline
41 & -0.050019 & -0.5456 & 0.293165 \tabularnewline
42 & -0.025147 & -0.2743 & 0.392155 \tabularnewline
43 & -0.052832 & -0.5763 & 0.282742 \tabularnewline
44 & -0.050598 & -0.552 & 0.291004 \tabularnewline
45 & -0.00973 & -0.1061 & 0.457826 \tabularnewline
46 & 0.038536 & 0.4204 & 0.337482 \tabularnewline
47 & -0.024437 & -0.2666 & 0.395128 \tabularnewline
48 & -0.053221 & -0.5806 & 0.281315 \tabularnewline
49 & -0.086273 & -0.9411 & 0.174274 \tabularnewline
50 & -0.01495 & -0.1631 & 0.435364 \tabularnewline
51 & -0.01423 & -0.1552 & 0.43845 \tabularnewline
52 & 0.031645 & 0.3452 & 0.365273 \tabularnewline
53 & -0.03461 & -0.3775 & 0.353219 \tabularnewline
54 & -0.036814 & -0.4016 & 0.344351 \tabularnewline
55 & -0.01539 & -0.1679 & 0.433481 \tabularnewline
56 & 0.03326 & 0.3628 & 0.358688 \tabularnewline
57 & 0.020357 & 0.2221 & 0.412322 \tabularnewline
58 & 0.012851 & 0.1402 & 0.444373 \tabularnewline
59 & -0.03168 & -0.3456 & 0.365133 \tabularnewline
60 & -0.089146 & -0.9725 & 0.166394 \tabularnewline
\hline
\end{tabular}
%Source: https://freestatistics.org/blog/index.php?pk=34805&T=2

[TABLE]
[ROW][C]Partial Autocorrelation Function[/C][/ROW]
[ROW][C]Time lag k[/C][C]PACF(k)[/C][C]T-STAT[/C][C]P-value[/C][/ROW]
[ROW][C]1[/C][C]0.311452[/C][C]3.3975[/C][C]0.000463[/C][/ROW]
[ROW][C]2[/C][C]-0.269081[/C][C]-2.9353[/C][C]0.002[/C][/ROW]
[ROW][C]3[/C][C]-0.232873[/C][C]-2.5403[/C][C]0.006181[/C][/ROW]
[ROW][C]4[/C][C]-0.139836[/C][C]-1.5254[/C][C]0.064903[/C][/ROW]
[ROW][C]5[/C][C]-0.053198[/C][C]-0.5803[/C][C]0.281399[/C][/ROW]
[ROW][C]6[/C][C]-0.104215[/C][C]-1.1368[/C][C]0.128943[/C][/ROW]
[ROW][C]7[/C][C]-0.209317[/C][C]-2.2834[/C][C]0.012091[/C][/ROW]
[ROW][C]8[/C][C]-0.341044[/C][C]-3.7203[/C][C]0.000153[/C][/ROW]
[ROW][C]9[/C][C]-0.397807[/C][C]-4.3396[/C][C]1.5e-05[/C][/ROW]
[ROW][C]10[/C][C]-0.464481[/C][C]-5.0669[/C][C]1e-06[/C][/ROW]
[ROW][C]11[/C][C]-0.251731[/C][C]-2.7461[/C][C]0.003484[/C][/ROW]
[ROW][C]12[/C][C]0.663414[/C][C]7.237[/C][C]0[/C][/ROW]
[ROW][C]13[/C][C]-0.262323[/C][C]-2.8616[/C][C]0.00249[/C][/ROW]
[ROW][C]14[/C][C]0.110199[/C][C]1.2021[/C][C]0.115851[/C][/ROW]
[ROW][C]15[/C][C]0.121197[/C][C]1.3221[/C][C]0.094334[/C][/ROW]
[ROW][C]16[/C][C]0.059535[/C][C]0.6495[/C][C]0.258649[/C][/ROW]
[ROW][C]17[/C][C]0.044261[/C][C]0.4828[/C][C]0.315051[/C][/ROW]
[ROW][C]18[/C][C]-0.008891[/C][C]-0.097[/C][C]0.461451[/C][/ROW]
[ROW][C]19[/C][C]0.062366[/C][C]0.6803[/C][C]0.248808[/C][/ROW]
[ROW][C]20[/C][C]-0.016173[/C][C]-0.1764[/C][C]0.430129[/C][/ROW]
[ROW][C]21[/C][C]0.008106[/C][C]0.0884[/C][C]0.464842[/C][/ROW]
[ROW][C]22[/C][C]-0.021725[/C][C]-0.237[/C][C]0.406536[/C][/ROW]
[ROW][C]23[/C][C]-0.035716[/C][C]-0.3896[/C][C]0.348759[/C][/ROW]
[ROW][C]24[/C][C]0.079636[/C][C]0.8687[/C][C]0.193373[/C][/ROW]
[ROW][C]25[/C][C]-0.11555[/C][C]-1.2605[/C][C]0.104978[/C][/ROW]
[ROW][C]26[/C][C]-0.036769[/C][C]-0.4011[/C][C]0.344532[/C][/ROW]
[ROW][C]27[/C][C]0.01382[/C][C]0.1508[/C][C]0.440211[/C][/ROW]
[ROW][C]28[/C][C]-0.042068[/C][C]-0.4589[/C][C]0.323569[/C][/ROW]
[ROW][C]29[/C][C]-0.011411[/C][C]-0.1245[/C][C]0.450572[/C][/ROW]
[ROW][C]30[/C][C]0.074848[/C][C]0.8165[/C][C]0.207926[/C][/ROW]
[ROW][C]31[/C][C]-0.014855[/C][C]-0.1621[/C][C]0.435769[/C][/ROW]
[ROW][C]32[/C][C]0.06518[/C][C]0.711[/C][C]0.239229[/C][/ROW]
[ROW][C]33[/C][C]-0.025714[/C][C]-0.2805[/C][C]0.389788[/C][/ROW]
[ROW][C]34[/C][C]-0.026706[/C][C]-0.2913[/C][C]0.385652[/C][/ROW]
[ROW][C]35[/C][C]0.034047[/C][C]0.3714[/C][C]0.355496[/C][/ROW]
[ROW][C]36[/C][C]-0.057737[/C][C]-0.6298[/C][C]0.265006[/C][/ROW]
[ROW][C]37[/C][C]-0.019189[/C][C]-0.2093[/C][C]0.417275[/C][/ROW]
[ROW][C]38[/C][C]0.014778[/C][C]0.1612[/C][C]0.436101[/C][/ROW]
[ROW][C]39[/C][C]-0.043391[/C][C]-0.4733[/C][C]0.318418[/C][/ROW]
[ROW][C]40[/C][C]-0.016463[/C][C]-0.1796[/C][C]0.428891[/C][/ROW]
[ROW][C]41[/C][C]-0.050019[/C][C]-0.5456[/C][C]0.293165[/C][/ROW]
[ROW][C]42[/C][C]-0.025147[/C][C]-0.2743[/C][C]0.392155[/C][/ROW]
[ROW][C]43[/C][C]-0.052832[/C][C]-0.5763[/C][C]0.282742[/C][/ROW]
[ROW][C]44[/C][C]-0.050598[/C][C]-0.552[/C][C]0.291004[/C][/ROW]
[ROW][C]45[/C][C]-0.00973[/C][C]-0.1061[/C][C]0.457826[/C][/ROW]
[ROW][C]46[/C][C]0.038536[/C][C]0.4204[/C][C]0.337482[/C][/ROW]
[ROW][C]47[/C][C]-0.024437[/C][C]-0.2666[/C][C]0.395128[/C][/ROW]
[ROW][C]48[/C][C]-0.053221[/C][C]-0.5806[/C][C]0.281315[/C][/ROW]
[ROW][C]49[/C][C]-0.086273[/C][C]-0.9411[/C][C]0.174274[/C][/ROW]
[ROW][C]50[/C][C]-0.01495[/C][C]-0.1631[/C][C]0.435364[/C][/ROW]
[ROW][C]51[/C][C]-0.01423[/C][C]-0.1552[/C][C]0.43845[/C][/ROW]
[ROW][C]52[/C][C]0.031645[/C][C]0.3452[/C][C]0.365273[/C][/ROW]
[ROW][C]53[/C][C]-0.03461[/C][C]-0.3775[/C][C]0.353219[/C][/ROW]
[ROW][C]54[/C][C]-0.036814[/C][C]-0.4016[/C][C]0.344351[/C][/ROW]
[ROW][C]55[/C][C]-0.01539[/C][C]-0.1679[/C][C]0.433481[/C][/ROW]
[ROW][C]56[/C][C]0.03326[/C][C]0.3628[/C][C]0.358688[/C][/ROW]
[ROW][C]57[/C][C]0.020357[/C][C]0.2221[/C][C]0.412322[/C][/ROW]
[ROW][C]58[/C][C]0.012851[/C][C]0.1402[/C][C]0.444373[/C][/ROW]
[ROW][C]59[/C][C]-0.03168[/C][C]-0.3456[/C][C]0.365133[/C][/ROW]
[ROW][C]60[/C][C]-0.089146[/C][C]-0.9725[/C][C]0.166394[/C][/ROW]
[/TABLE]
Source: https://freestatistics.org/blog/index.php?pk=34805&T=2

Globally Unique Identifier (entire table): ba.freestatistics.org/blog/index.php?pk=34805&T=2

As an alternative you can also use a QR Code:  

The GUIDs for individual cells are displayed in the table below:

Partial Autocorrelation Function
Time lag kPACF(k)T-STATP-value
10.3114523.39750.000463
2-0.269081-2.93530.002
3-0.232873-2.54030.006181
4-0.139836-1.52540.064903
5-0.053198-0.58030.281399
6-0.104215-1.13680.128943
7-0.209317-2.28340.012091
8-0.341044-3.72030.000153
9-0.397807-4.33961.5e-05
10-0.464481-5.06691e-06
11-0.251731-2.74610.003484
120.6634147.2370
13-0.262323-2.86160.00249
140.1101991.20210.115851
150.1211971.32210.094334
160.0595350.64950.258649
170.0442610.48280.315051
18-0.008891-0.0970.461451
190.0623660.68030.248808
20-0.016173-0.17640.430129
210.0081060.08840.464842
22-0.021725-0.2370.406536
23-0.035716-0.38960.348759
240.0796360.86870.193373
25-0.11555-1.26050.104978
26-0.036769-0.40110.344532
270.013820.15080.440211
28-0.042068-0.45890.323569
29-0.011411-0.12450.450572
300.0748480.81650.207926
31-0.014855-0.16210.435769
320.065180.7110.239229
33-0.025714-0.28050.389788
34-0.026706-0.29130.385652
350.0340470.37140.355496
36-0.057737-0.62980.265006
37-0.019189-0.20930.417275
380.0147780.16120.436101
39-0.043391-0.47330.318418
40-0.016463-0.17960.428891
41-0.050019-0.54560.293165
42-0.025147-0.27430.392155
43-0.052832-0.57630.282742
44-0.050598-0.5520.291004
45-0.00973-0.10610.457826
460.0385360.42040.337482
47-0.024437-0.26660.395128
48-0.053221-0.58060.281315
49-0.086273-0.94110.174274
50-0.01495-0.16310.435364
51-0.01423-0.15520.43845
520.0316450.34520.365273
53-0.03461-0.37750.353219
54-0.036814-0.40160.344351
55-0.01539-0.16790.433481
560.033260.36280.358688
570.0203570.22210.412322
580.0128510.14020.444373
59-0.03168-0.34560.365133
60-0.089146-0.97250.166394


Parameters (Session):
par1 = 60 ; par2 = 1 ; par3 = 1 ; par4 = 0 ; par5 = 12 ;
Parameters (R input):
par1 = 60 ; par2 = 1 ; par3 = 1 ; par4 = 0 ; par5 = 12 ;
R code (references can be found in the software module):
if (par1 == 'Default') {
par1 = 10*log10(length(x))
} else {
par1 <- as.numeric(par1)
}
par2 <- as.numeric(par2)
par3 <- as.numeric(par3)
par4 <- as.numeric(par4)
par5 <- as.numeric(par5)
if (par2 == 0) {
x <- log(x)
} else {
x <- (x ^ par2 - 1) / par2
}
if (par3 > 0) x <- diff(x,lag=1,difference=par3)
if (par4 > 0) x <- diff(x,lag=par5,difference=par4)
bitmap(file='pic1.png')
racf <- acf(x,par1,main='Autocorrelation',xlab='lags',ylab='ACF')
dev.off()
bitmap(file='pic2.png')
rpacf <- pacf(x,par1,main='Partial Autocorrelation',xlab='lags',ylab='PACF')
dev.off()
(myacf <- c(racf$acf))
(mypacf <- c(rpacf$acf))
lengthx <- length(x)
sqrtn <- sqrt(lengthx)
load(file='createtable')
a<-table.start()
a<-table.row.start(a)
a<-table.element(a,'Autocorrelation Function',4,TRUE)
a<-table.row.end(a)
a<-table.row.start(a)
a<-table.element(a,'Time lag k',header=TRUE)
a<-table.element(a,hyperlink('basics.htm','ACF(k)','click here for more information about the Autocorrelation Function'),header=TRUE)
a<-table.element(a,'T-STAT',header=TRUE)
a<-table.element(a,'P-value',header=TRUE)
a<-table.row.end(a)
for (i in 2:(par1+1)) {
a<-table.row.start(a)
a<-table.element(a,i-1,header=TRUE)
a<-table.element(a,round(myacf[i],6))
mytstat <- myacf[i]*sqrtn
a<-table.element(a,round(mytstat,4))
a<-table.element(a,round(1-pt(abs(mytstat),lengthx),6))
a<-table.row.end(a)
}
a<-table.end(a)
table.save(a,file='mytable.tab')
a<-table.start()
a<-table.row.start(a)
a<-table.element(a,'Partial Autocorrelation Function',4,TRUE)
a<-table.row.end(a)
a<-table.row.start(a)
a<-table.element(a,'Time lag k',header=TRUE)
a<-table.element(a,hyperlink('basics.htm','PACF(k)','click here for more information about the Partial Autocorrelation Function'),header=TRUE)
a<-table.element(a,'T-STAT',header=TRUE)
a<-table.element(a,'P-value',header=TRUE)
a<-table.row.end(a)
for (i in 1:par1) {
a<-table.row.start(a)
a<-table.element(a,i,header=TRUE)
a<-table.element(a,round(mypacf[i],6))
mytstat <- mypacf[i]*sqrtn
a<-table.element(a,round(mytstat,4))
a<-table.element(a,round(1-pt(abs(mytstat),lengthx),6))
a<-table.row.end(a)
}
a<-table.end(a)
table.save(a,file='mytable1.tab')