Free Statistics

of Irreproducible Research!

Author's title

Author*The author of this computation has been verified*
R Software Modulerwasp_autocorrelation.wasp
Title produced by software(Partial) Autocorrelation Function
Date of computationThu, 18 Dec 2008 07:35:59 -0700
Cite this page as followsStatistical Computations at FreeStatistics.org, Office for Research Development and Education, URL https://freestatistics.org/blog/index.php?v=date/2008/Dec/18/t1229611105w9xn8he4rb86amy.htm/, Retrieved Sat, 11 May 2024 16:57:00 +0000
Statistical Computations at FreeStatistics.org, Office for Research Development and Education, URL https://freestatistics.org/blog/index.php?pk=34800, Retrieved Sat, 11 May 2024 16:57:00 +0000
QR Codes:

Original text written by user:
IsPrivate?No (this computation is public)
User-defined keywords
Estimated Impact198
Family? (F = Feedback message, R = changed R code, M = changed R Module, P = changed Parameters, D = changed Data)
-     [(Partial) Autocorrelation Function] [(Partial) Autocor...] [2008-12-11 14:56:15] [87cabf13a90315c7085b765dcebb7412]
-   P   [(Partial) Autocorrelation Function] [(Partial) Autocor...] [2008-12-11 15:06:01] [87cabf13a90315c7085b765dcebb7412]
-   PD    [(Partial) Autocorrelation Function] [(Partial) Autocor...] [2008-12-11 15:23:01] [87cabf13a90315c7085b765dcebb7412]
-   P       [(Partial) Autocorrelation Function] [(Partial) Autocor...] [2008-12-12 09:41:51] [87cabf13a90315c7085b765dcebb7412]
-    D          [(Partial) Autocorrelation Function] [autocorrelation < 20] [2008-12-18 14:35:59] [4e8974eee929007194de34cbeefcb780] [Current]
Feedback Forum

Post a new message
Dataseries X:
12460
12870
14122
15366
15366
15046
10356
10194
11027
11449
12107
12862
12587
13951
15210
17511
17247
16900
12237
12188
12801
13276
14171
14629
16242
17239
18516
19862
19542
18515
13182
13148
13853
14341
14895
15317
15649
16373
17543
18911
19401
18295
12665
12246
12969
13563
15714
16094
15823
15460
16827
18279
18789
18041
12129
11708
12387
12982
13664
14073
14222
14715
15697
16908
17412
16232
10281
10258
11013
11779
12333
12684
12654
13239
14729
16146
16324
13797
9399
9626
10290
10931
11382
11704
11716
12470
13662
15097
15821
13083
9081
9479
10295
10999
11643
12055
12431
12940
14168
16031
16445
14245
9820
10389
11298
12156
12759
13414
13683
14070
15176
16694
17694
14294
9255
9868
10878
11685
12496
12488


Summary of computational transaction
Raw Inputview raw input (R code)
Raw Outputview raw output of R engine
Computing time3 seconds
R Server'Herman Ole Andreas Wold' @ 193.190.124.10:1001

\begin{tabular}{lllllllll}
\hline
Summary of computational transaction \tabularnewline
Raw Input & view raw input (R code)  \tabularnewline
Raw Output & view raw output of R engine  \tabularnewline
Computing time & 3 seconds \tabularnewline
R Server & 'Herman Ole Andreas Wold' @ 193.190.124.10:1001 \tabularnewline
\hline
\end{tabular}
%Source: https://freestatistics.org/blog/index.php?pk=34800&T=0

[TABLE]
[ROW][C]Summary of computational transaction[/C][/ROW]
[ROW][C]Raw Input[/C][C]view raw input (R code) [/C][/ROW]
[ROW][C]Raw Output[/C][C]view raw output of R engine [/C][/ROW]
[ROW][C]Computing time[/C][C]3 seconds[/C][/ROW]
[ROW][C]R Server[/C][C]'Herman Ole Andreas Wold' @ 193.190.124.10:1001[/C][/ROW]
[/TABLE]
Source: https://freestatistics.org/blog/index.php?pk=34800&T=0

Globally Unique Identifier (entire table): ba.freestatistics.org/blog/index.php?pk=34800&T=0

As an alternative you can also use a QR Code:  

The GUIDs for individual cells are displayed in the table below:

Summary of computational transaction
Raw Inputview raw input (R code)
Raw Outputview raw output of R engine
Computing time3 seconds
R Server'Herman Ole Andreas Wold' @ 193.190.124.10:1001


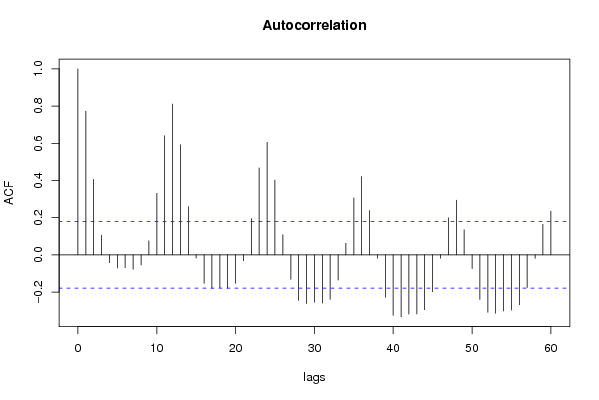
Autocorrelation Function
Time lag kACF(k)T-STATP-value
10.7726838.46430
20.4059964.44751e-05
30.1057731.15870.124444
4-0.042264-0.4630.32211
5-0.070841-0.7760.219629
6-0.069276-0.75890.224705
7-0.077858-0.85290.19771
8-0.054303-0.59490.27653
90.0756420.82860.204484
100.33123.62810.00021
110.6406087.01750
120.8111068.88520
130.5928426.49430
140.2592092.83950.002654
15-0.017198-0.18840.425444
16-0.152993-1.6760.048175
17-0.179379-1.9650.025863
18-0.177107-1.94010.027356
19-0.179034-1.96120.026085
20-0.153415-1.68060.047724
21-0.031528-0.34540.36521
220.1952722.13910.017227
230.4672625.11861e-06
240.605076.62820
250.4025914.41021.1e-05
260.1083171.18660.118874
27-0.131276-1.43810.076511
28-0.245206-2.68610.004127
29-0.261555-2.86520.002461
30-0.254521-2.78810.003083
31-0.259478-2.84240.002631
32-0.239349-2.62190.004938
33-0.135844-1.48810.069674
340.0622760.68220.248212
350.3060173.35230.000536
360.4211184.61315e-06
370.2379162.60620.005157
38-0.01829-0.20040.420769
39-0.228631-2.50450.006802
40-0.325099-3.56130.000265
41-0.332533-3.64272e-04
42-0.31877-3.49190.000336
43-0.317859-3.4820.000348
44-0.295051-3.23210.000793
45-0.197973-2.16870.01604
46-0.018094-0.19820.421608
470.1994352.18470.015427
480.2943.22060.000823
490.1345631.47410.071542
50-0.074002-0.81070.209584
51-0.239644-2.62520.004894
52-0.309376-3.3890.000475
53-0.313624-3.43560.000406
54-0.301461-3.30230.000632
55-0.296869-3.2520.000744
56-0.267837-2.9340.002005
57-0.176218-1.93040.02796
58-0.018548-0.20320.419668
590.1644981.8020.037029
600.2347062.57110.00568

\begin{tabular}{lllllllll}
\hline
Autocorrelation Function \tabularnewline
Time lag k & ACF(k) & T-STAT & P-value \tabularnewline
1 & 0.772683 & 8.4643 & 0 \tabularnewline
2 & 0.405996 & 4.4475 & 1e-05 \tabularnewline
3 & 0.105773 & 1.1587 & 0.124444 \tabularnewline
4 & -0.042264 & -0.463 & 0.32211 \tabularnewline
5 & -0.070841 & -0.776 & 0.219629 \tabularnewline
6 & -0.069276 & -0.7589 & 0.224705 \tabularnewline
7 & -0.077858 & -0.8529 & 0.19771 \tabularnewline
8 & -0.054303 & -0.5949 & 0.27653 \tabularnewline
9 & 0.075642 & 0.8286 & 0.204484 \tabularnewline
10 & 0.3312 & 3.6281 & 0.00021 \tabularnewline
11 & 0.640608 & 7.0175 & 0 \tabularnewline
12 & 0.811106 & 8.8852 & 0 \tabularnewline
13 & 0.592842 & 6.4943 & 0 \tabularnewline
14 & 0.259209 & 2.8395 & 0.002654 \tabularnewline
15 & -0.017198 & -0.1884 & 0.425444 \tabularnewline
16 & -0.152993 & -1.676 & 0.048175 \tabularnewline
17 & -0.179379 & -1.965 & 0.025863 \tabularnewline
18 & -0.177107 & -1.9401 & 0.027356 \tabularnewline
19 & -0.179034 & -1.9612 & 0.026085 \tabularnewline
20 & -0.153415 & -1.6806 & 0.047724 \tabularnewline
21 & -0.031528 & -0.3454 & 0.36521 \tabularnewline
22 & 0.195272 & 2.1391 & 0.017227 \tabularnewline
23 & 0.467262 & 5.1186 & 1e-06 \tabularnewline
24 & 0.60507 & 6.6282 & 0 \tabularnewline
25 & 0.402591 & 4.4102 & 1.1e-05 \tabularnewline
26 & 0.108317 & 1.1866 & 0.118874 \tabularnewline
27 & -0.131276 & -1.4381 & 0.076511 \tabularnewline
28 & -0.245206 & -2.6861 & 0.004127 \tabularnewline
29 & -0.261555 & -2.8652 & 0.002461 \tabularnewline
30 & -0.254521 & -2.7881 & 0.003083 \tabularnewline
31 & -0.259478 & -2.8424 & 0.002631 \tabularnewline
32 & -0.239349 & -2.6219 & 0.004938 \tabularnewline
33 & -0.135844 & -1.4881 & 0.069674 \tabularnewline
34 & 0.062276 & 0.6822 & 0.248212 \tabularnewline
35 & 0.306017 & 3.3523 & 0.000536 \tabularnewline
36 & 0.421118 & 4.6131 & 5e-06 \tabularnewline
37 & 0.237916 & 2.6062 & 0.005157 \tabularnewline
38 & -0.01829 & -0.2004 & 0.420769 \tabularnewline
39 & -0.228631 & -2.5045 & 0.006802 \tabularnewline
40 & -0.325099 & -3.5613 & 0.000265 \tabularnewline
41 & -0.332533 & -3.6427 & 2e-04 \tabularnewline
42 & -0.31877 & -3.4919 & 0.000336 \tabularnewline
43 & -0.317859 & -3.482 & 0.000348 \tabularnewline
44 & -0.295051 & -3.2321 & 0.000793 \tabularnewline
45 & -0.197973 & -2.1687 & 0.01604 \tabularnewline
46 & -0.018094 & -0.1982 & 0.421608 \tabularnewline
47 & 0.199435 & 2.1847 & 0.015427 \tabularnewline
48 & 0.294 & 3.2206 & 0.000823 \tabularnewline
49 & 0.134563 & 1.4741 & 0.071542 \tabularnewline
50 & -0.074002 & -0.8107 & 0.209584 \tabularnewline
51 & -0.239644 & -2.6252 & 0.004894 \tabularnewline
52 & -0.309376 & -3.389 & 0.000475 \tabularnewline
53 & -0.313624 & -3.4356 & 0.000406 \tabularnewline
54 & -0.301461 & -3.3023 & 0.000632 \tabularnewline
55 & -0.296869 & -3.252 & 0.000744 \tabularnewline
56 & -0.267837 & -2.934 & 0.002005 \tabularnewline
57 & -0.176218 & -1.9304 & 0.02796 \tabularnewline
58 & -0.018548 & -0.2032 & 0.419668 \tabularnewline
59 & 0.164498 & 1.802 & 0.037029 \tabularnewline
60 & 0.234706 & 2.5711 & 0.00568 \tabularnewline
\hline
\end{tabular}
%Source: https://freestatistics.org/blog/index.php?pk=34800&T=1

[TABLE]
[ROW][C]Autocorrelation Function[/C][/ROW]
[ROW][C]Time lag k[/C][C]ACF(k)[/C][C]T-STAT[/C][C]P-value[/C][/ROW]
[ROW][C]1[/C][C]0.772683[/C][C]8.4643[/C][C]0[/C][/ROW]
[ROW][C]2[/C][C]0.405996[/C][C]4.4475[/C][C]1e-05[/C][/ROW]
[ROW][C]3[/C][C]0.105773[/C][C]1.1587[/C][C]0.124444[/C][/ROW]
[ROW][C]4[/C][C]-0.042264[/C][C]-0.463[/C][C]0.32211[/C][/ROW]
[ROW][C]5[/C][C]-0.070841[/C][C]-0.776[/C][C]0.219629[/C][/ROW]
[ROW][C]6[/C][C]-0.069276[/C][C]-0.7589[/C][C]0.224705[/C][/ROW]
[ROW][C]7[/C][C]-0.077858[/C][C]-0.8529[/C][C]0.19771[/C][/ROW]
[ROW][C]8[/C][C]-0.054303[/C][C]-0.5949[/C][C]0.27653[/C][/ROW]
[ROW][C]9[/C][C]0.075642[/C][C]0.8286[/C][C]0.204484[/C][/ROW]
[ROW][C]10[/C][C]0.3312[/C][C]3.6281[/C][C]0.00021[/C][/ROW]
[ROW][C]11[/C][C]0.640608[/C][C]7.0175[/C][C]0[/C][/ROW]
[ROW][C]12[/C][C]0.811106[/C][C]8.8852[/C][C]0[/C][/ROW]
[ROW][C]13[/C][C]0.592842[/C][C]6.4943[/C][C]0[/C][/ROW]
[ROW][C]14[/C][C]0.259209[/C][C]2.8395[/C][C]0.002654[/C][/ROW]
[ROW][C]15[/C][C]-0.017198[/C][C]-0.1884[/C][C]0.425444[/C][/ROW]
[ROW][C]16[/C][C]-0.152993[/C][C]-1.676[/C][C]0.048175[/C][/ROW]
[ROW][C]17[/C][C]-0.179379[/C][C]-1.965[/C][C]0.025863[/C][/ROW]
[ROW][C]18[/C][C]-0.177107[/C][C]-1.9401[/C][C]0.027356[/C][/ROW]
[ROW][C]19[/C][C]-0.179034[/C][C]-1.9612[/C][C]0.026085[/C][/ROW]
[ROW][C]20[/C][C]-0.153415[/C][C]-1.6806[/C][C]0.047724[/C][/ROW]
[ROW][C]21[/C][C]-0.031528[/C][C]-0.3454[/C][C]0.36521[/C][/ROW]
[ROW][C]22[/C][C]0.195272[/C][C]2.1391[/C][C]0.017227[/C][/ROW]
[ROW][C]23[/C][C]0.467262[/C][C]5.1186[/C][C]1e-06[/C][/ROW]
[ROW][C]24[/C][C]0.60507[/C][C]6.6282[/C][C]0[/C][/ROW]
[ROW][C]25[/C][C]0.402591[/C][C]4.4102[/C][C]1.1e-05[/C][/ROW]
[ROW][C]26[/C][C]0.108317[/C][C]1.1866[/C][C]0.118874[/C][/ROW]
[ROW][C]27[/C][C]-0.131276[/C][C]-1.4381[/C][C]0.076511[/C][/ROW]
[ROW][C]28[/C][C]-0.245206[/C][C]-2.6861[/C][C]0.004127[/C][/ROW]
[ROW][C]29[/C][C]-0.261555[/C][C]-2.8652[/C][C]0.002461[/C][/ROW]
[ROW][C]30[/C][C]-0.254521[/C][C]-2.7881[/C][C]0.003083[/C][/ROW]
[ROW][C]31[/C][C]-0.259478[/C][C]-2.8424[/C][C]0.002631[/C][/ROW]
[ROW][C]32[/C][C]-0.239349[/C][C]-2.6219[/C][C]0.004938[/C][/ROW]
[ROW][C]33[/C][C]-0.135844[/C][C]-1.4881[/C][C]0.069674[/C][/ROW]
[ROW][C]34[/C][C]0.062276[/C][C]0.6822[/C][C]0.248212[/C][/ROW]
[ROW][C]35[/C][C]0.306017[/C][C]3.3523[/C][C]0.000536[/C][/ROW]
[ROW][C]36[/C][C]0.421118[/C][C]4.6131[/C][C]5e-06[/C][/ROW]
[ROW][C]37[/C][C]0.237916[/C][C]2.6062[/C][C]0.005157[/C][/ROW]
[ROW][C]38[/C][C]-0.01829[/C][C]-0.2004[/C][C]0.420769[/C][/ROW]
[ROW][C]39[/C][C]-0.228631[/C][C]-2.5045[/C][C]0.006802[/C][/ROW]
[ROW][C]40[/C][C]-0.325099[/C][C]-3.5613[/C][C]0.000265[/C][/ROW]
[ROW][C]41[/C][C]-0.332533[/C][C]-3.6427[/C][C]2e-04[/C][/ROW]
[ROW][C]42[/C][C]-0.31877[/C][C]-3.4919[/C][C]0.000336[/C][/ROW]
[ROW][C]43[/C][C]-0.317859[/C][C]-3.482[/C][C]0.000348[/C][/ROW]
[ROW][C]44[/C][C]-0.295051[/C][C]-3.2321[/C][C]0.000793[/C][/ROW]
[ROW][C]45[/C][C]-0.197973[/C][C]-2.1687[/C][C]0.01604[/C][/ROW]
[ROW][C]46[/C][C]-0.018094[/C][C]-0.1982[/C][C]0.421608[/C][/ROW]
[ROW][C]47[/C][C]0.199435[/C][C]2.1847[/C][C]0.015427[/C][/ROW]
[ROW][C]48[/C][C]0.294[/C][C]3.2206[/C][C]0.000823[/C][/ROW]
[ROW][C]49[/C][C]0.134563[/C][C]1.4741[/C][C]0.071542[/C][/ROW]
[ROW][C]50[/C][C]-0.074002[/C][C]-0.8107[/C][C]0.209584[/C][/ROW]
[ROW][C]51[/C][C]-0.239644[/C][C]-2.6252[/C][C]0.004894[/C][/ROW]
[ROW][C]52[/C][C]-0.309376[/C][C]-3.389[/C][C]0.000475[/C][/ROW]
[ROW][C]53[/C][C]-0.313624[/C][C]-3.4356[/C][C]0.000406[/C][/ROW]
[ROW][C]54[/C][C]-0.301461[/C][C]-3.3023[/C][C]0.000632[/C][/ROW]
[ROW][C]55[/C][C]-0.296869[/C][C]-3.252[/C][C]0.000744[/C][/ROW]
[ROW][C]56[/C][C]-0.267837[/C][C]-2.934[/C][C]0.002005[/C][/ROW]
[ROW][C]57[/C][C]-0.176218[/C][C]-1.9304[/C][C]0.02796[/C][/ROW]
[ROW][C]58[/C][C]-0.018548[/C][C]-0.2032[/C][C]0.419668[/C][/ROW]
[ROW][C]59[/C][C]0.164498[/C][C]1.802[/C][C]0.037029[/C][/ROW]
[ROW][C]60[/C][C]0.234706[/C][C]2.5711[/C][C]0.00568[/C][/ROW]
[/TABLE]
Source: https://freestatistics.org/blog/index.php?pk=34800&T=1

Globally Unique Identifier (entire table): ba.freestatistics.org/blog/index.php?pk=34800&T=1

As an alternative you can also use a QR Code:  

The GUIDs for individual cells are displayed in the table below:

Autocorrelation Function
Time lag kACF(k)T-STATP-value
10.7726838.46430
20.4059964.44751e-05
30.1057731.15870.124444
4-0.042264-0.4630.32211
5-0.070841-0.7760.219629
6-0.069276-0.75890.224705
7-0.077858-0.85290.19771
8-0.054303-0.59490.27653
90.0756420.82860.204484
100.33123.62810.00021
110.6406087.01750
120.8111068.88520
130.5928426.49430
140.2592092.83950.002654
15-0.017198-0.18840.425444
16-0.152993-1.6760.048175
17-0.179379-1.9650.025863
18-0.177107-1.94010.027356
19-0.179034-1.96120.026085
20-0.153415-1.68060.047724
21-0.031528-0.34540.36521
220.1952722.13910.017227
230.4672625.11861e-06
240.605076.62820
250.4025914.41021.1e-05
260.1083171.18660.118874
27-0.131276-1.43810.076511
28-0.245206-2.68610.004127
29-0.261555-2.86520.002461
30-0.254521-2.78810.003083
31-0.259478-2.84240.002631
32-0.239349-2.62190.004938
33-0.135844-1.48810.069674
340.0622760.68220.248212
350.3060173.35230.000536
360.4211184.61315e-06
370.2379162.60620.005157
38-0.01829-0.20040.420769
39-0.228631-2.50450.006802
40-0.325099-3.56130.000265
41-0.332533-3.64272e-04
42-0.31877-3.49190.000336
43-0.317859-3.4820.000348
44-0.295051-3.23210.000793
45-0.197973-2.16870.01604
46-0.018094-0.19820.421608
470.1994352.18470.015427
480.2943.22060.000823
490.1345631.47410.071542
50-0.074002-0.81070.209584
51-0.239644-2.62520.004894
52-0.309376-3.3890.000475
53-0.313624-3.43560.000406
54-0.301461-3.30230.000632
55-0.296869-3.2520.000744
56-0.267837-2.9340.002005
57-0.176218-1.93040.02796
58-0.018548-0.20320.419668
590.1644981.8020.037029
600.2347062.57110.00568


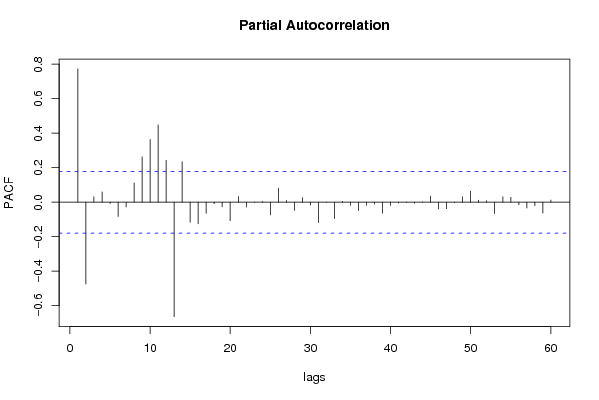
Partial Autocorrelation Function
Time lag kPACF(k)T-STATP-value
10.7726838.46430
2-0.474099-5.19350
30.0309440.3390.367611
40.0595680.65250.257651
5-0.007024-0.07690.469396
6-0.082306-0.90160.184534
7-0.027693-0.30340.381071
80.1119321.22620.11127
90.2630472.88150.002345
100.3635993.9835.9e-05
110.4483894.91191e-06
120.2431122.66320.004402
13-0.663829-7.27190
140.2349442.57370.00564
15-0.116427-1.27540.102317
16-0.125399-1.37370.086051
17-0.064481-0.70640.240667
18-0.008819-0.09660.4616
19-0.026631-0.29170.385501
20-0.107425-1.17680.120806
210.0335630.36770.356886
22-0.027966-0.30640.379934
23-0.001524-0.01670.493354
240.0036640.04010.484024
25-0.07369-0.80720.210566
260.0808760.8860.188707
270.0103390.11330.455006
28-0.047893-0.52460.3004
290.026210.28710.387258
30-0.016771-0.18370.427271
31-0.118153-1.29430.099023
32-0.001067-0.01170.495349
33-0.095222-1.04310.149498
340.0052520.05750.477108
35-0.01861-0.20390.419403
36-0.048474-0.5310.298196
37-0.018511-0.20280.419825
38-0.011041-0.12090.451969
39-0.064364-0.70510.241067
40-0.019813-0.2170.414272
41-0.004313-0.04720.481198
42-0.002272-0.02490.490093
43-0.006784-0.07430.470443
440.0016850.01850.492652
450.035720.39130.348138
46-0.038913-0.42630.335339
47-0.037791-0.4140.339814
48-0.002826-0.0310.487678
490.0319810.35030.363351
500.0638140.69910.242936
510.0116250.12730.449441
520.009490.1040.458687
53-0.066211-0.72530.234837
540.0313870.34380.365788
550.0281480.30830.379177
56-0.014878-0.1630.435405
57-0.034172-0.37430.354409
58-0.020819-0.22810.409992
59-0.063292-0.69330.244721
600.0123760.13560.446194

\begin{tabular}{lllllllll}
\hline
Partial Autocorrelation Function \tabularnewline
Time lag k & PACF(k) & T-STAT & P-value \tabularnewline
1 & 0.772683 & 8.4643 & 0 \tabularnewline
2 & -0.474099 & -5.1935 & 0 \tabularnewline
3 & 0.030944 & 0.339 & 0.367611 \tabularnewline
4 & 0.059568 & 0.6525 & 0.257651 \tabularnewline
5 & -0.007024 & -0.0769 & 0.469396 \tabularnewline
6 & -0.082306 & -0.9016 & 0.184534 \tabularnewline
7 & -0.027693 & -0.3034 & 0.381071 \tabularnewline
8 & 0.111932 & 1.2262 & 0.11127 \tabularnewline
9 & 0.263047 & 2.8815 & 0.002345 \tabularnewline
10 & 0.363599 & 3.983 & 5.9e-05 \tabularnewline
11 & 0.448389 & 4.9119 & 1e-06 \tabularnewline
12 & 0.243112 & 2.6632 & 0.004402 \tabularnewline
13 & -0.663829 & -7.2719 & 0 \tabularnewline
14 & 0.234944 & 2.5737 & 0.00564 \tabularnewline
15 & -0.116427 & -1.2754 & 0.102317 \tabularnewline
16 & -0.125399 & -1.3737 & 0.086051 \tabularnewline
17 & -0.064481 & -0.7064 & 0.240667 \tabularnewline
18 & -0.008819 & -0.0966 & 0.4616 \tabularnewline
19 & -0.026631 & -0.2917 & 0.385501 \tabularnewline
20 & -0.107425 & -1.1768 & 0.120806 \tabularnewline
21 & 0.033563 & 0.3677 & 0.356886 \tabularnewline
22 & -0.027966 & -0.3064 & 0.379934 \tabularnewline
23 & -0.001524 & -0.0167 & 0.493354 \tabularnewline
24 & 0.003664 & 0.0401 & 0.484024 \tabularnewline
25 & -0.07369 & -0.8072 & 0.210566 \tabularnewline
26 & 0.080876 & 0.886 & 0.188707 \tabularnewline
27 & 0.010339 & 0.1133 & 0.455006 \tabularnewline
28 & -0.047893 & -0.5246 & 0.3004 \tabularnewline
29 & 0.02621 & 0.2871 & 0.387258 \tabularnewline
30 & -0.016771 & -0.1837 & 0.427271 \tabularnewline
31 & -0.118153 & -1.2943 & 0.099023 \tabularnewline
32 & -0.001067 & -0.0117 & 0.495349 \tabularnewline
33 & -0.095222 & -1.0431 & 0.149498 \tabularnewline
34 & 0.005252 & 0.0575 & 0.477108 \tabularnewline
35 & -0.01861 & -0.2039 & 0.419403 \tabularnewline
36 & -0.048474 & -0.531 & 0.298196 \tabularnewline
37 & -0.018511 & -0.2028 & 0.419825 \tabularnewline
38 & -0.011041 & -0.1209 & 0.451969 \tabularnewline
39 & -0.064364 & -0.7051 & 0.241067 \tabularnewline
40 & -0.019813 & -0.217 & 0.414272 \tabularnewline
41 & -0.004313 & -0.0472 & 0.481198 \tabularnewline
42 & -0.002272 & -0.0249 & 0.490093 \tabularnewline
43 & -0.006784 & -0.0743 & 0.470443 \tabularnewline
44 & 0.001685 & 0.0185 & 0.492652 \tabularnewline
45 & 0.03572 & 0.3913 & 0.348138 \tabularnewline
46 & -0.038913 & -0.4263 & 0.335339 \tabularnewline
47 & -0.037791 & -0.414 & 0.339814 \tabularnewline
48 & -0.002826 & -0.031 & 0.487678 \tabularnewline
49 & 0.031981 & 0.3503 & 0.363351 \tabularnewline
50 & 0.063814 & 0.6991 & 0.242936 \tabularnewline
51 & 0.011625 & 0.1273 & 0.449441 \tabularnewline
52 & 0.00949 & 0.104 & 0.458687 \tabularnewline
53 & -0.066211 & -0.7253 & 0.234837 \tabularnewline
54 & 0.031387 & 0.3438 & 0.365788 \tabularnewline
55 & 0.028148 & 0.3083 & 0.379177 \tabularnewline
56 & -0.014878 & -0.163 & 0.435405 \tabularnewline
57 & -0.034172 & -0.3743 & 0.354409 \tabularnewline
58 & -0.020819 & -0.2281 & 0.409992 \tabularnewline
59 & -0.063292 & -0.6933 & 0.244721 \tabularnewline
60 & 0.012376 & 0.1356 & 0.446194 \tabularnewline
\hline
\end{tabular}
%Source: https://freestatistics.org/blog/index.php?pk=34800&T=2

[TABLE]
[ROW][C]Partial Autocorrelation Function[/C][/ROW]
[ROW][C]Time lag k[/C][C]PACF(k)[/C][C]T-STAT[/C][C]P-value[/C][/ROW]
[ROW][C]1[/C][C]0.772683[/C][C]8.4643[/C][C]0[/C][/ROW]
[ROW][C]2[/C][C]-0.474099[/C][C]-5.1935[/C][C]0[/C][/ROW]
[ROW][C]3[/C][C]0.030944[/C][C]0.339[/C][C]0.367611[/C][/ROW]
[ROW][C]4[/C][C]0.059568[/C][C]0.6525[/C][C]0.257651[/C][/ROW]
[ROW][C]5[/C][C]-0.007024[/C][C]-0.0769[/C][C]0.469396[/C][/ROW]
[ROW][C]6[/C][C]-0.082306[/C][C]-0.9016[/C][C]0.184534[/C][/ROW]
[ROW][C]7[/C][C]-0.027693[/C][C]-0.3034[/C][C]0.381071[/C][/ROW]
[ROW][C]8[/C][C]0.111932[/C][C]1.2262[/C][C]0.11127[/C][/ROW]
[ROW][C]9[/C][C]0.263047[/C][C]2.8815[/C][C]0.002345[/C][/ROW]
[ROW][C]10[/C][C]0.363599[/C][C]3.983[/C][C]5.9e-05[/C][/ROW]
[ROW][C]11[/C][C]0.448389[/C][C]4.9119[/C][C]1e-06[/C][/ROW]
[ROW][C]12[/C][C]0.243112[/C][C]2.6632[/C][C]0.004402[/C][/ROW]
[ROW][C]13[/C][C]-0.663829[/C][C]-7.2719[/C][C]0[/C][/ROW]
[ROW][C]14[/C][C]0.234944[/C][C]2.5737[/C][C]0.00564[/C][/ROW]
[ROW][C]15[/C][C]-0.116427[/C][C]-1.2754[/C][C]0.102317[/C][/ROW]
[ROW][C]16[/C][C]-0.125399[/C][C]-1.3737[/C][C]0.086051[/C][/ROW]
[ROW][C]17[/C][C]-0.064481[/C][C]-0.7064[/C][C]0.240667[/C][/ROW]
[ROW][C]18[/C][C]-0.008819[/C][C]-0.0966[/C][C]0.4616[/C][/ROW]
[ROW][C]19[/C][C]-0.026631[/C][C]-0.2917[/C][C]0.385501[/C][/ROW]
[ROW][C]20[/C][C]-0.107425[/C][C]-1.1768[/C][C]0.120806[/C][/ROW]
[ROW][C]21[/C][C]0.033563[/C][C]0.3677[/C][C]0.356886[/C][/ROW]
[ROW][C]22[/C][C]-0.027966[/C][C]-0.3064[/C][C]0.379934[/C][/ROW]
[ROW][C]23[/C][C]-0.001524[/C][C]-0.0167[/C][C]0.493354[/C][/ROW]
[ROW][C]24[/C][C]0.003664[/C][C]0.0401[/C][C]0.484024[/C][/ROW]
[ROW][C]25[/C][C]-0.07369[/C][C]-0.8072[/C][C]0.210566[/C][/ROW]
[ROW][C]26[/C][C]0.080876[/C][C]0.886[/C][C]0.188707[/C][/ROW]
[ROW][C]27[/C][C]0.010339[/C][C]0.1133[/C][C]0.455006[/C][/ROW]
[ROW][C]28[/C][C]-0.047893[/C][C]-0.5246[/C][C]0.3004[/C][/ROW]
[ROW][C]29[/C][C]0.02621[/C][C]0.2871[/C][C]0.387258[/C][/ROW]
[ROW][C]30[/C][C]-0.016771[/C][C]-0.1837[/C][C]0.427271[/C][/ROW]
[ROW][C]31[/C][C]-0.118153[/C][C]-1.2943[/C][C]0.099023[/C][/ROW]
[ROW][C]32[/C][C]-0.001067[/C][C]-0.0117[/C][C]0.495349[/C][/ROW]
[ROW][C]33[/C][C]-0.095222[/C][C]-1.0431[/C][C]0.149498[/C][/ROW]
[ROW][C]34[/C][C]0.005252[/C][C]0.0575[/C][C]0.477108[/C][/ROW]
[ROW][C]35[/C][C]-0.01861[/C][C]-0.2039[/C][C]0.419403[/C][/ROW]
[ROW][C]36[/C][C]-0.048474[/C][C]-0.531[/C][C]0.298196[/C][/ROW]
[ROW][C]37[/C][C]-0.018511[/C][C]-0.2028[/C][C]0.419825[/C][/ROW]
[ROW][C]38[/C][C]-0.011041[/C][C]-0.1209[/C][C]0.451969[/C][/ROW]
[ROW][C]39[/C][C]-0.064364[/C][C]-0.7051[/C][C]0.241067[/C][/ROW]
[ROW][C]40[/C][C]-0.019813[/C][C]-0.217[/C][C]0.414272[/C][/ROW]
[ROW][C]41[/C][C]-0.004313[/C][C]-0.0472[/C][C]0.481198[/C][/ROW]
[ROW][C]42[/C][C]-0.002272[/C][C]-0.0249[/C][C]0.490093[/C][/ROW]
[ROW][C]43[/C][C]-0.006784[/C][C]-0.0743[/C][C]0.470443[/C][/ROW]
[ROW][C]44[/C][C]0.001685[/C][C]0.0185[/C][C]0.492652[/C][/ROW]
[ROW][C]45[/C][C]0.03572[/C][C]0.3913[/C][C]0.348138[/C][/ROW]
[ROW][C]46[/C][C]-0.038913[/C][C]-0.4263[/C][C]0.335339[/C][/ROW]
[ROW][C]47[/C][C]-0.037791[/C][C]-0.414[/C][C]0.339814[/C][/ROW]
[ROW][C]48[/C][C]-0.002826[/C][C]-0.031[/C][C]0.487678[/C][/ROW]
[ROW][C]49[/C][C]0.031981[/C][C]0.3503[/C][C]0.363351[/C][/ROW]
[ROW][C]50[/C][C]0.063814[/C][C]0.6991[/C][C]0.242936[/C][/ROW]
[ROW][C]51[/C][C]0.011625[/C][C]0.1273[/C][C]0.449441[/C][/ROW]
[ROW][C]52[/C][C]0.00949[/C][C]0.104[/C][C]0.458687[/C][/ROW]
[ROW][C]53[/C][C]-0.066211[/C][C]-0.7253[/C][C]0.234837[/C][/ROW]
[ROW][C]54[/C][C]0.031387[/C][C]0.3438[/C][C]0.365788[/C][/ROW]
[ROW][C]55[/C][C]0.028148[/C][C]0.3083[/C][C]0.379177[/C][/ROW]
[ROW][C]56[/C][C]-0.014878[/C][C]-0.163[/C][C]0.435405[/C][/ROW]
[ROW][C]57[/C][C]-0.034172[/C][C]-0.3743[/C][C]0.354409[/C][/ROW]
[ROW][C]58[/C][C]-0.020819[/C][C]-0.2281[/C][C]0.409992[/C][/ROW]
[ROW][C]59[/C][C]-0.063292[/C][C]-0.6933[/C][C]0.244721[/C][/ROW]
[ROW][C]60[/C][C]0.012376[/C][C]0.1356[/C][C]0.446194[/C][/ROW]
[/TABLE]
Source: https://freestatistics.org/blog/index.php?pk=34800&T=2

Globally Unique Identifier (entire table): ba.freestatistics.org/blog/index.php?pk=34800&T=2

As an alternative you can also use a QR Code:  

The GUIDs for individual cells are displayed in the table below:

Partial Autocorrelation Function
Time lag kPACF(k)T-STATP-value
10.7726838.46430
2-0.474099-5.19350
30.0309440.3390.367611
40.0595680.65250.257651
5-0.007024-0.07690.469396
6-0.082306-0.90160.184534
7-0.027693-0.30340.381071
80.1119321.22620.11127
90.2630472.88150.002345
100.3635993.9835.9e-05
110.4483894.91191e-06
120.2431122.66320.004402
13-0.663829-7.27190
140.2349442.57370.00564
15-0.116427-1.27540.102317
16-0.125399-1.37370.086051
17-0.064481-0.70640.240667
18-0.008819-0.09660.4616
19-0.026631-0.29170.385501
20-0.107425-1.17680.120806
210.0335630.36770.356886
22-0.027966-0.30640.379934
23-0.001524-0.01670.493354
240.0036640.04010.484024
25-0.07369-0.80720.210566
260.0808760.8860.188707
270.0103390.11330.455006
28-0.047893-0.52460.3004
290.026210.28710.387258
30-0.016771-0.18370.427271
31-0.118153-1.29430.099023
32-0.001067-0.01170.495349
33-0.095222-1.04310.149498
340.0052520.05750.477108
35-0.01861-0.20390.419403
36-0.048474-0.5310.298196
37-0.018511-0.20280.419825
38-0.011041-0.12090.451969
39-0.064364-0.70510.241067
40-0.019813-0.2170.414272
41-0.004313-0.04720.481198
42-0.002272-0.02490.490093
43-0.006784-0.07430.470443
440.0016850.01850.492652
450.035720.39130.348138
46-0.038913-0.42630.335339
47-0.037791-0.4140.339814
48-0.002826-0.0310.487678
490.0319810.35030.363351
500.0638140.69910.242936
510.0116250.12730.449441
520.009490.1040.458687
53-0.066211-0.72530.234837
540.0313870.34380.365788
550.0281480.30830.379177
56-0.014878-0.1630.435405
57-0.034172-0.37430.354409
58-0.020819-0.22810.409992
59-0.063292-0.69330.244721
600.0123760.13560.446194


Parameters (Session):
par1 = 60 ; par2 = 1 ; par3 = 0 ; par4 = 0 ; par5 = 12 ;
Parameters (R input):
par1 = 60 ; par2 = 1 ; par3 = 0 ; par4 = 0 ; par5 = 12 ;
R code (references can be found in the software module):
if (par1 == 'Default') {
par1 = 10*log10(length(x))
} else {
par1 <- as.numeric(par1)
}
par2 <- as.numeric(par2)
par3 <- as.numeric(par3)
par4 <- as.numeric(par4)
par5 <- as.numeric(par5)
if (par2 == 0) {
x <- log(x)
} else {
x <- (x ^ par2 - 1) / par2
}
if (par3 > 0) x <- diff(x,lag=1,difference=par3)
if (par4 > 0) x <- diff(x,lag=par5,difference=par4)
bitmap(file='pic1.png')
racf <- acf(x,par1,main='Autocorrelation',xlab='lags',ylab='ACF')
dev.off()
bitmap(file='pic2.png')
rpacf <- pacf(x,par1,main='Partial Autocorrelation',xlab='lags',ylab='PACF')
dev.off()
(myacf <- c(racf$acf))
(mypacf <- c(rpacf$acf))
lengthx <- length(x)
sqrtn <- sqrt(lengthx)
load(file='createtable')
a<-table.start()
a<-table.row.start(a)
a<-table.element(a,'Autocorrelation Function',4,TRUE)
a<-table.row.end(a)
a<-table.row.start(a)
a<-table.element(a,'Time lag k',header=TRUE)
a<-table.element(a,hyperlink('basics.htm','ACF(k)','click here for more information about the Autocorrelation Function'),header=TRUE)
a<-table.element(a,'T-STAT',header=TRUE)
a<-table.element(a,'P-value',header=TRUE)
a<-table.row.end(a)
for (i in 2:(par1+1)) {
a<-table.row.start(a)
a<-table.element(a,i-1,header=TRUE)
a<-table.element(a,round(myacf[i],6))
mytstat <- myacf[i]*sqrtn
a<-table.element(a,round(mytstat,4))
a<-table.element(a,round(1-pt(abs(mytstat),lengthx),6))
a<-table.row.end(a)
}
a<-table.end(a)
table.save(a,file='mytable.tab')
a<-table.start()
a<-table.row.start(a)
a<-table.element(a,'Partial Autocorrelation Function',4,TRUE)
a<-table.row.end(a)
a<-table.row.start(a)
a<-table.element(a,'Time lag k',header=TRUE)
a<-table.element(a,hyperlink('basics.htm','PACF(k)','click here for more information about the Partial Autocorrelation Function'),header=TRUE)
a<-table.element(a,'T-STAT',header=TRUE)
a<-table.element(a,'P-value',header=TRUE)
a<-table.row.end(a)
for (i in 1:par1) {
a<-table.row.start(a)
a<-table.element(a,i,header=TRUE)
a<-table.element(a,round(mypacf[i],6))
mytstat <- mypacf[i]*sqrtn
a<-table.element(a,round(mytstat,4))
a<-table.element(a,round(1-pt(abs(mytstat),lengthx),6))
a<-table.row.end(a)
}
a<-table.end(a)
table.save(a,file='mytable1.tab')