Free Statistics

of Irreproducible Research!

Author's title

Author*The author of this computation has been verified*
R Software Modulerwasp_cross.wasp
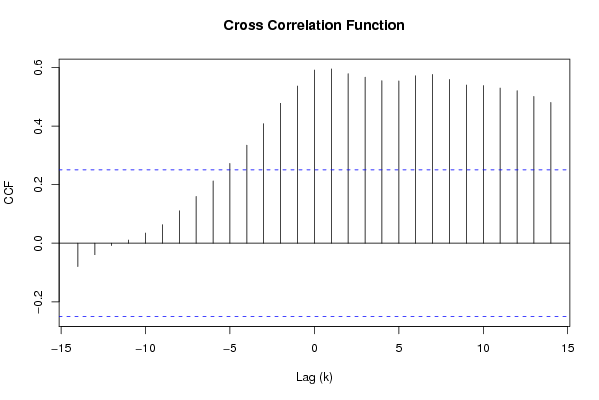
Title produced by softwareCross Correlation Function
Date of computationThu, 18 Dec 2008 07:27:26 -0700
Cite this page as followsStatistical Computations at FreeStatistics.org, Office for Research Development and Education, URL https://freestatistics.org/blog/index.php?v=date/2008/Dec/18/t12296105006wwhpho0lmhrbfw.htm/, Retrieved Sun, 12 May 2024 05:41:03 +0000
Statistical Computations at FreeStatistics.org, Office for Research Development and Education, URL https://freestatistics.org/blog/index.php?pk=34795, Retrieved Sun, 12 May 2024 05:41:03 +0000
QR Codes:

Original text written by user:
IsPrivate?No (this computation is public)
User-defined keywords
Estimated Impact197
Family? (F = Feedback message, R = changed R code, M = changed R Module, P = changed Parameters, D = changed Data)
-       [Cross Correlation Function] [brandstof (x) aut...] [2008-12-18 14:27:26] [9e8e8f1cf6738240aaa61f66e2e3fd45] [Current]
Feedback Forum

Post a new message
Dataseries X:
124
118.63
121.86
119.97
125.03
130.09
126.65
121.7
119.24
122.63
116.66
114.12
113.11
112.61
113.4
115.18
121.01
119.44
116.68
117.07
117.41
119.58
120.92
117.09
116.77
119.39
122.49
124.08
118.29
112.94
113.79
114.43
118.7
120.36
118.27
118.34
117.82
117.65
118.18
121.02
124.78
131.16
130.14
131.75
134.73
135.35
140.32
136.35
131.6
128.9
133.89
138.25
146.23
144.76
149.3
156.8
159.08
165.12
163.14
153.43
151.01
Dataseries Y:
104.89
105.15
105.24
105.57
105.62
106.17
106.27
106.41
106.94
107.16
107.32
107.32
107.35
107.55
107.87
108.37
108.38
107.92
108.03
108.14
108.3
108.64
108.66
109.04
109.03
109.03
109.54
109.75
109.83
109.65
109.82
109.95
110.12
110.15
110.21
109.99
110.14
110.14
110.81
110.97
110.99
109.73
109.81
110.02
110.18
110.21
110.25
110.36
110.51
110.6
110.95
111.18
111.19
111.69
111.7
111.83
111.77
111.73
112.01
111.86
112.04


Summary of computational transaction
Raw Inputview raw input (R code)
Raw Outputview raw output of R engine
Computing time1 seconds
R Server'Gwilym Jenkins' @ 72.249.127.135

\begin{tabular}{lllllllll}
\hline
Summary of computational transaction \tabularnewline
Raw Input & view raw input (R code)  \tabularnewline
Raw Output & view raw output of R engine  \tabularnewline
Computing time & 1 seconds \tabularnewline
R Server & 'Gwilym Jenkins' @ 72.249.127.135 \tabularnewline
\hline
\end{tabular}
%Source: https://freestatistics.org/blog/index.php?pk=34795&T=0

[TABLE]
[ROW][C]Summary of computational transaction[/C][/ROW]
[ROW][C]Raw Input[/C][C]view raw input (R code) [/C][/ROW]
[ROW][C]Raw Output[/C][C]view raw output of R engine [/C][/ROW]
[ROW][C]Computing time[/C][C]1 seconds[/C][/ROW]
[ROW][C]R Server[/C][C]'Gwilym Jenkins' @ 72.249.127.135[/C][/ROW]
[/TABLE]
Source: https://freestatistics.org/blog/index.php?pk=34795&T=0

Globally Unique Identifier (entire table): ba.freestatistics.org/blog/index.php?pk=34795&T=0

As an alternative you can also use a QR Code:  

The GUIDs for individual cells are displayed in the table below:

Summary of computational transaction
Raw Inputview raw input (R code)
Raw Outputview raw output of R engine
Computing time1 seconds
R Server'Gwilym Jenkins' @ 72.249.127.135


Cross Correlation Function
ParameterValue
Box-Cox transformation parameter (lambda) of X series1
Degree of non-seasonal differencing (d) of X series0
Degree of seasonal differencing (D) of X series0
Seasonal Period (s)1
Box-Cox transformation parameter (lambda) of Y series1
Degree of non-seasonal differencing (d) of Y series0
Degree of seasonal differencing (D) of Y series0
krho(Y[t],X[t+k])
-14-0.0795541809697274
-13-0.0392097697186443
-12-0.00791729085854474
-110.0106192356116195
-100.0347252299494875
-90.063464935762709
-80.1107310284882
-70.160097694794520
-60.213093353951738
-50.272619117178015
-40.334965812578964
-30.408668860373115
-20.478279317685549
-10.537368167243559
00.591692965394287
10.595675625052006
20.579322438097616
30.567574142021261
40.555720018946158
50.554753220454353
60.572337610514257
70.576959195882515
80.560036026688997
90.540635956870213
100.539027431070675
110.5301474754465
120.521401882881178
130.501861450750029
140.481075610693871

\begin{tabular}{lllllllll}
\hline
Cross Correlation Function \tabularnewline
Parameter & Value \tabularnewline
Box-Cox transformation parameter (lambda) of X series & 1 \tabularnewline
Degree of non-seasonal differencing (d) of X series & 0 \tabularnewline
Degree of seasonal differencing (D) of X series & 0 \tabularnewline
Seasonal Period (s) & 1 \tabularnewline
Box-Cox transformation parameter (lambda) of Y series & 1 \tabularnewline
Degree of non-seasonal differencing (d) of Y series & 0 \tabularnewline
Degree of seasonal differencing (D) of Y series & 0 \tabularnewline
k & rho(Y[t],X[t+k]) \tabularnewline
-14 & -0.0795541809697274 \tabularnewline
-13 & -0.0392097697186443 \tabularnewline
-12 & -0.00791729085854474 \tabularnewline
-11 & 0.0106192356116195 \tabularnewline
-10 & 0.0347252299494875 \tabularnewline
-9 & 0.063464935762709 \tabularnewline
-8 & 0.1107310284882 \tabularnewline
-7 & 0.160097694794520 \tabularnewline
-6 & 0.213093353951738 \tabularnewline
-5 & 0.272619117178015 \tabularnewline
-4 & 0.334965812578964 \tabularnewline
-3 & 0.408668860373115 \tabularnewline
-2 & 0.478279317685549 \tabularnewline
-1 & 0.537368167243559 \tabularnewline
0 & 0.591692965394287 \tabularnewline
1 & 0.595675625052006 \tabularnewline
2 & 0.579322438097616 \tabularnewline
3 & 0.567574142021261 \tabularnewline
4 & 0.555720018946158 \tabularnewline
5 & 0.554753220454353 \tabularnewline
6 & 0.572337610514257 \tabularnewline
7 & 0.576959195882515 \tabularnewline
8 & 0.560036026688997 \tabularnewline
9 & 0.540635956870213 \tabularnewline
10 & 0.539027431070675 \tabularnewline
11 & 0.5301474754465 \tabularnewline
12 & 0.521401882881178 \tabularnewline
13 & 0.501861450750029 \tabularnewline
14 & 0.481075610693871 \tabularnewline
\hline
\end{tabular}
%Source: https://freestatistics.org/blog/index.php?pk=34795&T=1

[TABLE]
[ROW][C]Cross Correlation Function[/C][/ROW]
[ROW][C]Parameter[/C][C]Value[/C][/ROW]
[ROW][C]Box-Cox transformation parameter (lambda) of X series[/C][C]1[/C][/ROW]
[ROW][C]Degree of non-seasonal differencing (d) of X series[/C][C]0[/C][/ROW]
[ROW][C]Degree of seasonal differencing (D) of X series[/C][C]0[/C][/ROW]
[ROW][C]Seasonal Period (s)[/C][C]1[/C][/ROW]
[ROW][C]Box-Cox transformation parameter (lambda) of Y series[/C][C]1[/C][/ROW]
[ROW][C]Degree of non-seasonal differencing (d) of Y series[/C][C]0[/C][/ROW]
[ROW][C]Degree of seasonal differencing (D) of Y series[/C][C]0[/C][/ROW]
[ROW][C]k[/C][C]rho(Y[t],X[t+k])[/C][/ROW]
[ROW][C]-14[/C][C]-0.0795541809697274[/C][/ROW]
[ROW][C]-13[/C][C]-0.0392097697186443[/C][/ROW]
[ROW][C]-12[/C][C]-0.00791729085854474[/C][/ROW]
[ROW][C]-11[/C][C]0.0106192356116195[/C][/ROW]
[ROW][C]-10[/C][C]0.0347252299494875[/C][/ROW]
[ROW][C]-9[/C][C]0.063464935762709[/C][/ROW]
[ROW][C]-8[/C][C]0.1107310284882[/C][/ROW]
[ROW][C]-7[/C][C]0.160097694794520[/C][/ROW]
[ROW][C]-6[/C][C]0.213093353951738[/C][/ROW]
[ROW][C]-5[/C][C]0.272619117178015[/C][/ROW]
[ROW][C]-4[/C][C]0.334965812578964[/C][/ROW]
[ROW][C]-3[/C][C]0.408668860373115[/C][/ROW]
[ROW][C]-2[/C][C]0.478279317685549[/C][/ROW]
[ROW][C]-1[/C][C]0.537368167243559[/C][/ROW]
[ROW][C]0[/C][C]0.591692965394287[/C][/ROW]
[ROW][C]1[/C][C]0.595675625052006[/C][/ROW]
[ROW][C]2[/C][C]0.579322438097616[/C][/ROW]
[ROW][C]3[/C][C]0.567574142021261[/C][/ROW]
[ROW][C]4[/C][C]0.555720018946158[/C][/ROW]
[ROW][C]5[/C][C]0.554753220454353[/C][/ROW]
[ROW][C]6[/C][C]0.572337610514257[/C][/ROW]
[ROW][C]7[/C][C]0.576959195882515[/C][/ROW]
[ROW][C]8[/C][C]0.560036026688997[/C][/ROW]
[ROW][C]9[/C][C]0.540635956870213[/C][/ROW]
[ROW][C]10[/C][C]0.539027431070675[/C][/ROW]
[ROW][C]11[/C][C]0.5301474754465[/C][/ROW]
[ROW][C]12[/C][C]0.521401882881178[/C][/ROW]
[ROW][C]13[/C][C]0.501861450750029[/C][/ROW]
[ROW][C]14[/C][C]0.481075610693871[/C][/ROW]
[/TABLE]
Source: https://freestatistics.org/blog/index.php?pk=34795&T=1

Globally Unique Identifier (entire table): ba.freestatistics.org/blog/index.php?pk=34795&T=1

As an alternative you can also use a QR Code:  

The GUIDs for individual cells are displayed in the table below:

Cross Correlation Function
ParameterValue
Box-Cox transformation parameter (lambda) of X series1
Degree of non-seasonal differencing (d) of X series0
Degree of seasonal differencing (D) of X series0
Seasonal Period (s)1
Box-Cox transformation parameter (lambda) of Y series1
Degree of non-seasonal differencing (d) of Y series0
Degree of seasonal differencing (D) of Y series0
krho(Y[t],X[t+k])
-14-0.0795541809697274
-13-0.0392097697186443
-12-0.00791729085854474
-110.0106192356116195
-100.0347252299494875
-90.063464935762709
-80.1107310284882
-70.160097694794520
-60.213093353951738
-50.272619117178015
-40.334965812578964
-30.408668860373115
-20.478279317685549
-10.537368167243559
00.591692965394287
10.595675625052006
20.579322438097616
30.567574142021261
40.555720018946158
50.554753220454353
60.572337610514257
70.576959195882515
80.560036026688997
90.540635956870213
100.539027431070675
110.5301474754465
120.521401882881178
130.501861450750029
140.481075610693871


Parameters (Session):
par1 = 1 ; par2 = 0 ; par3 = 0 ; par4 = 1 ; par5 = 1 ; par6 = 0 ; par7 = 0 ;
Parameters (R input):
par1 = 1 ; par2 = 0 ; par3 = 0 ; par4 = 1 ; par5 = 1 ; par6 = 0 ; par7 = 0 ;
R code (references can be found in the software module):
par1 <- as.numeric(par1)
par2 <- as.numeric(par2)
par3 <- as.numeric(par3)
par4 <- as.numeric(par4)
par5 <- as.numeric(par5)
par6 <- as.numeric(par6)
par7 <- as.numeric(par7)
if (par1 == 0) {
x <- log(x)
} else {
x <- (x ^ par1 - 1) / par1
}
if (par5 == 0) {
y <- log(y)
} else {
y <- (y ^ par5 - 1) / par5
}
if (par2 > 0) x <- diff(x,lag=1,difference=par2)
if (par6 > 0) y <- diff(y,lag=1,difference=par6)
if (par3 > 0) x <- diff(x,lag=par4,difference=par3)
if (par7 > 0) y <- diff(y,lag=par4,difference=par7)
x
y
bitmap(file='test1.png')
(r <- ccf(x,y,main='Cross Correlation Function',ylab='CCF',xlab='Lag (k)'))
dev.off()
load(file='createtable')
a<-table.start()
a<-table.row.start(a)
a<-table.element(a,'Cross Correlation Function',2,TRUE)
a<-table.row.end(a)
a<-table.row.start(a)
a<-table.element(a,'Parameter',header=TRUE)
a<-table.element(a,'Value',header=TRUE)
a<-table.row.end(a)
a<-table.row.start(a)
a<-table.element(a,'Box-Cox transformation parameter (lambda) of X series',header=TRUE)
a<-table.element(a,par1)
a<-table.row.end(a)
a<-table.row.start(a)
a<-table.element(a,'Degree of non-seasonal differencing (d) of X series',header=TRUE)
a<-table.element(a,par2)
a<-table.row.end(a)
a<-table.row.start(a)
a<-table.element(a,'Degree of seasonal differencing (D) of X series',header=TRUE)
a<-table.element(a,par3)
a<-table.row.end(a)
a<-table.row.start(a)
a<-table.element(a,'Seasonal Period (s)',header=TRUE)
a<-table.element(a,par4)
a<-table.row.end(a)
a<-table.row.start(a)
a<-table.element(a,'Box-Cox transformation parameter (lambda) of Y series',header=TRUE)
a<-table.element(a,par5)
a<-table.row.end(a)
a<-table.row.start(a)
a<-table.element(a,'Degree of non-seasonal differencing (d) of Y series',header=TRUE)
a<-table.element(a,par6)
a<-table.row.end(a)
a<-table.row.start(a)
a<-table.element(a,'Degree of seasonal differencing (D) of Y series',header=TRUE)
a<-table.element(a,par7)
a<-table.row.end(a)
a<-table.row.start(a)
a<-table.element(a,'k',header=TRUE)
a<-table.element(a,'rho(Y[t],X[t+k])',header=TRUE)
a<-table.row.end(a)
mylength <- length(r$acf)
myhalf <- floor((mylength-1)/2)
for (i in 1:mylength) {
a<-table.row.start(a)
a<-table.element(a,i-myhalf-1,header=TRUE)
a<-table.element(a,r$acf[i])
a<-table.row.end(a)
}
a<-table.end(a)
table.save(a,file='mytable.tab')