Free Statistics
of Irreproducible Research!
Description of Statistical Computation | |||||||||||||||||||||||||||||||||||||||||
|---|---|---|---|---|---|---|---|---|---|---|---|---|---|---|---|---|---|---|---|---|---|---|---|---|---|---|---|---|---|---|---|---|---|---|---|---|---|---|---|---|---|
| Author's title | |||||||||||||||||||||||||||||||||||||||||
| Author | *The author of this computation has been verified* | ||||||||||||||||||||||||||||||||||||||||
| R Software Module | rwasp_univariatedataseries.wasp | ||||||||||||||||||||||||||||||||||||||||
| Title produced by software | Univariate Data Series | ||||||||||||||||||||||||||||||||||||||||
| Date of computation | Thu, 18 Dec 2008 06:38:46 -0700 | ||||||||||||||||||||||||||||||||||||||||
| Cite this page as follows | Statistical Computations at FreeStatistics.org, Office for Research Development and Education, URL https://freestatistics.org/blog/index.php?v=date/2008/Dec/18/t1229607556ulnhefwrrdakgp9.htm/, Retrieved Sun, 12 May 2024 08:33:11 +0000 | ||||||||||||||||||||||||||||||||||||||||
| Statistical Computations at FreeStatistics.org, Office for Research Development and Education, URL https://freestatistics.org/blog/index.php?pk=34752, Retrieved Sun, 12 May 2024 08:33:11 +0000 | |||||||||||||||||||||||||||||||||||||||||
| QR Codes: | |||||||||||||||||||||||||||||||||||||||||
|
| |||||||||||||||||||||||||||||||||||||||||
| Original text written by user: | |||||||||||||||||||||||||||||||||||||||||
| IsPrivate? | No (this computation is public) | ||||||||||||||||||||||||||||||||||||||||
| User-defined keywords | |||||||||||||||||||||||||||||||||||||||||
| Estimated Impact | 165 | ||||||||||||||||||||||||||||||||||||||||
Tree of Dependent Computations | |||||||||||||||||||||||||||||||||||||||||
| Family? (F = Feedback message, R = changed R code, M = changed R Module, P = changed Parameters, D = changed Data) | |||||||||||||||||||||||||||||||||||||||||
| - [Univariate Data Series] [Prijsevolutie Sig...] [2008-10-13 21:02:42] [cf45c678b7899ee33d7b061948f80651] - PD [Univariate Data Series] [Prijsevolutie Sig...] [2008-10-19 14:36:01] [cf45c678b7899ee33d7b061948f80651] F PD [Univariate Data Series] [Evolutie Dieselpr...] [2008-10-20 21:47:04] [e3bad6a1a79f69c694d9924270290d49] - PD [Univariate Data Series] [Paper - Univariat...] [2008-12-18 13:38:46] [07b7cf1321bc38017c2c7efcf91ca696] [Current] | |||||||||||||||||||||||||||||||||||||||||
| Feedback Forum | |||||||||||||||||||||||||||||||||||||||||
Post a new message | |||||||||||||||||||||||||||||||||||||||||
Dataset | |||||||||||||||||||||||||||||||||||||||||
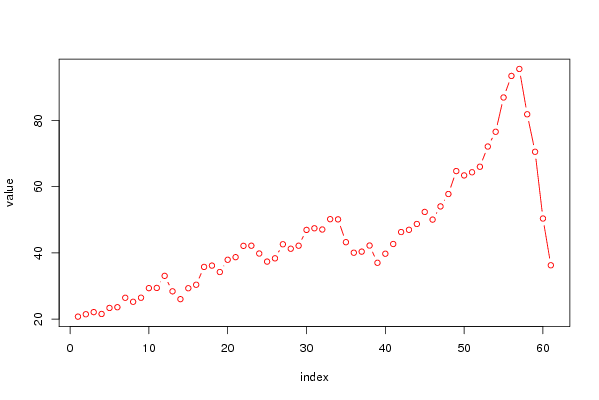
| Dataseries X: | |||||||||||||||||||||||||||||||||||||||||
20,72 21,45 22,09 21,53 23,35 23,57 26,42 25,21 26,44 29,34 29,40 33,05 28,38 26,01 29,31 30,36 35,75 36,15 34,21 37,91 38,70 42,12 42,16 39,80 37,36 38,35 42,60 41,25 42,16 46,94 47,43 47,06 50,18 50,13 43,23 40,04 40,37 42,21 37,00 39,74 42,68 46,29 46,97 48,73 52,37 50,05 54,04 57,78 64,72 63,41 64,36 66,03 72,14 76,60 86,97 93,48 95,59 81,89 70,55 50,38 36,25 | |||||||||||||||||||||||||||||||||||||||||
Tables (Output of Computation) | |||||||||||||||||||||||||||||||||||||||||
| |||||||||||||||||||||||||||||||||||||||||
Figures (Output of Computation) | |||||||||||||||||||||||||||||||||||||||||
Input Parameters & R Code | |||||||||||||||||||||||||||||||||||||||||
| Parameters (Session): | |||||||||||||||||||||||||||||||||||||||||
| Parameters (R input): | |||||||||||||||||||||||||||||||||||||||||
| par1 = Olieprijs �/V ; par2 = Opec-site ; par3 = Olieprijs �/V ; | |||||||||||||||||||||||||||||||||||||||||
| R code (references can be found in the software module): | |||||||||||||||||||||||||||||||||||||||||
bitmap(file='test1.png') | |||||||||||||||||||||||||||||||||||||||||