Free Statistics

of Irreproducible Research!

Author's title

Author*The author of this computation has been verified*
R Software Modulerwasp_arimaforecasting.wasp
Title produced by softwareARIMA Forecasting
Date of computationThu, 18 Dec 2008 06:21:27 -0700
Cite this page as followsStatistical Computations at FreeStatistics.org, Office for Research Development and Education, URL https://freestatistics.org/blog/index.php?v=date/2008/Dec/18/t1229606540fysrzxtl4yhk4h7.htm/, Retrieved Sun, 12 May 2024 06:12:55 +0000
Statistical Computations at FreeStatistics.org, Office for Research Development and Education, URL https://freestatistics.org/blog/index.php?pk=34738, Retrieved Sun, 12 May 2024 06:12:55 +0000
QR Codes:

Original text written by user:
IsPrivate?No (this computation is public)
User-defined keywordsk_vanderheggen
Estimated Impact162
Family? (F = Feedback message, R = changed R code, M = changed R Module, P = changed Parameters, D = changed Data)
F     [(Partial) Autocorrelation Function] [eigen tijdreeks a...] [2008-12-09 17:12:38] [42e82fcd8ee0f4c6e81d502bb09e62b7]
- RMP   [ARIMA Backward Selection] [stap 5] [2008-12-14 14:06:36] [b1bd16d1f47bfe13feacf1c27a0abba5]
F   P     [ARIMA Backward Selection] [Paper Backward se...] [2008-12-16 16:35:26] [1640119c345fbfa2091dc1243f79f7a6]
F RMP       [ARIMA Forecasting] [Paper Forecast] [2008-12-16 18:11:10] [1640119c345fbfa2091dc1243f79f7a6]
-   P           [ARIMA Forecasting] [Paper Forecast] [2008-12-18 13:21:27] [547f3960ab1cda94661cd6e0871d2c7b] [Current]
Feedback Forum

Post a new message
Dataseries X:
5.5
5.3
5.2
5.3
5.3
5
4.8
4.9
5.3
6
6.2
6.4
6.4
6.4
6.2
6.1
6
5.9
6.2
6.2
6.4
6.8
6.9
7
7
6.9
6.7
6.6
6.5
6.4
6.5
6.5
6.6
6.7
6.8
7.2
7.6
7.6
7.3
6.4
6.1
6.3
7.1
7.5
7.4
7.1
6.8
6.9
7.2
7.4
7.3
6.9
6.9
6.8
7.1
7.2
7.1
7
6.9
7
7.4
7.5
7.5
7.4
7.3
7
6.7
6.5
6.5
6.5
6.6
6.8
6.9
6.9
6.8
6.8
6.5
6.1
6
5.9
5.8
5.9
5.9
6.2
6.3
6.2
6
5.8
5.5
5.5
5.7
5.8


Summary of computational transaction
Raw Inputview raw input (R code)
Raw Outputview raw output of R engine
Computing time2 seconds
R Server'George Udny Yule' @ 72.249.76.132

\begin{tabular}{lllllllll}
\hline
Summary of computational transaction \tabularnewline
Raw Input & view raw input (R code)  \tabularnewline
Raw Output & view raw output of R engine  \tabularnewline
Computing time & 2 seconds \tabularnewline
R Server & 'George Udny Yule' @ 72.249.76.132 \tabularnewline
\hline
\end{tabular}
%Source: https://freestatistics.org/blog/index.php?pk=34738&T=0

[TABLE]
[ROW][C]Summary of computational transaction[/C][/ROW]
[ROW][C]Raw Input[/C][C]view raw input (R code) [/C][/ROW]
[ROW][C]Raw Output[/C][C]view raw output of R engine [/C][/ROW]
[ROW][C]Computing time[/C][C]2 seconds[/C][/ROW]
[ROW][C]R Server[/C][C]'George Udny Yule' @ 72.249.76.132[/C][/ROW]
[/TABLE]
Source: https://freestatistics.org/blog/index.php?pk=34738&T=0

Globally Unique Identifier (entire table): ba.freestatistics.org/blog/index.php?pk=34738&T=0

As an alternative you can also use a QR Code:  

The GUIDs for individual cells are displayed in the table below:

Summary of computational transaction
Raw Inputview raw input (R code)
Raw Outputview raw output of R engine
Computing time2 seconds
R Server'George Udny Yule' @ 72.249.76.132


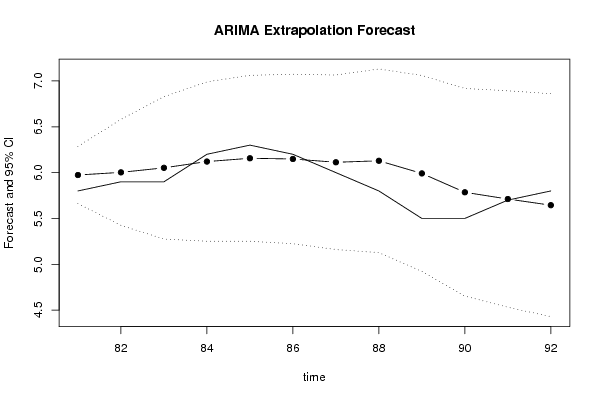
Univariate ARIMA Extrapolation Forecast
timeY[t]F[t]95% LB95% UBp-value(H0: Y[t] = F[t])P(F[t]>Y[t-1])P(F[t]>Y[t-s])P(F[t]>Y[80])
686.5-------
696.5-------
706.5-------
716.6-------
726.8-------
736.9-------
746.9-------
756.8-------
766.8-------
776.5-------
786.1-------
796-------
805.9-------
815.85.97375.66126.28620.13790.67815e-040.6781
825.96.00285.42466.5810.36370.75410.0460.6363
835.96.05215.27536.82880.35060.64940.08340.6494
846.26.12065.25126.990.42890.69050.06280.6905
856.36.15655.25157.06150.3780.46250.05370.7107
866.26.14875.22427.07320.45670.37420.05560.701
8766.11285.16057.0650.40820.42880.07860.6693
885.86.12895.12697.1310.260.59950.09470.6728
895.55.99124.92217.06020.18390.6370.17540.5664
905.55.78534.65246.91810.31080.68920.2930.4213
915.75.71174.53056.89280.49230.63730.31620.3773
925.85.64474.42856.86090.40120.46450.34040.3404

\begin{tabular}{lllllllll}
\hline
Univariate ARIMA Extrapolation Forecast \tabularnewline
time & Y[t] & F[t] & 95% LB & 95% UB & p-value(H0: Y[t] = F[t]) & P(F[t]>Y[t-1]) & P(F[t]>Y[t-s]) & P(F[t]>Y[80]) \tabularnewline
68 & 6.5 & - & - & - & - & - & - & - \tabularnewline
69 & 6.5 & - & - & - & - & - & - & - \tabularnewline
70 & 6.5 & - & - & - & - & - & - & - \tabularnewline
71 & 6.6 & - & - & - & - & - & - & - \tabularnewline
72 & 6.8 & - & - & - & - & - & - & - \tabularnewline
73 & 6.9 & - & - & - & - & - & - & - \tabularnewline
74 & 6.9 & - & - & - & - & - & - & - \tabularnewline
75 & 6.8 & - & - & - & - & - & - & - \tabularnewline
76 & 6.8 & - & - & - & - & - & - & - \tabularnewline
77 & 6.5 & - & - & - & - & - & - & - \tabularnewline
78 & 6.1 & - & - & - & - & - & - & - \tabularnewline
79 & 6 & - & - & - & - & - & - & - \tabularnewline
80 & 5.9 & - & - & - & - & - & - & - \tabularnewline
81 & 5.8 & 5.9737 & 5.6612 & 6.2862 & 0.1379 & 0.6781 & 5e-04 & 0.6781 \tabularnewline
82 & 5.9 & 6.0028 & 5.4246 & 6.581 & 0.3637 & 0.7541 & 0.046 & 0.6363 \tabularnewline
83 & 5.9 & 6.0521 & 5.2753 & 6.8288 & 0.3506 & 0.6494 & 0.0834 & 0.6494 \tabularnewline
84 & 6.2 & 6.1206 & 5.2512 & 6.99 & 0.4289 & 0.6905 & 0.0628 & 0.6905 \tabularnewline
85 & 6.3 & 6.1565 & 5.2515 & 7.0615 & 0.378 & 0.4625 & 0.0537 & 0.7107 \tabularnewline
86 & 6.2 & 6.1487 & 5.2242 & 7.0732 & 0.4567 & 0.3742 & 0.0556 & 0.701 \tabularnewline
87 & 6 & 6.1128 & 5.1605 & 7.065 & 0.4082 & 0.4288 & 0.0786 & 0.6693 \tabularnewline
88 & 5.8 & 6.1289 & 5.1269 & 7.131 & 0.26 & 0.5995 & 0.0947 & 0.6728 \tabularnewline
89 & 5.5 & 5.9912 & 4.9221 & 7.0602 & 0.1839 & 0.637 & 0.1754 & 0.5664 \tabularnewline
90 & 5.5 & 5.7853 & 4.6524 & 6.9181 & 0.3108 & 0.6892 & 0.293 & 0.4213 \tabularnewline
91 & 5.7 & 5.7117 & 4.5305 & 6.8928 & 0.4923 & 0.6373 & 0.3162 & 0.3773 \tabularnewline
92 & 5.8 & 5.6447 & 4.4285 & 6.8609 & 0.4012 & 0.4645 & 0.3404 & 0.3404 \tabularnewline
\hline
\end{tabular}
%Source: https://freestatistics.org/blog/index.php?pk=34738&T=1

[TABLE]
[ROW][C]Univariate ARIMA Extrapolation Forecast[/C][/ROW]
[ROW][C]time[/C][C]Y[t][/C][C]F[t][/C][C]95% LB[/C][C]95% UB[/C][C]p-value(H0: Y[t] = F[t])[/C][C]P(F[t]>Y[t-1])[/C][C]P(F[t]>Y[t-s])[/C][C]P(F[t]>Y[80])[/C][/ROW]
[ROW][C]68[/C][C]6.5[/C][C]-[/C][C]-[/C][C]-[/C][C]-[/C][C]-[/C][C]-[/C][C]-[/C][/ROW]
[ROW][C]69[/C][C]6.5[/C][C]-[/C][C]-[/C][C]-[/C][C]-[/C][C]-[/C][C]-[/C][C]-[/C][/ROW]
[ROW][C]70[/C][C]6.5[/C][C]-[/C][C]-[/C][C]-[/C][C]-[/C][C]-[/C][C]-[/C][C]-[/C][/ROW]
[ROW][C]71[/C][C]6.6[/C][C]-[/C][C]-[/C][C]-[/C][C]-[/C][C]-[/C][C]-[/C][C]-[/C][/ROW]
[ROW][C]72[/C][C]6.8[/C][C]-[/C][C]-[/C][C]-[/C][C]-[/C][C]-[/C][C]-[/C][C]-[/C][/ROW]
[ROW][C]73[/C][C]6.9[/C][C]-[/C][C]-[/C][C]-[/C][C]-[/C][C]-[/C][C]-[/C][C]-[/C][/ROW]
[ROW][C]74[/C][C]6.9[/C][C]-[/C][C]-[/C][C]-[/C][C]-[/C][C]-[/C][C]-[/C][C]-[/C][/ROW]
[ROW][C]75[/C][C]6.8[/C][C]-[/C][C]-[/C][C]-[/C][C]-[/C][C]-[/C][C]-[/C][C]-[/C][/ROW]
[ROW][C]76[/C][C]6.8[/C][C]-[/C][C]-[/C][C]-[/C][C]-[/C][C]-[/C][C]-[/C][C]-[/C][/ROW]
[ROW][C]77[/C][C]6.5[/C][C]-[/C][C]-[/C][C]-[/C][C]-[/C][C]-[/C][C]-[/C][C]-[/C][/ROW]
[ROW][C]78[/C][C]6.1[/C][C]-[/C][C]-[/C][C]-[/C][C]-[/C][C]-[/C][C]-[/C][C]-[/C][/ROW]
[ROW][C]79[/C][C]6[/C][C]-[/C][C]-[/C][C]-[/C][C]-[/C][C]-[/C][C]-[/C][C]-[/C][/ROW]
[ROW][C]80[/C][C]5.9[/C][C]-[/C][C]-[/C][C]-[/C][C]-[/C][C]-[/C][C]-[/C][C]-[/C][/ROW]
[ROW][C]81[/C][C]5.8[/C][C]5.9737[/C][C]5.6612[/C][C]6.2862[/C][C]0.1379[/C][C]0.6781[/C][C]5e-04[/C][C]0.6781[/C][/ROW]
[ROW][C]82[/C][C]5.9[/C][C]6.0028[/C][C]5.4246[/C][C]6.581[/C][C]0.3637[/C][C]0.7541[/C][C]0.046[/C][C]0.6363[/C][/ROW]
[ROW][C]83[/C][C]5.9[/C][C]6.0521[/C][C]5.2753[/C][C]6.8288[/C][C]0.3506[/C][C]0.6494[/C][C]0.0834[/C][C]0.6494[/C][/ROW]
[ROW][C]84[/C][C]6.2[/C][C]6.1206[/C][C]5.2512[/C][C]6.99[/C][C]0.4289[/C][C]0.6905[/C][C]0.0628[/C][C]0.6905[/C][/ROW]
[ROW][C]85[/C][C]6.3[/C][C]6.1565[/C][C]5.2515[/C][C]7.0615[/C][C]0.378[/C][C]0.4625[/C][C]0.0537[/C][C]0.7107[/C][/ROW]
[ROW][C]86[/C][C]6.2[/C][C]6.1487[/C][C]5.2242[/C][C]7.0732[/C][C]0.4567[/C][C]0.3742[/C][C]0.0556[/C][C]0.701[/C][/ROW]
[ROW][C]87[/C][C]6[/C][C]6.1128[/C][C]5.1605[/C][C]7.065[/C][C]0.4082[/C][C]0.4288[/C][C]0.0786[/C][C]0.6693[/C][/ROW]
[ROW][C]88[/C][C]5.8[/C][C]6.1289[/C][C]5.1269[/C][C]7.131[/C][C]0.26[/C][C]0.5995[/C][C]0.0947[/C][C]0.6728[/C][/ROW]
[ROW][C]89[/C][C]5.5[/C][C]5.9912[/C][C]4.9221[/C][C]7.0602[/C][C]0.1839[/C][C]0.637[/C][C]0.1754[/C][C]0.5664[/C][/ROW]
[ROW][C]90[/C][C]5.5[/C][C]5.7853[/C][C]4.6524[/C][C]6.9181[/C][C]0.3108[/C][C]0.6892[/C][C]0.293[/C][C]0.4213[/C][/ROW]
[ROW][C]91[/C][C]5.7[/C][C]5.7117[/C][C]4.5305[/C][C]6.8928[/C][C]0.4923[/C][C]0.6373[/C][C]0.3162[/C][C]0.3773[/C][/ROW]
[ROW][C]92[/C][C]5.8[/C][C]5.6447[/C][C]4.4285[/C][C]6.8609[/C][C]0.4012[/C][C]0.4645[/C][C]0.3404[/C][C]0.3404[/C][/ROW]
[/TABLE]
Source: https://freestatistics.org/blog/index.php?pk=34738&T=1

Globally Unique Identifier (entire table): ba.freestatistics.org/blog/index.php?pk=34738&T=1

As an alternative you can also use a QR Code:  

The GUIDs for individual cells are displayed in the table below:

Univariate ARIMA Extrapolation Forecast
timeY[t]F[t]95% LB95% UBp-value(H0: Y[t] = F[t])P(F[t]>Y[t-1])P(F[t]>Y[t-s])P(F[t]>Y[80])
686.5-------
696.5-------
706.5-------
716.6-------
726.8-------
736.9-------
746.9-------
756.8-------
766.8-------
776.5-------
786.1-------
796-------
805.9-------
815.85.97375.66126.28620.13790.67815e-040.6781
825.96.00285.42466.5810.36370.75410.0460.6363
835.96.05215.27536.82880.35060.64940.08340.6494
846.26.12065.25126.990.42890.69050.06280.6905
856.36.15655.25157.06150.3780.46250.05370.7107
866.26.14875.22427.07320.45670.37420.05560.701
8766.11285.16057.0650.40820.42880.07860.6693
885.86.12895.12697.1310.260.59950.09470.6728
895.55.99124.92217.06020.18390.6370.17540.5664
905.55.78534.65246.91810.31080.68920.2930.4213
915.75.71174.53056.89280.49230.63730.31620.3773
925.85.64474.42856.86090.40120.46450.34040.3404


Univariate ARIMA Extrapolation Forecast Performance
time% S.E.PEMAPESq.EMSERMSE
810.0267-0.02910.00240.03020.00250.0502
820.0491-0.01710.00140.01069e-040.0297
830.0655-0.02510.00210.02310.00190.0439
840.07250.0130.00110.00635e-040.0229
850.0750.02330.00190.02060.00170.0414
860.07670.00837e-040.00262e-040.0148
870.0795-0.01850.00150.01270.00110.0326
880.0834-0.05370.00450.10820.0090.0949
890.091-0.0820.00680.24120.02010.1418
900.0999-0.04930.00410.08140.00680.0824
910.1055-0.0022e-041e-0400.0034
920.10990.02750.00230.02410.0020.0448

\begin{tabular}{lllllllll}
\hline
Univariate ARIMA Extrapolation Forecast Performance \tabularnewline
time & % S.E. & PE & MAPE & Sq.E & MSE & RMSE \tabularnewline
81 & 0.0267 & -0.0291 & 0.0024 & 0.0302 & 0.0025 & 0.0502 \tabularnewline
82 & 0.0491 & -0.0171 & 0.0014 & 0.0106 & 9e-04 & 0.0297 \tabularnewline
83 & 0.0655 & -0.0251 & 0.0021 & 0.0231 & 0.0019 & 0.0439 \tabularnewline
84 & 0.0725 & 0.013 & 0.0011 & 0.0063 & 5e-04 & 0.0229 \tabularnewline
85 & 0.075 & 0.0233 & 0.0019 & 0.0206 & 0.0017 & 0.0414 \tabularnewline
86 & 0.0767 & 0.0083 & 7e-04 & 0.0026 & 2e-04 & 0.0148 \tabularnewline
87 & 0.0795 & -0.0185 & 0.0015 & 0.0127 & 0.0011 & 0.0326 \tabularnewline
88 & 0.0834 & -0.0537 & 0.0045 & 0.1082 & 0.009 & 0.0949 \tabularnewline
89 & 0.091 & -0.082 & 0.0068 & 0.2412 & 0.0201 & 0.1418 \tabularnewline
90 & 0.0999 & -0.0493 & 0.0041 & 0.0814 & 0.0068 & 0.0824 \tabularnewline
91 & 0.1055 & -0.002 & 2e-04 & 1e-04 & 0 & 0.0034 \tabularnewline
92 & 0.1099 & 0.0275 & 0.0023 & 0.0241 & 0.002 & 0.0448 \tabularnewline
\hline
\end{tabular}
%Source: https://freestatistics.org/blog/index.php?pk=34738&T=2

[TABLE]
[ROW][C]Univariate ARIMA Extrapolation Forecast Performance[/C][/ROW]
[ROW][C]time[/C][C]% S.E.[/C][C]PE[/C][C]MAPE[/C][C]Sq.E[/C][C]MSE[/C][C]RMSE[/C][/ROW]
[ROW][C]81[/C][C]0.0267[/C][C]-0.0291[/C][C]0.0024[/C][C]0.0302[/C][C]0.0025[/C][C]0.0502[/C][/ROW]
[ROW][C]82[/C][C]0.0491[/C][C]-0.0171[/C][C]0.0014[/C][C]0.0106[/C][C]9e-04[/C][C]0.0297[/C][/ROW]
[ROW][C]83[/C][C]0.0655[/C][C]-0.0251[/C][C]0.0021[/C][C]0.0231[/C][C]0.0019[/C][C]0.0439[/C][/ROW]
[ROW][C]84[/C][C]0.0725[/C][C]0.013[/C][C]0.0011[/C][C]0.0063[/C][C]5e-04[/C][C]0.0229[/C][/ROW]
[ROW][C]85[/C][C]0.075[/C][C]0.0233[/C][C]0.0019[/C][C]0.0206[/C][C]0.0017[/C][C]0.0414[/C][/ROW]
[ROW][C]86[/C][C]0.0767[/C][C]0.0083[/C][C]7e-04[/C][C]0.0026[/C][C]2e-04[/C][C]0.0148[/C][/ROW]
[ROW][C]87[/C][C]0.0795[/C][C]-0.0185[/C][C]0.0015[/C][C]0.0127[/C][C]0.0011[/C][C]0.0326[/C][/ROW]
[ROW][C]88[/C][C]0.0834[/C][C]-0.0537[/C][C]0.0045[/C][C]0.1082[/C][C]0.009[/C][C]0.0949[/C][/ROW]
[ROW][C]89[/C][C]0.091[/C][C]-0.082[/C][C]0.0068[/C][C]0.2412[/C][C]0.0201[/C][C]0.1418[/C][/ROW]
[ROW][C]90[/C][C]0.0999[/C][C]-0.0493[/C][C]0.0041[/C][C]0.0814[/C][C]0.0068[/C][C]0.0824[/C][/ROW]
[ROW][C]91[/C][C]0.1055[/C][C]-0.002[/C][C]2e-04[/C][C]1e-04[/C][C]0[/C][C]0.0034[/C][/ROW]
[ROW][C]92[/C][C]0.1099[/C][C]0.0275[/C][C]0.0023[/C][C]0.0241[/C][C]0.002[/C][C]0.0448[/C][/ROW]
[/TABLE]
Source: https://freestatistics.org/blog/index.php?pk=34738&T=2

Globally Unique Identifier (entire table): ba.freestatistics.org/blog/index.php?pk=34738&T=2

As an alternative you can also use a QR Code:  

The GUIDs for individual cells are displayed in the table below:

Univariate ARIMA Extrapolation Forecast Performance
time% S.E.PEMAPESq.EMSERMSE
810.0267-0.02910.00240.03020.00250.0502
820.0491-0.01710.00140.01069e-040.0297
830.0655-0.02510.00210.02310.00190.0439
840.07250.0130.00110.00635e-040.0229
850.0750.02330.00190.02060.00170.0414
860.07670.00837e-040.00262e-040.0148
870.0795-0.01850.00150.01270.00110.0326
880.0834-0.05370.00450.10820.0090.0949
890.091-0.0820.00680.24120.02010.1418
900.0999-0.04930.00410.08140.00680.0824
910.1055-0.0022e-041e-0400.0034
920.10990.02750.00230.02410.0020.0448


Parameters (Session):
par1 = 12 ; par2 = 1 ; par3 = 1 ; par4 = 0 ; par5 = 12 ; par6 = 3 ; par7 = 0 ; par8 = 2 ; par9 = 1 ; par10 = FALSE ;
Parameters (R input):
par1 = 12 ; par2 = 1 ; par3 = 1 ; par4 = 0 ; par5 = 12 ; par6 = 3 ; par7 = 0 ; par8 = 2 ; par9 = 1 ; par10 = FALSE ;
R code (references can be found in the software module):
par1 <- as.numeric(par1) #cut off periods
par2 <- as.numeric(par2) #lambda
par3 <- as.numeric(par3) #degree of non-seasonal differencing
par4 <- as.numeric(par4) #degree of seasonal differencing
par5 <- as.numeric(par5) #seasonal period
par6 <- as.numeric(par6) #p
par7 <- as.numeric(par7) #q
par8 <- as.numeric(par8) #P
par9 <- as.numeric(par9) #Q
if (par10 == 'TRUE') par10 <- TRUE
if (par10 == 'FALSE') par10 <- FALSE
if (par2 == 0) x <- log(x)
if (par2 != 0) x <- x^par2
lx <- length(x)
first <- lx - 2*par1
nx <- lx - par1
nx1 <- nx + 1
fx <- lx - nx
if (fx < 1) {
fx <- par5
nx1 <- lx + fx - 1
first <- lx - 2*fx
}
first <- 1
if (fx < 3) fx <- round(lx/10,0)
(arima.out <- arima(x[1:nx], order=c(par6,par3,par7), seasonal=list(order=c(par8,par4,par9), period=par5), include.mean=par10, method='ML'))
(forecast <- predict(arima.out,fx))
(lb <- forecast$pred - 1.96 * forecast$se)
(ub <- forecast$pred + 1.96 * forecast$se)
if (par2 == 0) {
x <- exp(x)
forecast$pred <- exp(forecast$pred)
lb <- exp(lb)
ub <- exp(ub)
}
if (par2 != 0) {
x <- x^(1/par2)
forecast$pred <- forecast$pred^(1/par2)
lb <- lb^(1/par2)
ub <- ub^(1/par2)
}
if (par2 < 0) {
olb <- lb
lb <- ub
ub <- olb
}
(actandfor <- c(x[1:nx], forecast$pred))
(perc.se <- (ub-forecast$pred)/1.96/forecast$pred)
bitmap(file='test1.png')
opar <- par(mar=c(4,4,2,2),las=1)
ylim <- c( min(x[first:nx],lb), max(x[first:nx],ub))
plot(x,ylim=ylim,type='n',xlim=c(first,lx))
usr <- par('usr')
rect(usr[1],usr[3],nx+1,usr[4],border=NA,col='lemonchiffon')
rect(nx1,usr[3],usr[2],usr[4],border=NA,col='lavender')
abline(h= (-3:3)*2 , col ='gray', lty =3)
polygon( c(nx1:lx,lx:nx1), c(lb,rev(ub)), col = 'orange', lty=2,border=NA)
lines(nx1:lx, lb , lty=2)
lines(nx1:lx, ub , lty=2)
lines(x, lwd=2)
lines(nx1:lx, forecast$pred , lwd=2 , col ='white')
box()
par(opar)
dev.off()
prob.dec <- array(NA, dim=fx)
prob.sdec <- array(NA, dim=fx)
prob.ldec <- array(NA, dim=fx)
prob.pval <- array(NA, dim=fx)
perf.pe <- array(0, dim=fx)
perf.mape <- array(0, dim=fx)
perf.se <- array(0, dim=fx)
perf.mse <- array(0, dim=fx)
perf.rmse <- array(0, dim=fx)
for (i in 1:fx) {
locSD <- (ub[i] - forecast$pred[i]) / 1.96
perf.pe[i] = (x[nx+i] - forecast$pred[i]) / forecast$pred[i]
perf.mape[i] = perf.mape[i] + abs(perf.pe[i])
perf.se[i] = (x[nx+i] - forecast$pred[i])^2
perf.mse[i] = perf.mse[i] + perf.se[i]
prob.dec[i] = pnorm((x[nx+i-1] - forecast$pred[i]) / locSD)
prob.sdec[i] = pnorm((x[nx+i-par5] - forecast$pred[i]) / locSD)
prob.ldec[i] = pnorm((x[nx] - forecast$pred[i]) / locSD)
prob.pval[i] = pnorm(abs(x[nx+i] - forecast$pred[i]) / locSD)
}
perf.mape = perf.mape / fx
perf.mse = perf.mse / fx
perf.rmse = sqrt(perf.mse)
bitmap(file='test2.png')
plot(forecast$pred, pch=19, type='b',main='ARIMA Extrapolation Forecast', ylab='Forecast and 95% CI', xlab='time',ylim=c(min(lb),max(ub)))
dum <- forecast$pred
dum[1:12] <- x[(nx+1):lx]
lines(dum, lty=1)
lines(ub,lty=3)
lines(lb,lty=3)
dev.off()
load(file='createtable')
a<-table.start()
a<-table.row.start(a)
a<-table.element(a,'Univariate ARIMA Extrapolation Forecast',9,TRUE)
a<-table.row.end(a)
a<-table.row.start(a)
a<-table.element(a,'time',1,header=TRUE)
a<-table.element(a,'Y[t]',1,header=TRUE)
a<-table.element(a,'F[t]',1,header=TRUE)
a<-table.element(a,'95% LB',1,header=TRUE)
a<-table.element(a,'95% UB',1,header=TRUE)
a<-table.element(a,'p-value
(H0: Y[t] = F[t])',1,header=TRUE)
a<-table.element(a,'P(F[t]>Y[t-1])',1,header=TRUE)
a<-table.element(a,'P(F[t]>Y[t-s])',1,header=TRUE)
mylab <- paste('P(F[t]>Y[',nx,sep='')
mylab <- paste(mylab,'])',sep='')
a<-table.element(a,mylab,1,header=TRUE)
a<-table.row.end(a)
for (i in (nx-par5):nx) {
a<-table.row.start(a)
a<-table.element(a,i,header=TRUE)
a<-table.element(a,x[i])
a<-table.element(a,'-')
a<-table.row.end(a)
}
for (i in 1:fx) {
a<-table.row.start(a)
a<-table.element(a,nx+i,header=TRUE)
a<-table.element(a,round(x[nx+i],4))
a<-table.element(a,round(forecast$pred[i],4))
a<-table.element(a,round(lb[i],4))
a<-table.element(a,round(ub[i],4))
a<-table.element(a,round((1-prob.pval[i]),4))
a<-table.element(a,round((1-prob.dec[i]),4))
a<-table.element(a,round((1-prob.sdec[i]),4))
a<-table.element(a,round((1-prob.ldec[i]),4))
a<-table.row.end(a)
}
a<-table.end(a)
table.save(a,file='mytable.tab')
a<-table.start()
a<-table.row.start(a)
a<-table.element(a,'Univariate ARIMA Extrapolation Forecast Performance',7,TRUE)
a<-table.row.end(a)
a<-table.row.start(a)
a<-table.element(a,'time',1,header=TRUE)
a<-table.element(a,'% S.E.',1,header=TRUE)
a<-table.element(a,'PE',1,header=TRUE)
a<-table.element(a,'MAPE',1,header=TRUE)
a<-table.element(a,'Sq.E',1,header=TRUE)
a<-table.element(a,'MSE',1,header=TRUE)
a<-table.element(a,'RMSE',1,header=TRUE)
a<-table.row.end(a)
for (i in 1:fx) {
a<-table.row.start(a)
a<-table.element(a,nx+i,header=TRUE)
a<-table.element(a,round(perc.se[i],4))
a<-table.element(a,round(perf.pe[i],4))
a<-table.element(a,round(perf.mape[i],4))
a<-table.element(a,round(perf.se[i],4))
a<-table.element(a,round(perf.mse[i],4))
a<-table.element(a,round(perf.rmse[i],4))
a<-table.row.end(a)
}
a<-table.end(a)
table.save(a,file='mytable1.tab')