Free Statistics

of Irreproducible Research!

Author's title

Author*The author of this computation has been verified*
R Software Modulerwasp_cross.wasp
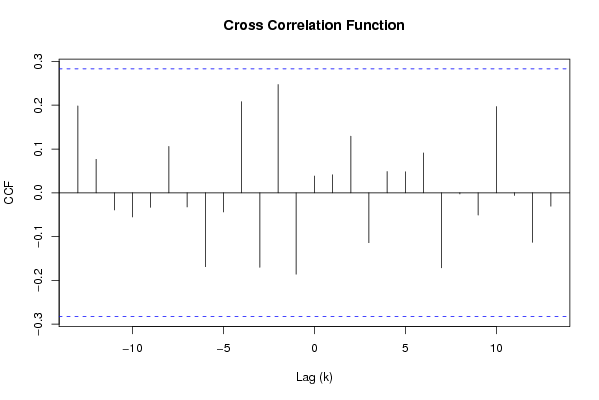
Title produced by softwareCross Correlation Function
Date of computationThu, 18 Dec 2008 06:16:48 -0700
Cite this page as followsStatistical Computations at FreeStatistics.org, Office for Research Development and Education, URL https://freestatistics.org/blog/index.php?v=date/2008/Dec/18/t1229606257aooy6qthgz6pz5r.htm/, Retrieved Sat, 11 May 2024 10:36:21 +0000
Statistical Computations at FreeStatistics.org, Office for Research Development and Education, URL https://freestatistics.org/blog/index.php?pk=34735, Retrieved Sat, 11 May 2024 10:36:21 +0000
QR Codes:

Original text written by user:
IsPrivate?No (this computation is public)
User-defined keywords
Estimated Impact180
Family? (F = Feedback message, R = changed R code, M = changed R Module, P = changed Parameters, D = changed Data)
-     [Cross Correlation Function] [Cross correlation...] [2008-12-15 23:19:44] [abc1badd8768b83426be5031c0f123a6]
-   PD    [Cross Correlation Function] [cross correlation...] [2008-12-18 13:16:48] [0bb3b56b7083c5944c3818446f605d68] [Current]
Feedback Forum

Post a new message
Dataseries X:
15023.6
12083
15761.3
16943
15070.3
13659.6
14768.9
14725.1
15998.1
15370.6
14956.9
15469.7
15101.8
11703.7
16283.6
16726.5
14968.9
14861
14583.3
15305.8
17903.9
16379.4
15420.3
17870.5
15912.8
13866.5
17823.2
17872
17420.4
16704.4
15991.2
16583.6
19123.5
17838.7
17209.4
18586.5
16258.1
15141.6
19202.1
17746.5
19090.1
18040.3
17515.5
17751.8
21072.4
17170
19439.5
19795.4
17574.9
16165.4
19464.6
19932.1
19961.2
17343.4
18924.2
18574.1
21350.6
18840.1
20304.8
21132.4
19753.9
Dataseries Y:
7.6
7.7
7.6
8.2
8
8.1
8.3
8.2
8.1
7.7
7.6
7.7
8.2
8.4
8.4
8.6
8.4
8.5
8.7
8.7
8.6
7.4
7.3
7.4
9
9.2
9.2
8.5
8.3
8.3
8.6
8.6
8.5
8.1
8.1
8
8.6
8.7
8.7
8.6
8.4
8.4
8.7
8.7
8.5
8.3
8.3
8.3
8.1
8.2
8.1
8.1
7.9
7.7
8.1
8
7.7
7.8
7.6
7.4
7.7


Summary of computational transaction
Raw Inputview raw input (R code)
Raw Outputview raw output of R engine
Computing time0 seconds
R Server'Gwilym Jenkins' @ 72.249.127.135

\begin{tabular}{lllllllll}
\hline
Summary of computational transaction \tabularnewline
Raw Input & view raw input (R code)  \tabularnewline
Raw Output & view raw output of R engine  \tabularnewline
Computing time & 0 seconds \tabularnewline
R Server & 'Gwilym Jenkins' @ 72.249.127.135 \tabularnewline
\hline
\end{tabular}
%Source: https://freestatistics.org/blog/index.php?pk=34735&T=0

[TABLE]
[ROW][C]Summary of computational transaction[/C][/ROW]
[ROW][C]Raw Input[/C][C]view raw input (R code) [/C][/ROW]
[ROW][C]Raw Output[/C][C]view raw output of R engine [/C][/ROW]
[ROW][C]Computing time[/C][C]0 seconds[/C][/ROW]
[ROW][C]R Server[/C][C]'Gwilym Jenkins' @ 72.249.127.135[/C][/ROW]
[/TABLE]
Source: https://freestatistics.org/blog/index.php?pk=34735&T=0

Globally Unique Identifier (entire table): ba.freestatistics.org/blog/index.php?pk=34735&T=0

As an alternative you can also use a QR Code:  

The GUIDs for individual cells are displayed in the table below:

Summary of computational transaction
Raw Inputview raw input (R code)
Raw Outputview raw output of R engine
Computing time0 seconds
R Server'Gwilym Jenkins' @ 72.249.127.135


Cross Correlation Function
ParameterValue
Box-Cox transformation parameter (lambda) of X series1
Degree of non-seasonal differencing (d) of X series0
Degree of seasonal differencing (D) of X series1
Seasonal Period (s)12
Box-Cox transformation parameter (lambda) of Y series1
Degree of non-seasonal differencing (d) of Y series1
Degree of seasonal differencing (D) of Y series1
krho(Y[t],X[t+k])
-130.198371389252893
-120.0764516217461244
-11-0.0392248609660977
-10-0.0550177381418464
-9-0.0331345482039400
-80.105849949607511
-7-0.0323341511070957
-6-0.168672335658485
-5-0.0436165719949824
-40.208240973435212
-3-0.170167512985075
-20.247175584859789
-1-0.185916708548078
00.0381617258062871
10.0411832329756139
20.129397154928113
3-0.113890794449361
40.0483745563591605
50.047842064015638
60.0909236196138983
7-0.171469827527939
8-0.00248416308424365
9-0.0507802391765393
100.197123539812494
11-0.00597814189989049
12-0.113063156831932
13-0.0304567413394635

\begin{tabular}{lllllllll}
\hline
Cross Correlation Function \tabularnewline
Parameter & Value \tabularnewline
Box-Cox transformation parameter (lambda) of X series & 1 \tabularnewline
Degree of non-seasonal differencing (d) of X series & 0 \tabularnewline
Degree of seasonal differencing (D) of X series & 1 \tabularnewline
Seasonal Period (s) & 12 \tabularnewline
Box-Cox transformation parameter (lambda) of Y series & 1 \tabularnewline
Degree of non-seasonal differencing (d) of Y series & 1 \tabularnewline
Degree of seasonal differencing (D) of Y series & 1 \tabularnewline
k & rho(Y[t],X[t+k]) \tabularnewline
-13 & 0.198371389252893 \tabularnewline
-12 & 0.0764516217461244 \tabularnewline
-11 & -0.0392248609660977 \tabularnewline
-10 & -0.0550177381418464 \tabularnewline
-9 & -0.0331345482039400 \tabularnewline
-8 & 0.105849949607511 \tabularnewline
-7 & -0.0323341511070957 \tabularnewline
-6 & -0.168672335658485 \tabularnewline
-5 & -0.0436165719949824 \tabularnewline
-4 & 0.208240973435212 \tabularnewline
-3 & -0.170167512985075 \tabularnewline
-2 & 0.247175584859789 \tabularnewline
-1 & -0.185916708548078 \tabularnewline
0 & 0.0381617258062871 \tabularnewline
1 & 0.0411832329756139 \tabularnewline
2 & 0.129397154928113 \tabularnewline
3 & -0.113890794449361 \tabularnewline
4 & 0.0483745563591605 \tabularnewline
5 & 0.047842064015638 \tabularnewline
6 & 0.0909236196138983 \tabularnewline
7 & -0.171469827527939 \tabularnewline
8 & -0.00248416308424365 \tabularnewline
9 & -0.0507802391765393 \tabularnewline
10 & 0.197123539812494 \tabularnewline
11 & -0.00597814189989049 \tabularnewline
12 & -0.113063156831932 \tabularnewline
13 & -0.0304567413394635 \tabularnewline
\hline
\end{tabular}
%Source: https://freestatistics.org/blog/index.php?pk=34735&T=1

[TABLE]
[ROW][C]Cross Correlation Function[/C][/ROW]
[ROW][C]Parameter[/C][C]Value[/C][/ROW]
[ROW][C]Box-Cox transformation parameter (lambda) of X series[/C][C]1[/C][/ROW]
[ROW][C]Degree of non-seasonal differencing (d) of X series[/C][C]0[/C][/ROW]
[ROW][C]Degree of seasonal differencing (D) of X series[/C][C]1[/C][/ROW]
[ROW][C]Seasonal Period (s)[/C][C]12[/C][/ROW]
[ROW][C]Box-Cox transformation parameter (lambda) of Y series[/C][C]1[/C][/ROW]
[ROW][C]Degree of non-seasonal differencing (d) of Y series[/C][C]1[/C][/ROW]
[ROW][C]Degree of seasonal differencing (D) of Y series[/C][C]1[/C][/ROW]
[ROW][C]k[/C][C]rho(Y[t],X[t+k])[/C][/ROW]
[ROW][C]-13[/C][C]0.198371389252893[/C][/ROW]
[ROW][C]-12[/C][C]0.0764516217461244[/C][/ROW]
[ROW][C]-11[/C][C]-0.0392248609660977[/C][/ROW]
[ROW][C]-10[/C][C]-0.0550177381418464[/C][/ROW]
[ROW][C]-9[/C][C]-0.0331345482039400[/C][/ROW]
[ROW][C]-8[/C][C]0.105849949607511[/C][/ROW]
[ROW][C]-7[/C][C]-0.0323341511070957[/C][/ROW]
[ROW][C]-6[/C][C]-0.168672335658485[/C][/ROW]
[ROW][C]-5[/C][C]-0.0436165719949824[/C][/ROW]
[ROW][C]-4[/C][C]0.208240973435212[/C][/ROW]
[ROW][C]-3[/C][C]-0.170167512985075[/C][/ROW]
[ROW][C]-2[/C][C]0.247175584859789[/C][/ROW]
[ROW][C]-1[/C][C]-0.185916708548078[/C][/ROW]
[ROW][C]0[/C][C]0.0381617258062871[/C][/ROW]
[ROW][C]1[/C][C]0.0411832329756139[/C][/ROW]
[ROW][C]2[/C][C]0.129397154928113[/C][/ROW]
[ROW][C]3[/C][C]-0.113890794449361[/C][/ROW]
[ROW][C]4[/C][C]0.0483745563591605[/C][/ROW]
[ROW][C]5[/C][C]0.047842064015638[/C][/ROW]
[ROW][C]6[/C][C]0.0909236196138983[/C][/ROW]
[ROW][C]7[/C][C]-0.171469827527939[/C][/ROW]
[ROW][C]8[/C][C]-0.00248416308424365[/C][/ROW]
[ROW][C]9[/C][C]-0.0507802391765393[/C][/ROW]
[ROW][C]10[/C][C]0.197123539812494[/C][/ROW]
[ROW][C]11[/C][C]-0.00597814189989049[/C][/ROW]
[ROW][C]12[/C][C]-0.113063156831932[/C][/ROW]
[ROW][C]13[/C][C]-0.0304567413394635[/C][/ROW]
[/TABLE]
Source: https://freestatistics.org/blog/index.php?pk=34735&T=1

Globally Unique Identifier (entire table): ba.freestatistics.org/blog/index.php?pk=34735&T=1

As an alternative you can also use a QR Code:  

The GUIDs for individual cells are displayed in the table below:

Cross Correlation Function
ParameterValue
Box-Cox transformation parameter (lambda) of X series1
Degree of non-seasonal differencing (d) of X series0
Degree of seasonal differencing (D) of X series1
Seasonal Period (s)12
Box-Cox transformation parameter (lambda) of Y series1
Degree of non-seasonal differencing (d) of Y series1
Degree of seasonal differencing (D) of Y series1
krho(Y[t],X[t+k])
-130.198371389252893
-120.0764516217461244
-11-0.0392248609660977
-10-0.0550177381418464
-9-0.0331345482039400
-80.105849949607511
-7-0.0323341511070957
-6-0.168672335658485
-5-0.0436165719949824
-40.208240973435212
-3-0.170167512985075
-20.247175584859789
-1-0.185916708548078
00.0381617258062871
10.0411832329756139
20.129397154928113
3-0.113890794449361
40.0483745563591605
50.047842064015638
60.0909236196138983
7-0.171469827527939
8-0.00248416308424365
9-0.0507802391765393
100.197123539812494
11-0.00597814189989049
12-0.113063156831932
13-0.0304567413394635


Parameters (Session):
par1 = 1 ; par2 = 0 ; par3 = 1 ; par4 = 12 ; par5 = 1 ; par6 = 1 ; par7 = 1 ;
Parameters (R input):
par1 = 1 ; par2 = 0 ; par3 = 1 ; par4 = 12 ; par5 = 1 ; par6 = 1 ; par7 = 1 ;
R code (references can be found in the software module):
par1 <- as.numeric(par1)
par2 <- as.numeric(par2)
par3 <- as.numeric(par3)
par4 <- as.numeric(par4)
par5 <- as.numeric(par5)
par6 <- as.numeric(par6)
par7 <- as.numeric(par7)
if (par1 == 0) {
x <- log(x)
} else {
x <- (x ^ par1 - 1) / par1
}
if (par5 == 0) {
y <- log(y)
} else {
y <- (y ^ par5 - 1) / par5
}
if (par2 > 0) x <- diff(x,lag=1,difference=par2)
if (par6 > 0) y <- diff(y,lag=1,difference=par6)
if (par3 > 0) x <- diff(x,lag=par4,difference=par3)
if (par7 > 0) y <- diff(y,lag=par4,difference=par7)
x
y
bitmap(file='test1.png')
(r <- ccf(x,y,main='Cross Correlation Function',ylab='CCF',xlab='Lag (k)'))
dev.off()
load(file='createtable')
a<-table.start()
a<-table.row.start(a)
a<-table.element(a,'Cross Correlation Function',2,TRUE)
a<-table.row.end(a)
a<-table.row.start(a)
a<-table.element(a,'Parameter',header=TRUE)
a<-table.element(a,'Value',header=TRUE)
a<-table.row.end(a)
a<-table.row.start(a)
a<-table.element(a,'Box-Cox transformation parameter (lambda) of X series',header=TRUE)
a<-table.element(a,par1)
a<-table.row.end(a)
a<-table.row.start(a)
a<-table.element(a,'Degree of non-seasonal differencing (d) of X series',header=TRUE)
a<-table.element(a,par2)
a<-table.row.end(a)
a<-table.row.start(a)
a<-table.element(a,'Degree of seasonal differencing (D) of X series',header=TRUE)
a<-table.element(a,par3)
a<-table.row.end(a)
a<-table.row.start(a)
a<-table.element(a,'Seasonal Period (s)',header=TRUE)
a<-table.element(a,par4)
a<-table.row.end(a)
a<-table.row.start(a)
a<-table.element(a,'Box-Cox transformation parameter (lambda) of Y series',header=TRUE)
a<-table.element(a,par5)
a<-table.row.end(a)
a<-table.row.start(a)
a<-table.element(a,'Degree of non-seasonal differencing (d) of Y series',header=TRUE)
a<-table.element(a,par6)
a<-table.row.end(a)
a<-table.row.start(a)
a<-table.element(a,'Degree of seasonal differencing (D) of Y series',header=TRUE)
a<-table.element(a,par7)
a<-table.row.end(a)
a<-table.row.start(a)
a<-table.element(a,'k',header=TRUE)
a<-table.element(a,'rho(Y[t],X[t+k])',header=TRUE)
a<-table.row.end(a)
mylength <- length(r$acf)
myhalf <- floor((mylength-1)/2)
for (i in 1:mylength) {
a<-table.row.start(a)
a<-table.element(a,i-myhalf-1,header=TRUE)
a<-table.element(a,r$acf[i])
a<-table.row.end(a)
}
a<-table.end(a)
table.save(a,file='mytable.tab')