Free Statistics

of Irreproducible Research!

Author's title

Author*The author of this computation has been verified*
R Software Modulerwasp_autocorrelation.wasp
Title produced by software(Partial) Autocorrelation Function
Date of computationThu, 18 Dec 2008 05:31:31 -0700
Cite this page as followsStatistical Computations at FreeStatistics.org, Office for Research Development and Education, URL https://freestatistics.org/blog/index.php?v=date/2008/Dec/18/t1229603534dp5cah5zr04ja7q.htm/, Retrieved Sun, 12 May 2024 02:47:57 +0000
Statistical Computations at FreeStatistics.org, Office for Research Development and Education, URL https://freestatistics.org/blog/index.php?pk=34711, Retrieved Sun, 12 May 2024 02:47:57 +0000
QR Codes:

Original text written by user:
IsPrivate?No (this computation is public)
User-defined keywords
Estimated Impact155
Family? (F = Feedback message, R = changed R code, M = changed R Module, P = changed Parameters, D = changed Data)
-       [(Partial) Autocorrelation Function] [Paper - (P)ACF] [2008-12-18 12:31:31] [c33ddd06d9ea3933c8ac89c0e74c9b3a] [Current]
Feedback Forum

Post a new message
Dataseries X:
357
363
364
363
358
357
357
380
378
376
380
379
384
392
394
392
396
392
396
419
421
420
418
410
418
426
428
430
424
423
427
441
449
452
462
455
461
461
463
462
456
455
456
472
472
471
465
459
465
468
467
463
460
462
461
476
476
471
453
443
442
444
438
427
424
416
406
431
434
418
412
404
409
412
406
398
397
385
390
413
413
401
397
397


Summary of computational transaction
Raw Inputview raw input (R code)
Raw Outputview raw output of R engine
Computing time2 seconds
R Server'George Udny Yule' @ 72.249.76.132

\begin{tabular}{lllllllll}
\hline
Summary of computational transaction \tabularnewline
Raw Input & view raw input (R code)  \tabularnewline
Raw Output & view raw output of R engine  \tabularnewline
Computing time & 2 seconds \tabularnewline
R Server & 'George Udny Yule' @ 72.249.76.132 \tabularnewline
\hline
\end{tabular}
%Source: https://freestatistics.org/blog/index.php?pk=34711&T=0

[TABLE]
[ROW][C]Summary of computational transaction[/C][/ROW]
[ROW][C]Raw Input[/C][C]view raw input (R code) [/C][/ROW]
[ROW][C]Raw Output[/C][C]view raw output of R engine [/C][/ROW]
[ROW][C]Computing time[/C][C]2 seconds[/C][/ROW]
[ROW][C]R Server[/C][C]'George Udny Yule' @ 72.249.76.132[/C][/ROW]
[/TABLE]
Source: https://freestatistics.org/blog/index.php?pk=34711&T=0

Globally Unique Identifier (entire table): ba.freestatistics.org/blog/index.php?pk=34711&T=0

As an alternative you can also use a QR Code:  

The GUIDs for individual cells are displayed in the table below:

Summary of computational transaction
Raw Inputview raw input (R code)
Raw Outputview raw output of R engine
Computing time2 seconds
R Server'George Udny Yule' @ 72.249.76.132


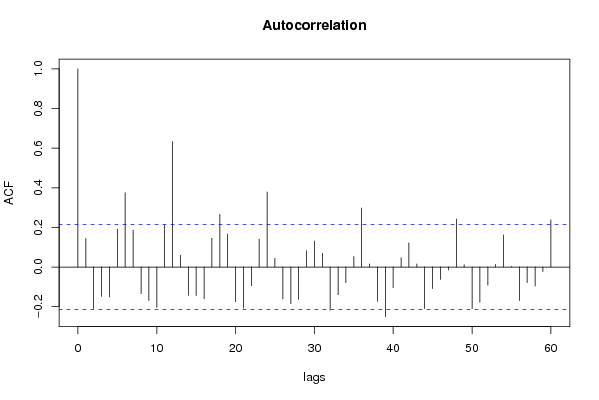
Autocorrelation Function
Time lag kACF(k)T-STATP-value
10.1441191.3130.096403
2-0.210049-1.91360.029557
3-0.148616-1.3540.089713
4-0.151313-1.37850.085873
50.1915621.74520.042325
60.3746943.41360.000497
70.1860811.69530.046886
8-0.134561-1.22590.111849
9-0.169017-1.53980.063704
10-0.2035-1.8540.033648
110.2114651.92650.02873
120.6341415.77730
130.0593770.5410.294995
14-0.143094-1.30360.097979
15-0.144366-1.31520.096026
16-0.16055-1.46270.073665
170.145211.32290.094747
180.2654732.41860.008884
190.1665541.51740.066485
20-0.175462-1.59850.056862
21-0.207149-1.88720.031314
22-0.094063-0.8570.19697
230.1405921.28090.101906
240.3782433.4460.000448
250.0447950.40810.342124
26-0.160399-1.46130.073854
27-0.185207-1.68730.047648
28-0.16331-1.48780.070294
290.0821470.74840.22817
300.1308161.19180.11837
310.0688270.6270.266175
32-0.217764-1.98390.025285
33-0.139608-1.27190.103482
34-0.079169-0.72130.236386
350.0525080.47840.316822
360.2976032.71130.004072
370.0153770.14010.444463
38-0.172726-1.57360.059691
39-0.250681-2.28380.012469
40-0.105366-0.95990.16994
410.0471560.42960.334296
420.121711.10880.135354
430.0157910.14390.442979
44-0.210068-1.91380.029546
45-0.108791-0.99110.162251
46-0.062585-0.57020.285049
47-0.014714-0.13410.446842
480.2421692.20630.015064
490.0118830.10830.457025
50-0.210249-1.91550.029439
51-0.178513-1.62630.053835
52-0.091535-0.83390.203358
530.0128130.11670.453677
540.1620591.47640.071807
550.0030.02730.48913
56-0.169255-1.5420.063441
57-0.078382-0.71410.238585
58-0.095687-0.87180.19293
59-0.02333-0.21260.416099
600.2380832.1690.01647

\begin{tabular}{lllllllll}
\hline
Autocorrelation Function \tabularnewline
Time lag k & ACF(k) & T-STAT & P-value \tabularnewline
1 & 0.144119 & 1.313 & 0.096403 \tabularnewline
2 & -0.210049 & -1.9136 & 0.029557 \tabularnewline
3 & -0.148616 & -1.354 & 0.089713 \tabularnewline
4 & -0.151313 & -1.3785 & 0.085873 \tabularnewline
5 & 0.191562 & 1.7452 & 0.042325 \tabularnewline
6 & 0.374694 & 3.4136 & 0.000497 \tabularnewline
7 & 0.186081 & 1.6953 & 0.046886 \tabularnewline
8 & -0.134561 & -1.2259 & 0.111849 \tabularnewline
9 & -0.169017 & -1.5398 & 0.063704 \tabularnewline
10 & -0.2035 & -1.854 & 0.033648 \tabularnewline
11 & 0.211465 & 1.9265 & 0.02873 \tabularnewline
12 & 0.634141 & 5.7773 & 0 \tabularnewline
13 & 0.059377 & 0.541 & 0.294995 \tabularnewline
14 & -0.143094 & -1.3036 & 0.097979 \tabularnewline
15 & -0.144366 & -1.3152 & 0.096026 \tabularnewline
16 & -0.16055 & -1.4627 & 0.073665 \tabularnewline
17 & 0.14521 & 1.3229 & 0.094747 \tabularnewline
18 & 0.265473 & 2.4186 & 0.008884 \tabularnewline
19 & 0.166554 & 1.5174 & 0.066485 \tabularnewline
20 & -0.175462 & -1.5985 & 0.056862 \tabularnewline
21 & -0.207149 & -1.8872 & 0.031314 \tabularnewline
22 & -0.094063 & -0.857 & 0.19697 \tabularnewline
23 & 0.140592 & 1.2809 & 0.101906 \tabularnewline
24 & 0.378243 & 3.446 & 0.000448 \tabularnewline
25 & 0.044795 & 0.4081 & 0.342124 \tabularnewline
26 & -0.160399 & -1.4613 & 0.073854 \tabularnewline
27 & -0.185207 & -1.6873 & 0.047648 \tabularnewline
28 & -0.16331 & -1.4878 & 0.070294 \tabularnewline
29 & 0.082147 & 0.7484 & 0.22817 \tabularnewline
30 & 0.130816 & 1.1918 & 0.11837 \tabularnewline
31 & 0.068827 & 0.627 & 0.266175 \tabularnewline
32 & -0.217764 & -1.9839 & 0.025285 \tabularnewline
33 & -0.139608 & -1.2719 & 0.103482 \tabularnewline
34 & -0.079169 & -0.7213 & 0.236386 \tabularnewline
35 & 0.052508 & 0.4784 & 0.316822 \tabularnewline
36 & 0.297603 & 2.7113 & 0.004072 \tabularnewline
37 & 0.015377 & 0.1401 & 0.444463 \tabularnewline
38 & -0.172726 & -1.5736 & 0.059691 \tabularnewline
39 & -0.250681 & -2.2838 & 0.012469 \tabularnewline
40 & -0.105366 & -0.9599 & 0.16994 \tabularnewline
41 & 0.047156 & 0.4296 & 0.334296 \tabularnewline
42 & 0.12171 & 1.1088 & 0.135354 \tabularnewline
43 & 0.015791 & 0.1439 & 0.442979 \tabularnewline
44 & -0.210068 & -1.9138 & 0.029546 \tabularnewline
45 & -0.108791 & -0.9911 & 0.162251 \tabularnewline
46 & -0.062585 & -0.5702 & 0.285049 \tabularnewline
47 & -0.014714 & -0.1341 & 0.446842 \tabularnewline
48 & 0.242169 & 2.2063 & 0.015064 \tabularnewline
49 & 0.011883 & 0.1083 & 0.457025 \tabularnewline
50 & -0.210249 & -1.9155 & 0.029439 \tabularnewline
51 & -0.178513 & -1.6263 & 0.053835 \tabularnewline
52 & -0.091535 & -0.8339 & 0.203358 \tabularnewline
53 & 0.012813 & 0.1167 & 0.453677 \tabularnewline
54 & 0.162059 & 1.4764 & 0.071807 \tabularnewline
55 & 0.003 & 0.0273 & 0.48913 \tabularnewline
56 & -0.169255 & -1.542 & 0.063441 \tabularnewline
57 & -0.078382 & -0.7141 & 0.238585 \tabularnewline
58 & -0.095687 & -0.8718 & 0.19293 \tabularnewline
59 & -0.02333 & -0.2126 & 0.416099 \tabularnewline
60 & 0.238083 & 2.169 & 0.01647 \tabularnewline
\hline
\end{tabular}
%Source: https://freestatistics.org/blog/index.php?pk=34711&T=1

[TABLE]
[ROW][C]Autocorrelation Function[/C][/ROW]
[ROW][C]Time lag k[/C][C]ACF(k)[/C][C]T-STAT[/C][C]P-value[/C][/ROW]
[ROW][C]1[/C][C]0.144119[/C][C]1.313[/C][C]0.096403[/C][/ROW]
[ROW][C]2[/C][C]-0.210049[/C][C]-1.9136[/C][C]0.029557[/C][/ROW]
[ROW][C]3[/C][C]-0.148616[/C][C]-1.354[/C][C]0.089713[/C][/ROW]
[ROW][C]4[/C][C]-0.151313[/C][C]-1.3785[/C][C]0.085873[/C][/ROW]
[ROW][C]5[/C][C]0.191562[/C][C]1.7452[/C][C]0.042325[/C][/ROW]
[ROW][C]6[/C][C]0.374694[/C][C]3.4136[/C][C]0.000497[/C][/ROW]
[ROW][C]7[/C][C]0.186081[/C][C]1.6953[/C][C]0.046886[/C][/ROW]
[ROW][C]8[/C][C]-0.134561[/C][C]-1.2259[/C][C]0.111849[/C][/ROW]
[ROW][C]9[/C][C]-0.169017[/C][C]-1.5398[/C][C]0.063704[/C][/ROW]
[ROW][C]10[/C][C]-0.2035[/C][C]-1.854[/C][C]0.033648[/C][/ROW]
[ROW][C]11[/C][C]0.211465[/C][C]1.9265[/C][C]0.02873[/C][/ROW]
[ROW][C]12[/C][C]0.634141[/C][C]5.7773[/C][C]0[/C][/ROW]
[ROW][C]13[/C][C]0.059377[/C][C]0.541[/C][C]0.294995[/C][/ROW]
[ROW][C]14[/C][C]-0.143094[/C][C]-1.3036[/C][C]0.097979[/C][/ROW]
[ROW][C]15[/C][C]-0.144366[/C][C]-1.3152[/C][C]0.096026[/C][/ROW]
[ROW][C]16[/C][C]-0.16055[/C][C]-1.4627[/C][C]0.073665[/C][/ROW]
[ROW][C]17[/C][C]0.14521[/C][C]1.3229[/C][C]0.094747[/C][/ROW]
[ROW][C]18[/C][C]0.265473[/C][C]2.4186[/C][C]0.008884[/C][/ROW]
[ROW][C]19[/C][C]0.166554[/C][C]1.5174[/C][C]0.066485[/C][/ROW]
[ROW][C]20[/C][C]-0.175462[/C][C]-1.5985[/C][C]0.056862[/C][/ROW]
[ROW][C]21[/C][C]-0.207149[/C][C]-1.8872[/C][C]0.031314[/C][/ROW]
[ROW][C]22[/C][C]-0.094063[/C][C]-0.857[/C][C]0.19697[/C][/ROW]
[ROW][C]23[/C][C]0.140592[/C][C]1.2809[/C][C]0.101906[/C][/ROW]
[ROW][C]24[/C][C]0.378243[/C][C]3.446[/C][C]0.000448[/C][/ROW]
[ROW][C]25[/C][C]0.044795[/C][C]0.4081[/C][C]0.342124[/C][/ROW]
[ROW][C]26[/C][C]-0.160399[/C][C]-1.4613[/C][C]0.073854[/C][/ROW]
[ROW][C]27[/C][C]-0.185207[/C][C]-1.6873[/C][C]0.047648[/C][/ROW]
[ROW][C]28[/C][C]-0.16331[/C][C]-1.4878[/C][C]0.070294[/C][/ROW]
[ROW][C]29[/C][C]0.082147[/C][C]0.7484[/C][C]0.22817[/C][/ROW]
[ROW][C]30[/C][C]0.130816[/C][C]1.1918[/C][C]0.11837[/C][/ROW]
[ROW][C]31[/C][C]0.068827[/C][C]0.627[/C][C]0.266175[/C][/ROW]
[ROW][C]32[/C][C]-0.217764[/C][C]-1.9839[/C][C]0.025285[/C][/ROW]
[ROW][C]33[/C][C]-0.139608[/C][C]-1.2719[/C][C]0.103482[/C][/ROW]
[ROW][C]34[/C][C]-0.079169[/C][C]-0.7213[/C][C]0.236386[/C][/ROW]
[ROW][C]35[/C][C]0.052508[/C][C]0.4784[/C][C]0.316822[/C][/ROW]
[ROW][C]36[/C][C]0.297603[/C][C]2.7113[/C][C]0.004072[/C][/ROW]
[ROW][C]37[/C][C]0.015377[/C][C]0.1401[/C][C]0.444463[/C][/ROW]
[ROW][C]38[/C][C]-0.172726[/C][C]-1.5736[/C][C]0.059691[/C][/ROW]
[ROW][C]39[/C][C]-0.250681[/C][C]-2.2838[/C][C]0.012469[/C][/ROW]
[ROW][C]40[/C][C]-0.105366[/C][C]-0.9599[/C][C]0.16994[/C][/ROW]
[ROW][C]41[/C][C]0.047156[/C][C]0.4296[/C][C]0.334296[/C][/ROW]
[ROW][C]42[/C][C]0.12171[/C][C]1.1088[/C][C]0.135354[/C][/ROW]
[ROW][C]43[/C][C]0.015791[/C][C]0.1439[/C][C]0.442979[/C][/ROW]
[ROW][C]44[/C][C]-0.210068[/C][C]-1.9138[/C][C]0.029546[/C][/ROW]
[ROW][C]45[/C][C]-0.108791[/C][C]-0.9911[/C][C]0.162251[/C][/ROW]
[ROW][C]46[/C][C]-0.062585[/C][C]-0.5702[/C][C]0.285049[/C][/ROW]
[ROW][C]47[/C][C]-0.014714[/C][C]-0.1341[/C][C]0.446842[/C][/ROW]
[ROW][C]48[/C][C]0.242169[/C][C]2.2063[/C][C]0.015064[/C][/ROW]
[ROW][C]49[/C][C]0.011883[/C][C]0.1083[/C][C]0.457025[/C][/ROW]
[ROW][C]50[/C][C]-0.210249[/C][C]-1.9155[/C][C]0.029439[/C][/ROW]
[ROW][C]51[/C][C]-0.178513[/C][C]-1.6263[/C][C]0.053835[/C][/ROW]
[ROW][C]52[/C][C]-0.091535[/C][C]-0.8339[/C][C]0.203358[/C][/ROW]
[ROW][C]53[/C][C]0.012813[/C][C]0.1167[/C][C]0.453677[/C][/ROW]
[ROW][C]54[/C][C]0.162059[/C][C]1.4764[/C][C]0.071807[/C][/ROW]
[ROW][C]55[/C][C]0.003[/C][C]0.0273[/C][C]0.48913[/C][/ROW]
[ROW][C]56[/C][C]-0.169255[/C][C]-1.542[/C][C]0.063441[/C][/ROW]
[ROW][C]57[/C][C]-0.078382[/C][C]-0.7141[/C][C]0.238585[/C][/ROW]
[ROW][C]58[/C][C]-0.095687[/C][C]-0.8718[/C][C]0.19293[/C][/ROW]
[ROW][C]59[/C][C]-0.02333[/C][C]-0.2126[/C][C]0.416099[/C][/ROW]
[ROW][C]60[/C][C]0.238083[/C][C]2.169[/C][C]0.01647[/C][/ROW]
[/TABLE]
Source: https://freestatistics.org/blog/index.php?pk=34711&T=1

Globally Unique Identifier (entire table): ba.freestatistics.org/blog/index.php?pk=34711&T=1

As an alternative you can also use a QR Code:  

The GUIDs for individual cells are displayed in the table below:

Autocorrelation Function
Time lag kACF(k)T-STATP-value
10.1441191.3130.096403
2-0.210049-1.91360.029557
3-0.148616-1.3540.089713
4-0.151313-1.37850.085873
50.1915621.74520.042325
60.3746943.41360.000497
70.1860811.69530.046886
8-0.134561-1.22590.111849
9-0.169017-1.53980.063704
10-0.2035-1.8540.033648
110.2114651.92650.02873
120.6341415.77730
130.0593770.5410.294995
14-0.143094-1.30360.097979
15-0.144366-1.31520.096026
16-0.16055-1.46270.073665
170.145211.32290.094747
180.2654732.41860.008884
190.1665541.51740.066485
20-0.175462-1.59850.056862
21-0.207149-1.88720.031314
22-0.094063-0.8570.19697
230.1405921.28090.101906
240.3782433.4460.000448
250.0447950.40810.342124
26-0.160399-1.46130.073854
27-0.185207-1.68730.047648
28-0.16331-1.48780.070294
290.0821470.74840.22817
300.1308161.19180.11837
310.0688270.6270.266175
32-0.217764-1.98390.025285
33-0.139608-1.27190.103482
34-0.079169-0.72130.236386
350.0525080.47840.316822
360.2976032.71130.004072
370.0153770.14010.444463
38-0.172726-1.57360.059691
39-0.250681-2.28380.012469
40-0.105366-0.95990.16994
410.0471560.42960.334296
420.121711.10880.135354
430.0157910.14390.442979
44-0.210068-1.91380.029546
45-0.108791-0.99110.162251
46-0.062585-0.57020.285049
47-0.014714-0.13410.446842
480.2421692.20630.015064
490.0118830.10830.457025
50-0.210249-1.91550.029439
51-0.178513-1.62630.053835
52-0.091535-0.83390.203358
530.0128130.11670.453677
540.1620591.47640.071807
550.0030.02730.48913
56-0.169255-1.5420.063441
57-0.078382-0.71410.238585
58-0.095687-0.87180.19293
59-0.02333-0.21260.416099
600.2380832.1690.01647


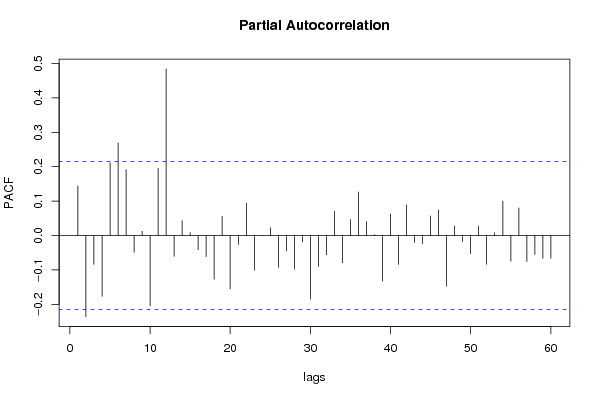
Partial Autocorrelation Function
Time lag kPACF(k)T-STATP-value
10.1441191.3130.096403
2-0.235715-2.14750.017336
3-0.083516-0.76090.224447
4-0.176533-1.60830.055785
50.211811.92970.028532
60.2687612.44850.008225
70.1915961.74550.042297
8-0.048692-0.44360.329242
90.0122240.11140.455799
10-0.204495-1.8630.032997
110.195341.77960.039399
120.484094.41031.5e-05
13-0.060384-0.55010.291857
140.0431250.39290.347704
150.008590.07830.468906
16-0.041021-0.37370.354784
17-0.060958-0.55540.290073
18-0.126714-1.15440.125822
190.0559780.510.305709
20-0.154841-1.41070.08104
21-0.025479-0.23210.408506
220.0945820.86170.195671
23-0.100663-0.91710.180879
24-0.000949-0.00860.496561
250.0223930.2040.419422
26-0.092447-0.84220.201039
27-0.044475-0.40520.34319
28-0.097613-0.88930.188207
29-0.018613-0.16960.432878
30-0.184913-1.68460.047908
31-0.089172-0.81240.209444
32-0.056094-0.5110.30534
330.0712620.64920.258992
34-0.079133-0.72090.236486
350.0465620.42420.336258
360.126271.15040.126647
370.0398350.36290.358795
380.0025530.02330.49075
39-0.132182-1.20420.11596
400.0619610.56450.286971
41-0.084-0.76530.22314
420.088990.81070.209917
43-0.019471-0.17740.429816
44-0.023475-0.21390.415588
450.0566620.51620.303539
460.0742650.67660.250274
47-0.147191-1.3410.091794
480.027780.25310.400413
49-0.017395-0.15850.437235
50-0.052761-0.48070.316004
510.0271360.24720.402675
52-0.083786-0.76330.223718
530.0080510.07330.470854
540.1001710.91260.182048
55-0.074496-0.67870.24961
560.0802870.73140.233282
57-0.075196-0.68510.247606
58-0.054773-0.4990.309547
59-0.066176-0.60290.274113
60-0.065682-0.59840.275606

\begin{tabular}{lllllllll}
\hline
Partial Autocorrelation Function \tabularnewline
Time lag k & PACF(k) & T-STAT & P-value \tabularnewline
1 & 0.144119 & 1.313 & 0.096403 \tabularnewline
2 & -0.235715 & -2.1475 & 0.017336 \tabularnewline
3 & -0.083516 & -0.7609 & 0.224447 \tabularnewline
4 & -0.176533 & -1.6083 & 0.055785 \tabularnewline
5 & 0.21181 & 1.9297 & 0.028532 \tabularnewline
6 & 0.268761 & 2.4485 & 0.008225 \tabularnewline
7 & 0.191596 & 1.7455 & 0.042297 \tabularnewline
8 & -0.048692 & -0.4436 & 0.329242 \tabularnewline
9 & 0.012224 & 0.1114 & 0.455799 \tabularnewline
10 & -0.204495 & -1.863 & 0.032997 \tabularnewline
11 & 0.19534 & 1.7796 & 0.039399 \tabularnewline
12 & 0.48409 & 4.4103 & 1.5e-05 \tabularnewline
13 & -0.060384 & -0.5501 & 0.291857 \tabularnewline
14 & 0.043125 & 0.3929 & 0.347704 \tabularnewline
15 & 0.00859 & 0.0783 & 0.468906 \tabularnewline
16 & -0.041021 & -0.3737 & 0.354784 \tabularnewline
17 & -0.060958 & -0.5554 & 0.290073 \tabularnewline
18 & -0.126714 & -1.1544 & 0.125822 \tabularnewline
19 & 0.055978 & 0.51 & 0.305709 \tabularnewline
20 & -0.154841 & -1.4107 & 0.08104 \tabularnewline
21 & -0.025479 & -0.2321 & 0.408506 \tabularnewline
22 & 0.094582 & 0.8617 & 0.195671 \tabularnewline
23 & -0.100663 & -0.9171 & 0.180879 \tabularnewline
24 & -0.000949 & -0.0086 & 0.496561 \tabularnewline
25 & 0.022393 & 0.204 & 0.419422 \tabularnewline
26 & -0.092447 & -0.8422 & 0.201039 \tabularnewline
27 & -0.044475 & -0.4052 & 0.34319 \tabularnewline
28 & -0.097613 & -0.8893 & 0.188207 \tabularnewline
29 & -0.018613 & -0.1696 & 0.432878 \tabularnewline
30 & -0.184913 & -1.6846 & 0.047908 \tabularnewline
31 & -0.089172 & -0.8124 & 0.209444 \tabularnewline
32 & -0.056094 & -0.511 & 0.30534 \tabularnewline
33 & 0.071262 & 0.6492 & 0.258992 \tabularnewline
34 & -0.079133 & -0.7209 & 0.236486 \tabularnewline
35 & 0.046562 & 0.4242 & 0.336258 \tabularnewline
36 & 0.12627 & 1.1504 & 0.126647 \tabularnewline
37 & 0.039835 & 0.3629 & 0.358795 \tabularnewline
38 & 0.002553 & 0.0233 & 0.49075 \tabularnewline
39 & -0.132182 & -1.2042 & 0.11596 \tabularnewline
40 & 0.061961 & 0.5645 & 0.286971 \tabularnewline
41 & -0.084 & -0.7653 & 0.22314 \tabularnewline
42 & 0.08899 & 0.8107 & 0.209917 \tabularnewline
43 & -0.019471 & -0.1774 & 0.429816 \tabularnewline
44 & -0.023475 & -0.2139 & 0.415588 \tabularnewline
45 & 0.056662 & 0.5162 & 0.303539 \tabularnewline
46 & 0.074265 & 0.6766 & 0.250274 \tabularnewline
47 & -0.147191 & -1.341 & 0.091794 \tabularnewline
48 & 0.02778 & 0.2531 & 0.400413 \tabularnewline
49 & -0.017395 & -0.1585 & 0.437235 \tabularnewline
50 & -0.052761 & -0.4807 & 0.316004 \tabularnewline
51 & 0.027136 & 0.2472 & 0.402675 \tabularnewline
52 & -0.083786 & -0.7633 & 0.223718 \tabularnewline
53 & 0.008051 & 0.0733 & 0.470854 \tabularnewline
54 & 0.100171 & 0.9126 & 0.182048 \tabularnewline
55 & -0.074496 & -0.6787 & 0.24961 \tabularnewline
56 & 0.080287 & 0.7314 & 0.233282 \tabularnewline
57 & -0.075196 & -0.6851 & 0.247606 \tabularnewline
58 & -0.054773 & -0.499 & 0.309547 \tabularnewline
59 & -0.066176 & -0.6029 & 0.274113 \tabularnewline
60 & -0.065682 & -0.5984 & 0.275606 \tabularnewline
\hline
\end{tabular}
%Source: https://freestatistics.org/blog/index.php?pk=34711&T=2

[TABLE]
[ROW][C]Partial Autocorrelation Function[/C][/ROW]
[ROW][C]Time lag k[/C][C]PACF(k)[/C][C]T-STAT[/C][C]P-value[/C][/ROW]
[ROW][C]1[/C][C]0.144119[/C][C]1.313[/C][C]0.096403[/C][/ROW]
[ROW][C]2[/C][C]-0.235715[/C][C]-2.1475[/C][C]0.017336[/C][/ROW]
[ROW][C]3[/C][C]-0.083516[/C][C]-0.7609[/C][C]0.224447[/C][/ROW]
[ROW][C]4[/C][C]-0.176533[/C][C]-1.6083[/C][C]0.055785[/C][/ROW]
[ROW][C]5[/C][C]0.21181[/C][C]1.9297[/C][C]0.028532[/C][/ROW]
[ROW][C]6[/C][C]0.268761[/C][C]2.4485[/C][C]0.008225[/C][/ROW]
[ROW][C]7[/C][C]0.191596[/C][C]1.7455[/C][C]0.042297[/C][/ROW]
[ROW][C]8[/C][C]-0.048692[/C][C]-0.4436[/C][C]0.329242[/C][/ROW]
[ROW][C]9[/C][C]0.012224[/C][C]0.1114[/C][C]0.455799[/C][/ROW]
[ROW][C]10[/C][C]-0.204495[/C][C]-1.863[/C][C]0.032997[/C][/ROW]
[ROW][C]11[/C][C]0.19534[/C][C]1.7796[/C][C]0.039399[/C][/ROW]
[ROW][C]12[/C][C]0.48409[/C][C]4.4103[/C][C]1.5e-05[/C][/ROW]
[ROW][C]13[/C][C]-0.060384[/C][C]-0.5501[/C][C]0.291857[/C][/ROW]
[ROW][C]14[/C][C]0.043125[/C][C]0.3929[/C][C]0.347704[/C][/ROW]
[ROW][C]15[/C][C]0.00859[/C][C]0.0783[/C][C]0.468906[/C][/ROW]
[ROW][C]16[/C][C]-0.041021[/C][C]-0.3737[/C][C]0.354784[/C][/ROW]
[ROW][C]17[/C][C]-0.060958[/C][C]-0.5554[/C][C]0.290073[/C][/ROW]
[ROW][C]18[/C][C]-0.126714[/C][C]-1.1544[/C][C]0.125822[/C][/ROW]
[ROW][C]19[/C][C]0.055978[/C][C]0.51[/C][C]0.305709[/C][/ROW]
[ROW][C]20[/C][C]-0.154841[/C][C]-1.4107[/C][C]0.08104[/C][/ROW]
[ROW][C]21[/C][C]-0.025479[/C][C]-0.2321[/C][C]0.408506[/C][/ROW]
[ROW][C]22[/C][C]0.094582[/C][C]0.8617[/C][C]0.195671[/C][/ROW]
[ROW][C]23[/C][C]-0.100663[/C][C]-0.9171[/C][C]0.180879[/C][/ROW]
[ROW][C]24[/C][C]-0.000949[/C][C]-0.0086[/C][C]0.496561[/C][/ROW]
[ROW][C]25[/C][C]0.022393[/C][C]0.204[/C][C]0.419422[/C][/ROW]
[ROW][C]26[/C][C]-0.092447[/C][C]-0.8422[/C][C]0.201039[/C][/ROW]
[ROW][C]27[/C][C]-0.044475[/C][C]-0.4052[/C][C]0.34319[/C][/ROW]
[ROW][C]28[/C][C]-0.097613[/C][C]-0.8893[/C][C]0.188207[/C][/ROW]
[ROW][C]29[/C][C]-0.018613[/C][C]-0.1696[/C][C]0.432878[/C][/ROW]
[ROW][C]30[/C][C]-0.184913[/C][C]-1.6846[/C][C]0.047908[/C][/ROW]
[ROW][C]31[/C][C]-0.089172[/C][C]-0.8124[/C][C]0.209444[/C][/ROW]
[ROW][C]32[/C][C]-0.056094[/C][C]-0.511[/C][C]0.30534[/C][/ROW]
[ROW][C]33[/C][C]0.071262[/C][C]0.6492[/C][C]0.258992[/C][/ROW]
[ROW][C]34[/C][C]-0.079133[/C][C]-0.7209[/C][C]0.236486[/C][/ROW]
[ROW][C]35[/C][C]0.046562[/C][C]0.4242[/C][C]0.336258[/C][/ROW]
[ROW][C]36[/C][C]0.12627[/C][C]1.1504[/C][C]0.126647[/C][/ROW]
[ROW][C]37[/C][C]0.039835[/C][C]0.3629[/C][C]0.358795[/C][/ROW]
[ROW][C]38[/C][C]0.002553[/C][C]0.0233[/C][C]0.49075[/C][/ROW]
[ROW][C]39[/C][C]-0.132182[/C][C]-1.2042[/C][C]0.11596[/C][/ROW]
[ROW][C]40[/C][C]0.061961[/C][C]0.5645[/C][C]0.286971[/C][/ROW]
[ROW][C]41[/C][C]-0.084[/C][C]-0.7653[/C][C]0.22314[/C][/ROW]
[ROW][C]42[/C][C]0.08899[/C][C]0.8107[/C][C]0.209917[/C][/ROW]
[ROW][C]43[/C][C]-0.019471[/C][C]-0.1774[/C][C]0.429816[/C][/ROW]
[ROW][C]44[/C][C]-0.023475[/C][C]-0.2139[/C][C]0.415588[/C][/ROW]
[ROW][C]45[/C][C]0.056662[/C][C]0.5162[/C][C]0.303539[/C][/ROW]
[ROW][C]46[/C][C]0.074265[/C][C]0.6766[/C][C]0.250274[/C][/ROW]
[ROW][C]47[/C][C]-0.147191[/C][C]-1.341[/C][C]0.091794[/C][/ROW]
[ROW][C]48[/C][C]0.02778[/C][C]0.2531[/C][C]0.400413[/C][/ROW]
[ROW][C]49[/C][C]-0.017395[/C][C]-0.1585[/C][C]0.437235[/C][/ROW]
[ROW][C]50[/C][C]-0.052761[/C][C]-0.4807[/C][C]0.316004[/C][/ROW]
[ROW][C]51[/C][C]0.027136[/C][C]0.2472[/C][C]0.402675[/C][/ROW]
[ROW][C]52[/C][C]-0.083786[/C][C]-0.7633[/C][C]0.223718[/C][/ROW]
[ROW][C]53[/C][C]0.008051[/C][C]0.0733[/C][C]0.470854[/C][/ROW]
[ROW][C]54[/C][C]0.100171[/C][C]0.9126[/C][C]0.182048[/C][/ROW]
[ROW][C]55[/C][C]-0.074496[/C][C]-0.6787[/C][C]0.24961[/C][/ROW]
[ROW][C]56[/C][C]0.080287[/C][C]0.7314[/C][C]0.233282[/C][/ROW]
[ROW][C]57[/C][C]-0.075196[/C][C]-0.6851[/C][C]0.247606[/C][/ROW]
[ROW][C]58[/C][C]-0.054773[/C][C]-0.499[/C][C]0.309547[/C][/ROW]
[ROW][C]59[/C][C]-0.066176[/C][C]-0.6029[/C][C]0.274113[/C][/ROW]
[ROW][C]60[/C][C]-0.065682[/C][C]-0.5984[/C][C]0.275606[/C][/ROW]
[/TABLE]
Source: https://freestatistics.org/blog/index.php?pk=34711&T=2

Globally Unique Identifier (entire table): ba.freestatistics.org/blog/index.php?pk=34711&T=2

As an alternative you can also use a QR Code:  

The GUIDs for individual cells are displayed in the table below:

Partial Autocorrelation Function
Time lag kPACF(k)T-STATP-value
10.1441191.3130.096403
2-0.235715-2.14750.017336
3-0.083516-0.76090.224447
4-0.176533-1.60830.055785
50.211811.92970.028532
60.2687612.44850.008225
70.1915961.74550.042297
8-0.048692-0.44360.329242
90.0122240.11140.455799
10-0.204495-1.8630.032997
110.195341.77960.039399
120.484094.41031.5e-05
13-0.060384-0.55010.291857
140.0431250.39290.347704
150.008590.07830.468906
16-0.041021-0.37370.354784
17-0.060958-0.55540.290073
18-0.126714-1.15440.125822
190.0559780.510.305709
20-0.154841-1.41070.08104
21-0.025479-0.23210.408506
220.0945820.86170.195671
23-0.100663-0.91710.180879
24-0.000949-0.00860.496561
250.0223930.2040.419422
26-0.092447-0.84220.201039
27-0.044475-0.40520.34319
28-0.097613-0.88930.188207
29-0.018613-0.16960.432878
30-0.184913-1.68460.047908
31-0.089172-0.81240.209444
32-0.056094-0.5110.30534
330.0712620.64920.258992
34-0.079133-0.72090.236486
350.0465620.42420.336258
360.126271.15040.126647
370.0398350.36290.358795
380.0025530.02330.49075
39-0.132182-1.20420.11596
400.0619610.56450.286971
41-0.084-0.76530.22314
420.088990.81070.209917
43-0.019471-0.17740.429816
44-0.023475-0.21390.415588
450.0566620.51620.303539
460.0742650.67660.250274
47-0.147191-1.3410.091794
480.027780.25310.400413
49-0.017395-0.15850.437235
50-0.052761-0.48070.316004
510.0271360.24720.402675
52-0.083786-0.76330.223718
530.0080510.07330.470854
540.1001710.91260.182048
55-0.074496-0.67870.24961
560.0802870.73140.233282
57-0.075196-0.68510.247606
58-0.054773-0.4990.309547
59-0.066176-0.60290.274113
60-0.065682-0.59840.275606


Parameters (Session):
par1 = 60 ; par2 = 1 ; par3 = 1 ; par4 = 0 ; par5 = 12 ;
Parameters (R input):
par1 = 60 ; par2 = 1 ; par3 = 1 ; par4 = 0 ; par5 = 12 ;
R code (references can be found in the software module):
if (par1 == 'Default') {
par1 = 10*log10(length(x))
} else {
par1 <- as.numeric(par1)
}
par2 <- as.numeric(par2)
par3 <- as.numeric(par3)
par4 <- as.numeric(par4)
par5 <- as.numeric(par5)
if (par2 == 0) {
x <- log(x)
} else {
x <- (x ^ par2 - 1) / par2
}
if (par3 > 0) x <- diff(x,lag=1,difference=par3)
if (par4 > 0) x <- diff(x,lag=par5,difference=par4)
bitmap(file='pic1.png')
racf <- acf(x,par1,main='Autocorrelation',xlab='lags',ylab='ACF')
dev.off()
bitmap(file='pic2.png')
rpacf <- pacf(x,par1,main='Partial Autocorrelation',xlab='lags',ylab='PACF')
dev.off()
(myacf <- c(racf$acf))
(mypacf <- c(rpacf$acf))
lengthx <- length(x)
sqrtn <- sqrt(lengthx)
load(file='createtable')
a<-table.start()
a<-table.row.start(a)
a<-table.element(a,'Autocorrelation Function',4,TRUE)
a<-table.row.end(a)
a<-table.row.start(a)
a<-table.element(a,'Time lag k',header=TRUE)
a<-table.element(a,hyperlink('basics.htm','ACF(k)','click here for more information about the Autocorrelation Function'),header=TRUE)
a<-table.element(a,'T-STAT',header=TRUE)
a<-table.element(a,'P-value',header=TRUE)
a<-table.row.end(a)
for (i in 2:(par1+1)) {
a<-table.row.start(a)
a<-table.element(a,i-1,header=TRUE)
a<-table.element(a,round(myacf[i],6))
mytstat <- myacf[i]*sqrtn
a<-table.element(a,round(mytstat,4))
a<-table.element(a,round(1-pt(abs(mytstat),lengthx),6))
a<-table.row.end(a)
}
a<-table.end(a)
table.save(a,file='mytable.tab')
a<-table.start()
a<-table.row.start(a)
a<-table.element(a,'Partial Autocorrelation Function',4,TRUE)
a<-table.row.end(a)
a<-table.row.start(a)
a<-table.element(a,'Time lag k',header=TRUE)
a<-table.element(a,hyperlink('basics.htm','PACF(k)','click here for more information about the Partial Autocorrelation Function'),header=TRUE)
a<-table.element(a,'T-STAT',header=TRUE)
a<-table.element(a,'P-value',header=TRUE)
a<-table.row.end(a)
for (i in 1:par1) {
a<-table.row.start(a)
a<-table.element(a,i,header=TRUE)
a<-table.element(a,round(mypacf[i],6))
mytstat <- mypacf[i]*sqrtn
a<-table.element(a,round(mytstat,4))
a<-table.element(a,round(1-pt(abs(mytstat),lengthx),6))
a<-table.row.end(a)
}
a<-table.end(a)
table.save(a,file='mytable1.tab')