Free Statistics

of Irreproducible Research!

Author's title

Author*The author of this computation has been verified*
R Software Modulerwasp_autocorrelation.wasp
Title produced by software(Partial) Autocorrelation Function
Date of computationThu, 18 Dec 2008 05:26:50 -0700
Cite this page as followsStatistical Computations at FreeStatistics.org, Office for Research Development and Education, URL https://freestatistics.org/blog/index.php?v=date/2008/Dec/18/t1229603393bipuds3rm9xxl4w.htm/, Retrieved Sun, 12 May 2024 09:50:39 +0000
Statistical Computations at FreeStatistics.org, Office for Research Development and Education, URL https://freestatistics.org/blog/index.php?pk=34709, Retrieved Sun, 12 May 2024 09:50:39 +0000
QR Codes:

Original text written by user:
IsPrivate?No (this computation is public)
User-defined keywords
Estimated Impact153
Family? (F = Feedback message, R = changed R code, M = changed R Module, P = changed Parameters, D = changed Data)
-       [(Partial) Autocorrelation Function] [Paper - (P)ACF] [2008-12-18 12:26:50] [c33ddd06d9ea3933c8ac89c0e74c9b3a] [Current]
Feedback Forum

Post a new message
Dataseries X:
357
363
364
363
358
357
357
380
378
376
380
379
384
392
394
392
396
392
396
419
421
420
418
410
418
426
428
430
424
423
427
441
449
452
462
455
461
461
463
462
456
455
456
472
472
471
465
459
465
468
467
463
460
462
461
476
476
471
453
443
442
444
438
427
424
416
406
431
434
418
412
404
409
412
406
398
397
385
390
413
413
401
397
397


Summary of computational transaction
Raw Inputview raw input (R code)
Raw Outputview raw output of R engine
Computing time3 seconds
R Server'Herman Ole Andreas Wold' @ 193.190.124.10:1001

\begin{tabular}{lllllllll}
\hline
Summary of computational transaction \tabularnewline
Raw Input & view raw input (R code)  \tabularnewline
Raw Output & view raw output of R engine  \tabularnewline
Computing time & 3 seconds \tabularnewline
R Server & 'Herman Ole Andreas Wold' @ 193.190.124.10:1001 \tabularnewline
\hline
\end{tabular}
%Source: https://freestatistics.org/blog/index.php?pk=34709&T=0

[TABLE]
[ROW][C]Summary of computational transaction[/C][/ROW]
[ROW][C]Raw Input[/C][C]view raw input (R code) [/C][/ROW]
[ROW][C]Raw Output[/C][C]view raw output of R engine [/C][/ROW]
[ROW][C]Computing time[/C][C]3 seconds[/C][/ROW]
[ROW][C]R Server[/C][C]'Herman Ole Andreas Wold' @ 193.190.124.10:1001[/C][/ROW]
[/TABLE]
Source: https://freestatistics.org/blog/index.php?pk=34709&T=0

Globally Unique Identifier (entire table): ba.freestatistics.org/blog/index.php?pk=34709&T=0

As an alternative you can also use a QR Code:  

The GUIDs for individual cells are displayed in the table below:

Summary of computational transaction
Raw Inputview raw input (R code)
Raw Outputview raw output of R engine
Computing time3 seconds
R Server'Herman Ole Andreas Wold' @ 193.190.124.10:1001


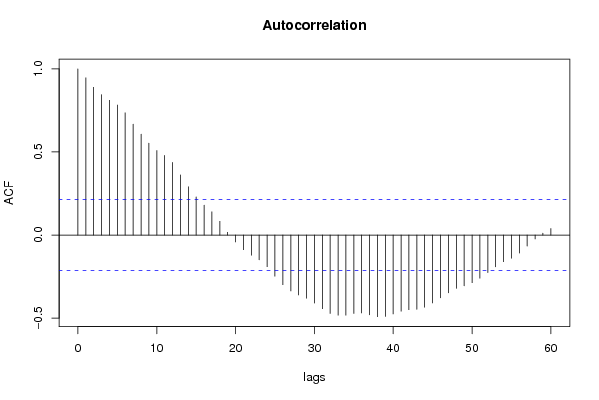
Autocorrelation Function
Time lag kACF(k)T-STATP-value
10.9467878.67740
20.8894528.1520
30.8452787.74710
40.8115597.43810
50.7825837.17250
60.7361156.74660
70.6674436.11720
80.6069495.56280
90.5527075.06561e-06
100.5084124.65976e-06
110.4794584.39431.6e-05
120.4371684.00676.6e-05
130.3616923.3150.000677
140.2902672.66030.004674
150.2295292.10370.019199
160.1794021.64420.051931
170.1398461.28170.101735
180.0828920.75970.224774
190.0164140.15040.440389
20-0.041826-0.38330.351217
21-0.088302-0.80930.210314
22-0.121231-1.11110.134847
23-0.148898-1.36470.088
24-0.190449-1.74550.042278
25-0.247487-2.26830.012939
26-0.299204-2.74220.003728
27-0.336244-3.08170.001391
28-0.360669-3.30560.000698
29-0.3804-3.48640.000391
30-0.409545-3.75350.00016
31-0.443229-4.06235.4e-05
32-0.472026-4.32622.1e-05
33-0.482761-4.42461.4e-05
34-0.482859-4.42551.4e-05
35-0.471716-4.32332.1e-05
36-0.469093-4.29932.3e-05
37-0.480571-4.40451.6e-05
38-0.491431-4.5041.1e-05
39-0.489942-4.49041.1e-05
40-0.475128-4.35461.9e-05
41-0.458678-4.20393.3e-05
42-0.449816-4.12264.4e-05
43-0.447377-4.10034.7e-05
44-0.434842-3.98547.1e-05
45-0.409159-3.750.000162
46-0.37793-3.46380.00042
47-0.347875-3.18830.001005
48-0.321151-2.94340.002098
49-0.305448-2.79950.003174
50-0.286638-2.62710.005117
51-0.259534-2.37870.009822
52-0.226072-2.0720.020667
53-0.191687-1.75680.041294
54-0.160304-1.46920.072756
55-0.139552-1.2790.102207
56-0.10852-0.99460.161394
57-0.066449-0.6090.272078
58-0.023843-0.21850.413776
590.0114590.1050.458305
600.0392270.35950.360055

\begin{tabular}{lllllllll}
\hline
Autocorrelation Function \tabularnewline
Time lag k & ACF(k) & T-STAT & P-value \tabularnewline
1 & 0.946787 & 8.6774 & 0 \tabularnewline
2 & 0.889452 & 8.152 & 0 \tabularnewline
3 & 0.845278 & 7.7471 & 0 \tabularnewline
4 & 0.811559 & 7.4381 & 0 \tabularnewline
5 & 0.782583 & 7.1725 & 0 \tabularnewline
6 & 0.736115 & 6.7466 & 0 \tabularnewline
7 & 0.667443 & 6.1172 & 0 \tabularnewline
8 & 0.606949 & 5.5628 & 0 \tabularnewline
9 & 0.552707 & 5.0656 & 1e-06 \tabularnewline
10 & 0.508412 & 4.6597 & 6e-06 \tabularnewline
11 & 0.479458 & 4.3943 & 1.6e-05 \tabularnewline
12 & 0.437168 & 4.0067 & 6.6e-05 \tabularnewline
13 & 0.361692 & 3.315 & 0.000677 \tabularnewline
14 & 0.290267 & 2.6603 & 0.004674 \tabularnewline
15 & 0.229529 & 2.1037 & 0.019199 \tabularnewline
16 & 0.179402 & 1.6442 & 0.051931 \tabularnewline
17 & 0.139846 & 1.2817 & 0.101735 \tabularnewline
18 & 0.082892 & 0.7597 & 0.224774 \tabularnewline
19 & 0.016414 & 0.1504 & 0.440389 \tabularnewline
20 & -0.041826 & -0.3833 & 0.351217 \tabularnewline
21 & -0.088302 & -0.8093 & 0.210314 \tabularnewline
22 & -0.121231 & -1.1111 & 0.134847 \tabularnewline
23 & -0.148898 & -1.3647 & 0.088 \tabularnewline
24 & -0.190449 & -1.7455 & 0.042278 \tabularnewline
25 & -0.247487 & -2.2683 & 0.012939 \tabularnewline
26 & -0.299204 & -2.7422 & 0.003728 \tabularnewline
27 & -0.336244 & -3.0817 & 0.001391 \tabularnewline
28 & -0.360669 & -3.3056 & 0.000698 \tabularnewline
29 & -0.3804 & -3.4864 & 0.000391 \tabularnewline
30 & -0.409545 & -3.7535 & 0.00016 \tabularnewline
31 & -0.443229 & -4.0623 & 5.4e-05 \tabularnewline
32 & -0.472026 & -4.3262 & 2.1e-05 \tabularnewline
33 & -0.482761 & -4.4246 & 1.4e-05 \tabularnewline
34 & -0.482859 & -4.4255 & 1.4e-05 \tabularnewline
35 & -0.471716 & -4.3233 & 2.1e-05 \tabularnewline
36 & -0.469093 & -4.2993 & 2.3e-05 \tabularnewline
37 & -0.480571 & -4.4045 & 1.6e-05 \tabularnewline
38 & -0.491431 & -4.504 & 1.1e-05 \tabularnewline
39 & -0.489942 & -4.4904 & 1.1e-05 \tabularnewline
40 & -0.475128 & -4.3546 & 1.9e-05 \tabularnewline
41 & -0.458678 & -4.2039 & 3.3e-05 \tabularnewline
42 & -0.449816 & -4.1226 & 4.4e-05 \tabularnewline
43 & -0.447377 & -4.1003 & 4.7e-05 \tabularnewline
44 & -0.434842 & -3.9854 & 7.1e-05 \tabularnewline
45 & -0.409159 & -3.75 & 0.000162 \tabularnewline
46 & -0.37793 & -3.4638 & 0.00042 \tabularnewline
47 & -0.347875 & -3.1883 & 0.001005 \tabularnewline
48 & -0.321151 & -2.9434 & 0.002098 \tabularnewline
49 & -0.305448 & -2.7995 & 0.003174 \tabularnewline
50 & -0.286638 & -2.6271 & 0.005117 \tabularnewline
51 & -0.259534 & -2.3787 & 0.009822 \tabularnewline
52 & -0.226072 & -2.072 & 0.020667 \tabularnewline
53 & -0.191687 & -1.7568 & 0.041294 \tabularnewline
54 & -0.160304 & -1.4692 & 0.072756 \tabularnewline
55 & -0.139552 & -1.279 & 0.102207 \tabularnewline
56 & -0.10852 & -0.9946 & 0.161394 \tabularnewline
57 & -0.066449 & -0.609 & 0.272078 \tabularnewline
58 & -0.023843 & -0.2185 & 0.413776 \tabularnewline
59 & 0.011459 & 0.105 & 0.458305 \tabularnewline
60 & 0.039227 & 0.3595 & 0.360055 \tabularnewline
\hline
\end{tabular}
%Source: https://freestatistics.org/blog/index.php?pk=34709&T=1

[TABLE]
[ROW][C]Autocorrelation Function[/C][/ROW]
[ROW][C]Time lag k[/C][C]ACF(k)[/C][C]T-STAT[/C][C]P-value[/C][/ROW]
[ROW][C]1[/C][C]0.946787[/C][C]8.6774[/C][C]0[/C][/ROW]
[ROW][C]2[/C][C]0.889452[/C][C]8.152[/C][C]0[/C][/ROW]
[ROW][C]3[/C][C]0.845278[/C][C]7.7471[/C][C]0[/C][/ROW]
[ROW][C]4[/C][C]0.811559[/C][C]7.4381[/C][C]0[/C][/ROW]
[ROW][C]5[/C][C]0.782583[/C][C]7.1725[/C][C]0[/C][/ROW]
[ROW][C]6[/C][C]0.736115[/C][C]6.7466[/C][C]0[/C][/ROW]
[ROW][C]7[/C][C]0.667443[/C][C]6.1172[/C][C]0[/C][/ROW]
[ROW][C]8[/C][C]0.606949[/C][C]5.5628[/C][C]0[/C][/ROW]
[ROW][C]9[/C][C]0.552707[/C][C]5.0656[/C][C]1e-06[/C][/ROW]
[ROW][C]10[/C][C]0.508412[/C][C]4.6597[/C][C]6e-06[/C][/ROW]
[ROW][C]11[/C][C]0.479458[/C][C]4.3943[/C][C]1.6e-05[/C][/ROW]
[ROW][C]12[/C][C]0.437168[/C][C]4.0067[/C][C]6.6e-05[/C][/ROW]
[ROW][C]13[/C][C]0.361692[/C][C]3.315[/C][C]0.000677[/C][/ROW]
[ROW][C]14[/C][C]0.290267[/C][C]2.6603[/C][C]0.004674[/C][/ROW]
[ROW][C]15[/C][C]0.229529[/C][C]2.1037[/C][C]0.019199[/C][/ROW]
[ROW][C]16[/C][C]0.179402[/C][C]1.6442[/C][C]0.051931[/C][/ROW]
[ROW][C]17[/C][C]0.139846[/C][C]1.2817[/C][C]0.101735[/C][/ROW]
[ROW][C]18[/C][C]0.082892[/C][C]0.7597[/C][C]0.224774[/C][/ROW]
[ROW][C]19[/C][C]0.016414[/C][C]0.1504[/C][C]0.440389[/C][/ROW]
[ROW][C]20[/C][C]-0.041826[/C][C]-0.3833[/C][C]0.351217[/C][/ROW]
[ROW][C]21[/C][C]-0.088302[/C][C]-0.8093[/C][C]0.210314[/C][/ROW]
[ROW][C]22[/C][C]-0.121231[/C][C]-1.1111[/C][C]0.134847[/C][/ROW]
[ROW][C]23[/C][C]-0.148898[/C][C]-1.3647[/C][C]0.088[/C][/ROW]
[ROW][C]24[/C][C]-0.190449[/C][C]-1.7455[/C][C]0.042278[/C][/ROW]
[ROW][C]25[/C][C]-0.247487[/C][C]-2.2683[/C][C]0.012939[/C][/ROW]
[ROW][C]26[/C][C]-0.299204[/C][C]-2.7422[/C][C]0.003728[/C][/ROW]
[ROW][C]27[/C][C]-0.336244[/C][C]-3.0817[/C][C]0.001391[/C][/ROW]
[ROW][C]28[/C][C]-0.360669[/C][C]-3.3056[/C][C]0.000698[/C][/ROW]
[ROW][C]29[/C][C]-0.3804[/C][C]-3.4864[/C][C]0.000391[/C][/ROW]
[ROW][C]30[/C][C]-0.409545[/C][C]-3.7535[/C][C]0.00016[/C][/ROW]
[ROW][C]31[/C][C]-0.443229[/C][C]-4.0623[/C][C]5.4e-05[/C][/ROW]
[ROW][C]32[/C][C]-0.472026[/C][C]-4.3262[/C][C]2.1e-05[/C][/ROW]
[ROW][C]33[/C][C]-0.482761[/C][C]-4.4246[/C][C]1.4e-05[/C][/ROW]
[ROW][C]34[/C][C]-0.482859[/C][C]-4.4255[/C][C]1.4e-05[/C][/ROW]
[ROW][C]35[/C][C]-0.471716[/C][C]-4.3233[/C][C]2.1e-05[/C][/ROW]
[ROW][C]36[/C][C]-0.469093[/C][C]-4.2993[/C][C]2.3e-05[/C][/ROW]
[ROW][C]37[/C][C]-0.480571[/C][C]-4.4045[/C][C]1.6e-05[/C][/ROW]
[ROW][C]38[/C][C]-0.491431[/C][C]-4.504[/C][C]1.1e-05[/C][/ROW]
[ROW][C]39[/C][C]-0.489942[/C][C]-4.4904[/C][C]1.1e-05[/C][/ROW]
[ROW][C]40[/C][C]-0.475128[/C][C]-4.3546[/C][C]1.9e-05[/C][/ROW]
[ROW][C]41[/C][C]-0.458678[/C][C]-4.2039[/C][C]3.3e-05[/C][/ROW]
[ROW][C]42[/C][C]-0.449816[/C][C]-4.1226[/C][C]4.4e-05[/C][/ROW]
[ROW][C]43[/C][C]-0.447377[/C][C]-4.1003[/C][C]4.7e-05[/C][/ROW]
[ROW][C]44[/C][C]-0.434842[/C][C]-3.9854[/C][C]7.1e-05[/C][/ROW]
[ROW][C]45[/C][C]-0.409159[/C][C]-3.75[/C][C]0.000162[/C][/ROW]
[ROW][C]46[/C][C]-0.37793[/C][C]-3.4638[/C][C]0.00042[/C][/ROW]
[ROW][C]47[/C][C]-0.347875[/C][C]-3.1883[/C][C]0.001005[/C][/ROW]
[ROW][C]48[/C][C]-0.321151[/C][C]-2.9434[/C][C]0.002098[/C][/ROW]
[ROW][C]49[/C][C]-0.305448[/C][C]-2.7995[/C][C]0.003174[/C][/ROW]
[ROW][C]50[/C][C]-0.286638[/C][C]-2.6271[/C][C]0.005117[/C][/ROW]
[ROW][C]51[/C][C]-0.259534[/C][C]-2.3787[/C][C]0.009822[/C][/ROW]
[ROW][C]52[/C][C]-0.226072[/C][C]-2.072[/C][C]0.020667[/C][/ROW]
[ROW][C]53[/C][C]-0.191687[/C][C]-1.7568[/C][C]0.041294[/C][/ROW]
[ROW][C]54[/C][C]-0.160304[/C][C]-1.4692[/C][C]0.072756[/C][/ROW]
[ROW][C]55[/C][C]-0.139552[/C][C]-1.279[/C][C]0.102207[/C][/ROW]
[ROW][C]56[/C][C]-0.10852[/C][C]-0.9946[/C][C]0.161394[/C][/ROW]
[ROW][C]57[/C][C]-0.066449[/C][C]-0.609[/C][C]0.272078[/C][/ROW]
[ROW][C]58[/C][C]-0.023843[/C][C]-0.2185[/C][C]0.413776[/C][/ROW]
[ROW][C]59[/C][C]0.011459[/C][C]0.105[/C][C]0.458305[/C][/ROW]
[ROW][C]60[/C][C]0.039227[/C][C]0.3595[/C][C]0.360055[/C][/ROW]
[/TABLE]
Source: https://freestatistics.org/blog/index.php?pk=34709&T=1

Globally Unique Identifier (entire table): ba.freestatistics.org/blog/index.php?pk=34709&T=1

As an alternative you can also use a QR Code:  

The GUIDs for individual cells are displayed in the table below:

Autocorrelation Function
Time lag kACF(k)T-STATP-value
10.9467878.67740
20.8894528.1520
30.8452787.74710
40.8115597.43810
50.7825837.17250
60.7361156.74660
70.6674436.11720
80.6069495.56280
90.5527075.06561e-06
100.5084124.65976e-06
110.4794584.39431.6e-05
120.4371684.00676.6e-05
130.3616923.3150.000677
140.2902672.66030.004674
150.2295292.10370.019199
160.1794021.64420.051931
170.1398461.28170.101735
180.0828920.75970.224774
190.0164140.15040.440389
20-0.041826-0.38330.351217
21-0.088302-0.80930.210314
22-0.121231-1.11110.134847
23-0.148898-1.36470.088
24-0.190449-1.74550.042278
25-0.247487-2.26830.012939
26-0.299204-2.74220.003728
27-0.336244-3.08170.001391
28-0.360669-3.30560.000698
29-0.3804-3.48640.000391
30-0.409545-3.75350.00016
31-0.443229-4.06235.4e-05
32-0.472026-4.32622.1e-05
33-0.482761-4.42461.4e-05
34-0.482859-4.42551.4e-05
35-0.471716-4.32332.1e-05
36-0.469093-4.29932.3e-05
37-0.480571-4.40451.6e-05
38-0.491431-4.5041.1e-05
39-0.489942-4.49041.1e-05
40-0.475128-4.35461.9e-05
41-0.458678-4.20393.3e-05
42-0.449816-4.12264.4e-05
43-0.447377-4.10034.7e-05
44-0.434842-3.98547.1e-05
45-0.409159-3.750.000162
46-0.37793-3.46380.00042
47-0.347875-3.18830.001005
48-0.321151-2.94340.002098
49-0.305448-2.79950.003174
50-0.286638-2.62710.005117
51-0.259534-2.37870.009822
52-0.226072-2.0720.020667
53-0.191687-1.75680.041294
54-0.160304-1.46920.072756
55-0.139552-1.2790.102207
56-0.10852-0.99460.161394
57-0.066449-0.6090.272078
58-0.023843-0.21850.413776
590.0114590.1050.458305
600.0392270.35950.360055


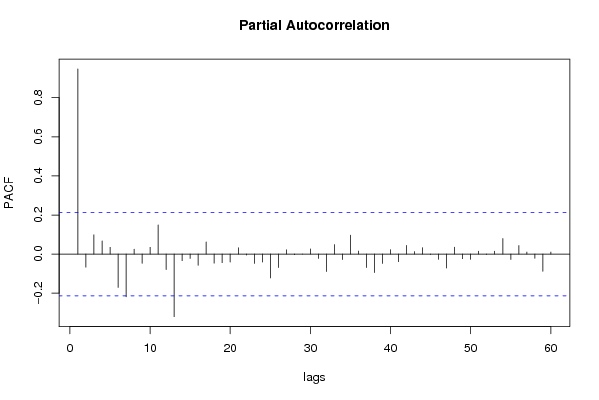
Partial Autocorrelation Function
Time lag kPACF(k)T-STATP-value
10.9467878.67740
2-0.06713-0.61530.270026
30.0987330.90490.184053
40.0674770.61840.268981
50.0347480.31850.375458
6-0.17008-1.55880.0614
7-0.218207-1.99990.024371
80.0251330.23030.409192
9-0.046846-0.42940.334383
100.0346160.31730.375916
110.1494381.36960.087228
12-0.078713-0.72140.236329
13-0.319752-2.93060.002178
14-0.033464-0.30670.379915
15-0.022111-0.20260.41995
16-0.05741-0.52620.300079
170.0625150.5730.284101
18-0.046375-0.4250.335948
19-0.043689-0.40040.344932
20-0.040948-0.37530.354192
210.0319850.29310.385066
22-0.004623-0.04240.48315
23-0.047572-0.4360.331975
24-0.040827-0.37420.354605
25-0.122046-1.11860.133256
26-0.068721-0.62980.265254
270.0218010.19980.421056
28-0.00315-0.02890.488519
290.0002380.00220.499134
300.0263910.24190.404734
31-0.022228-0.20370.419532
32-0.089031-0.8160.208409
330.0485890.44530.328615
34-0.027876-0.25550.399484
350.096710.88640.188977
360.0155320.14230.443573
37-0.068474-0.62760.265992
38-0.094033-0.86180.195619
39-0.04737-0.43420.332645
400.0229490.21030.416959
41-0.038853-0.35610.361332
420.0441630.40480.343342
430.0133950.12280.451291
440.0330180.30260.381466
45-0.00198-0.01810.492784
46-0.026389-0.24190.40474
47-0.071595-0.65620.25675
480.0353970.32440.373214
49-0.023145-0.21210.41626
50-0.026824-0.24580.403202
510.0150850.13830.445185
52-0.001621-0.01490.494091
530.0151870.13920.444816
540.0794730.72840.234202
55-0.02701-0.24760.402543
560.0436460.40.345078
570.0105710.09690.461523
58-0.021722-0.19910.421338
59-0.088156-0.8080.210698
600.0104140.09540.462093

\begin{tabular}{lllllllll}
\hline
Partial Autocorrelation Function \tabularnewline
Time lag k & PACF(k) & T-STAT & P-value \tabularnewline
1 & 0.946787 & 8.6774 & 0 \tabularnewline
2 & -0.06713 & -0.6153 & 0.270026 \tabularnewline
3 & 0.098733 & 0.9049 & 0.184053 \tabularnewline
4 & 0.067477 & 0.6184 & 0.268981 \tabularnewline
5 & 0.034748 & 0.3185 & 0.375458 \tabularnewline
6 & -0.17008 & -1.5588 & 0.0614 \tabularnewline
7 & -0.218207 & -1.9999 & 0.024371 \tabularnewline
8 & 0.025133 & 0.2303 & 0.409192 \tabularnewline
9 & -0.046846 & -0.4294 & 0.334383 \tabularnewline
10 & 0.034616 & 0.3173 & 0.375916 \tabularnewline
11 & 0.149438 & 1.3696 & 0.087228 \tabularnewline
12 & -0.078713 & -0.7214 & 0.236329 \tabularnewline
13 & -0.319752 & -2.9306 & 0.002178 \tabularnewline
14 & -0.033464 & -0.3067 & 0.379915 \tabularnewline
15 & -0.022111 & -0.2026 & 0.41995 \tabularnewline
16 & -0.05741 & -0.5262 & 0.300079 \tabularnewline
17 & 0.062515 & 0.573 & 0.284101 \tabularnewline
18 & -0.046375 & -0.425 & 0.335948 \tabularnewline
19 & -0.043689 & -0.4004 & 0.344932 \tabularnewline
20 & -0.040948 & -0.3753 & 0.354192 \tabularnewline
21 & 0.031985 & 0.2931 & 0.385066 \tabularnewline
22 & -0.004623 & -0.0424 & 0.48315 \tabularnewline
23 & -0.047572 & -0.436 & 0.331975 \tabularnewline
24 & -0.040827 & -0.3742 & 0.354605 \tabularnewline
25 & -0.122046 & -1.1186 & 0.133256 \tabularnewline
26 & -0.068721 & -0.6298 & 0.265254 \tabularnewline
27 & 0.021801 & 0.1998 & 0.421056 \tabularnewline
28 & -0.00315 & -0.0289 & 0.488519 \tabularnewline
29 & 0.000238 & 0.0022 & 0.499134 \tabularnewline
30 & 0.026391 & 0.2419 & 0.404734 \tabularnewline
31 & -0.022228 & -0.2037 & 0.419532 \tabularnewline
32 & -0.089031 & -0.816 & 0.208409 \tabularnewline
33 & 0.048589 & 0.4453 & 0.328615 \tabularnewline
34 & -0.027876 & -0.2555 & 0.399484 \tabularnewline
35 & 0.09671 & 0.8864 & 0.188977 \tabularnewline
36 & 0.015532 & 0.1423 & 0.443573 \tabularnewline
37 & -0.068474 & -0.6276 & 0.265992 \tabularnewline
38 & -0.094033 & -0.8618 & 0.195619 \tabularnewline
39 & -0.04737 & -0.4342 & 0.332645 \tabularnewline
40 & 0.022949 & 0.2103 & 0.416959 \tabularnewline
41 & -0.038853 & -0.3561 & 0.361332 \tabularnewline
42 & 0.044163 & 0.4048 & 0.343342 \tabularnewline
43 & 0.013395 & 0.1228 & 0.451291 \tabularnewline
44 & 0.033018 & 0.3026 & 0.381466 \tabularnewline
45 & -0.00198 & -0.0181 & 0.492784 \tabularnewline
46 & -0.026389 & -0.2419 & 0.40474 \tabularnewline
47 & -0.071595 & -0.6562 & 0.25675 \tabularnewline
48 & 0.035397 & 0.3244 & 0.373214 \tabularnewline
49 & -0.023145 & -0.2121 & 0.41626 \tabularnewline
50 & -0.026824 & -0.2458 & 0.403202 \tabularnewline
51 & 0.015085 & 0.1383 & 0.445185 \tabularnewline
52 & -0.001621 & -0.0149 & 0.494091 \tabularnewline
53 & 0.015187 & 0.1392 & 0.444816 \tabularnewline
54 & 0.079473 & 0.7284 & 0.234202 \tabularnewline
55 & -0.02701 & -0.2476 & 0.402543 \tabularnewline
56 & 0.043646 & 0.4 & 0.345078 \tabularnewline
57 & 0.010571 & 0.0969 & 0.461523 \tabularnewline
58 & -0.021722 & -0.1991 & 0.421338 \tabularnewline
59 & -0.088156 & -0.808 & 0.210698 \tabularnewline
60 & 0.010414 & 0.0954 & 0.462093 \tabularnewline
\hline
\end{tabular}
%Source: https://freestatistics.org/blog/index.php?pk=34709&T=2

[TABLE]
[ROW][C]Partial Autocorrelation Function[/C][/ROW]
[ROW][C]Time lag k[/C][C]PACF(k)[/C][C]T-STAT[/C][C]P-value[/C][/ROW]
[ROW][C]1[/C][C]0.946787[/C][C]8.6774[/C][C]0[/C][/ROW]
[ROW][C]2[/C][C]-0.06713[/C][C]-0.6153[/C][C]0.270026[/C][/ROW]
[ROW][C]3[/C][C]0.098733[/C][C]0.9049[/C][C]0.184053[/C][/ROW]
[ROW][C]4[/C][C]0.067477[/C][C]0.6184[/C][C]0.268981[/C][/ROW]
[ROW][C]5[/C][C]0.034748[/C][C]0.3185[/C][C]0.375458[/C][/ROW]
[ROW][C]6[/C][C]-0.17008[/C][C]-1.5588[/C][C]0.0614[/C][/ROW]
[ROW][C]7[/C][C]-0.218207[/C][C]-1.9999[/C][C]0.024371[/C][/ROW]
[ROW][C]8[/C][C]0.025133[/C][C]0.2303[/C][C]0.409192[/C][/ROW]
[ROW][C]9[/C][C]-0.046846[/C][C]-0.4294[/C][C]0.334383[/C][/ROW]
[ROW][C]10[/C][C]0.034616[/C][C]0.3173[/C][C]0.375916[/C][/ROW]
[ROW][C]11[/C][C]0.149438[/C][C]1.3696[/C][C]0.087228[/C][/ROW]
[ROW][C]12[/C][C]-0.078713[/C][C]-0.7214[/C][C]0.236329[/C][/ROW]
[ROW][C]13[/C][C]-0.319752[/C][C]-2.9306[/C][C]0.002178[/C][/ROW]
[ROW][C]14[/C][C]-0.033464[/C][C]-0.3067[/C][C]0.379915[/C][/ROW]
[ROW][C]15[/C][C]-0.022111[/C][C]-0.2026[/C][C]0.41995[/C][/ROW]
[ROW][C]16[/C][C]-0.05741[/C][C]-0.5262[/C][C]0.300079[/C][/ROW]
[ROW][C]17[/C][C]0.062515[/C][C]0.573[/C][C]0.284101[/C][/ROW]
[ROW][C]18[/C][C]-0.046375[/C][C]-0.425[/C][C]0.335948[/C][/ROW]
[ROW][C]19[/C][C]-0.043689[/C][C]-0.4004[/C][C]0.344932[/C][/ROW]
[ROW][C]20[/C][C]-0.040948[/C][C]-0.3753[/C][C]0.354192[/C][/ROW]
[ROW][C]21[/C][C]0.031985[/C][C]0.2931[/C][C]0.385066[/C][/ROW]
[ROW][C]22[/C][C]-0.004623[/C][C]-0.0424[/C][C]0.48315[/C][/ROW]
[ROW][C]23[/C][C]-0.047572[/C][C]-0.436[/C][C]0.331975[/C][/ROW]
[ROW][C]24[/C][C]-0.040827[/C][C]-0.3742[/C][C]0.354605[/C][/ROW]
[ROW][C]25[/C][C]-0.122046[/C][C]-1.1186[/C][C]0.133256[/C][/ROW]
[ROW][C]26[/C][C]-0.068721[/C][C]-0.6298[/C][C]0.265254[/C][/ROW]
[ROW][C]27[/C][C]0.021801[/C][C]0.1998[/C][C]0.421056[/C][/ROW]
[ROW][C]28[/C][C]-0.00315[/C][C]-0.0289[/C][C]0.488519[/C][/ROW]
[ROW][C]29[/C][C]0.000238[/C][C]0.0022[/C][C]0.499134[/C][/ROW]
[ROW][C]30[/C][C]0.026391[/C][C]0.2419[/C][C]0.404734[/C][/ROW]
[ROW][C]31[/C][C]-0.022228[/C][C]-0.2037[/C][C]0.419532[/C][/ROW]
[ROW][C]32[/C][C]-0.089031[/C][C]-0.816[/C][C]0.208409[/C][/ROW]
[ROW][C]33[/C][C]0.048589[/C][C]0.4453[/C][C]0.328615[/C][/ROW]
[ROW][C]34[/C][C]-0.027876[/C][C]-0.2555[/C][C]0.399484[/C][/ROW]
[ROW][C]35[/C][C]0.09671[/C][C]0.8864[/C][C]0.188977[/C][/ROW]
[ROW][C]36[/C][C]0.015532[/C][C]0.1423[/C][C]0.443573[/C][/ROW]
[ROW][C]37[/C][C]-0.068474[/C][C]-0.6276[/C][C]0.265992[/C][/ROW]
[ROW][C]38[/C][C]-0.094033[/C][C]-0.8618[/C][C]0.195619[/C][/ROW]
[ROW][C]39[/C][C]-0.04737[/C][C]-0.4342[/C][C]0.332645[/C][/ROW]
[ROW][C]40[/C][C]0.022949[/C][C]0.2103[/C][C]0.416959[/C][/ROW]
[ROW][C]41[/C][C]-0.038853[/C][C]-0.3561[/C][C]0.361332[/C][/ROW]
[ROW][C]42[/C][C]0.044163[/C][C]0.4048[/C][C]0.343342[/C][/ROW]
[ROW][C]43[/C][C]0.013395[/C][C]0.1228[/C][C]0.451291[/C][/ROW]
[ROW][C]44[/C][C]0.033018[/C][C]0.3026[/C][C]0.381466[/C][/ROW]
[ROW][C]45[/C][C]-0.00198[/C][C]-0.0181[/C][C]0.492784[/C][/ROW]
[ROW][C]46[/C][C]-0.026389[/C][C]-0.2419[/C][C]0.40474[/C][/ROW]
[ROW][C]47[/C][C]-0.071595[/C][C]-0.6562[/C][C]0.25675[/C][/ROW]
[ROW][C]48[/C][C]0.035397[/C][C]0.3244[/C][C]0.373214[/C][/ROW]
[ROW][C]49[/C][C]-0.023145[/C][C]-0.2121[/C][C]0.41626[/C][/ROW]
[ROW][C]50[/C][C]-0.026824[/C][C]-0.2458[/C][C]0.403202[/C][/ROW]
[ROW][C]51[/C][C]0.015085[/C][C]0.1383[/C][C]0.445185[/C][/ROW]
[ROW][C]52[/C][C]-0.001621[/C][C]-0.0149[/C][C]0.494091[/C][/ROW]
[ROW][C]53[/C][C]0.015187[/C][C]0.1392[/C][C]0.444816[/C][/ROW]
[ROW][C]54[/C][C]0.079473[/C][C]0.7284[/C][C]0.234202[/C][/ROW]
[ROW][C]55[/C][C]-0.02701[/C][C]-0.2476[/C][C]0.402543[/C][/ROW]
[ROW][C]56[/C][C]0.043646[/C][C]0.4[/C][C]0.345078[/C][/ROW]
[ROW][C]57[/C][C]0.010571[/C][C]0.0969[/C][C]0.461523[/C][/ROW]
[ROW][C]58[/C][C]-0.021722[/C][C]-0.1991[/C][C]0.421338[/C][/ROW]
[ROW][C]59[/C][C]-0.088156[/C][C]-0.808[/C][C]0.210698[/C][/ROW]
[ROW][C]60[/C][C]0.010414[/C][C]0.0954[/C][C]0.462093[/C][/ROW]
[/TABLE]
Source: https://freestatistics.org/blog/index.php?pk=34709&T=2

Globally Unique Identifier (entire table): ba.freestatistics.org/blog/index.php?pk=34709&T=2

As an alternative you can also use a QR Code:  

The GUIDs for individual cells are displayed in the table below:

Partial Autocorrelation Function
Time lag kPACF(k)T-STATP-value
10.9467878.67740
2-0.06713-0.61530.270026
30.0987330.90490.184053
40.0674770.61840.268981
50.0347480.31850.375458
6-0.17008-1.55880.0614
7-0.218207-1.99990.024371
80.0251330.23030.409192
9-0.046846-0.42940.334383
100.0346160.31730.375916
110.1494381.36960.087228
12-0.078713-0.72140.236329
13-0.319752-2.93060.002178
14-0.033464-0.30670.379915
15-0.022111-0.20260.41995
16-0.05741-0.52620.300079
170.0625150.5730.284101
18-0.046375-0.4250.335948
19-0.043689-0.40040.344932
20-0.040948-0.37530.354192
210.0319850.29310.385066
22-0.004623-0.04240.48315
23-0.047572-0.4360.331975
24-0.040827-0.37420.354605
25-0.122046-1.11860.133256
26-0.068721-0.62980.265254
270.0218010.19980.421056
28-0.00315-0.02890.488519
290.0002380.00220.499134
300.0263910.24190.404734
31-0.022228-0.20370.419532
32-0.089031-0.8160.208409
330.0485890.44530.328615
34-0.027876-0.25550.399484
350.096710.88640.188977
360.0155320.14230.443573
37-0.068474-0.62760.265992
38-0.094033-0.86180.195619
39-0.04737-0.43420.332645
400.0229490.21030.416959
41-0.038853-0.35610.361332
420.0441630.40480.343342
430.0133950.12280.451291
440.0330180.30260.381466
45-0.00198-0.01810.492784
46-0.026389-0.24190.40474
47-0.071595-0.65620.25675
480.0353970.32440.373214
49-0.023145-0.21210.41626
50-0.026824-0.24580.403202
510.0150850.13830.445185
52-0.001621-0.01490.494091
530.0151870.13920.444816
540.0794730.72840.234202
55-0.02701-0.24760.402543
560.0436460.40.345078
570.0105710.09690.461523
58-0.021722-0.19910.421338
59-0.088156-0.8080.210698
600.0104140.09540.462093


Parameters (Session):
par1 = 60 ; par2 = 1 ; par3 = 0 ; par4 = 0 ; par5 = 12 ;
Parameters (R input):
par1 = 60 ; par2 = 1 ; par3 = 0 ; par4 = 0 ; par5 = 12 ;
R code (references can be found in the software module):
if (par1 == 'Default') {
par1 = 10*log10(length(x))
} else {
par1 <- as.numeric(par1)
}
par2 <- as.numeric(par2)
par3 <- as.numeric(par3)
par4 <- as.numeric(par4)
par5 <- as.numeric(par5)
if (par2 == 0) {
x <- log(x)
} else {
x <- (x ^ par2 - 1) / par2
}
if (par3 > 0) x <- diff(x,lag=1,difference=par3)
if (par4 > 0) x <- diff(x,lag=par5,difference=par4)
bitmap(file='pic1.png')
racf <- acf(x,par1,main='Autocorrelation',xlab='lags',ylab='ACF')
dev.off()
bitmap(file='pic2.png')
rpacf <- pacf(x,par1,main='Partial Autocorrelation',xlab='lags',ylab='PACF')
dev.off()
(myacf <- c(racf$acf))
(mypacf <- c(rpacf$acf))
lengthx <- length(x)
sqrtn <- sqrt(lengthx)
load(file='createtable')
a<-table.start()
a<-table.row.start(a)
a<-table.element(a,'Autocorrelation Function',4,TRUE)
a<-table.row.end(a)
a<-table.row.start(a)
a<-table.element(a,'Time lag k',header=TRUE)
a<-table.element(a,hyperlink('basics.htm','ACF(k)','click here for more information about the Autocorrelation Function'),header=TRUE)
a<-table.element(a,'T-STAT',header=TRUE)
a<-table.element(a,'P-value',header=TRUE)
a<-table.row.end(a)
for (i in 2:(par1+1)) {
a<-table.row.start(a)
a<-table.element(a,i-1,header=TRUE)
a<-table.element(a,round(myacf[i],6))
mytstat <- myacf[i]*sqrtn
a<-table.element(a,round(mytstat,4))
a<-table.element(a,round(1-pt(abs(mytstat),lengthx),6))
a<-table.row.end(a)
}
a<-table.end(a)
table.save(a,file='mytable.tab')
a<-table.start()
a<-table.row.start(a)
a<-table.element(a,'Partial Autocorrelation Function',4,TRUE)
a<-table.row.end(a)
a<-table.row.start(a)
a<-table.element(a,'Time lag k',header=TRUE)
a<-table.element(a,hyperlink('basics.htm','PACF(k)','click here for more information about the Partial Autocorrelation Function'),header=TRUE)
a<-table.element(a,'T-STAT',header=TRUE)
a<-table.element(a,'P-value',header=TRUE)
a<-table.row.end(a)
for (i in 1:par1) {
a<-table.row.start(a)
a<-table.element(a,i,header=TRUE)
a<-table.element(a,round(mypacf[i],6))
mytstat <- mypacf[i]*sqrtn
a<-table.element(a,round(mytstat,4))
a<-table.element(a,round(1-pt(abs(mytstat),lengthx),6))
a<-table.row.end(a)
}
a<-table.end(a)
table.save(a,file='mytable1.tab')