Free Statistics

of Irreproducible Research!

Author's title

Author*The author of this computation has been verified*
R Software Modulerwasp_centraltendency.wasp
Title produced by softwareCentral Tendency
Date of computationThu, 18 Dec 2008 04:51:41 -0700
Cite this page as followsStatistical Computations at FreeStatistics.org, Office for Research Development and Education, URL https://freestatistics.org/blog/index.php?v=date/2008/Dec/18/t1229601145v014xeqj98r559l.htm/, Retrieved Sat, 11 May 2024 18:19:38 +0000
Statistical Computations at FreeStatistics.org, Office for Research Development and Education, URL https://freestatistics.org/blog/index.php?pk=34679, Retrieved Sat, 11 May 2024 18:19:38 +0000
QR Codes:

Original text written by user:
IsPrivate?No (this computation is public)
User-defined keywords
Estimated Impact134
Family? (F = Feedback message, R = changed R code, M = changed R Module, P = changed Parameters, D = changed Data)
-       [Central Tendency] [Paper - Central T...] [2008-12-18 11:51:41] [c33ddd06d9ea3933c8ac89c0e74c9b3a] [Current]
Feedback Forum

Post a new message
Dataseries X:
357
363
364
363
358
357
357
380
378
376
380
379
384
392
394
392
396
392
396
419
421
420
418
410
418
426
428
430
424
423
427
441
449
452
462
455
461
461
463
462
456
455
456
472
472
471
465
459
465
468
467
463
460
462
461
476
476
471
453
443
442
444
438
427
424
416
406
431
434
418
412
404
409
412
406
398
397
385
390
413
413
401
397
397


Summary of computational transaction
Raw Inputview raw input (R code)
Raw Outputview raw output of R engine
Computing time1 seconds
R Server'George Udny Yule' @ 72.249.76.132

\begin{tabular}{lllllllll}
\hline
Summary of computational transaction \tabularnewline
Raw Input & view raw input (R code)  \tabularnewline
Raw Output & view raw output of R engine  \tabularnewline
Computing time & 1 seconds \tabularnewline
R Server & 'George Udny Yule' @ 72.249.76.132 \tabularnewline
\hline
\end{tabular}
%Source: https://freestatistics.org/blog/index.php?pk=34679&T=0

[TABLE]
[ROW][C]Summary of computational transaction[/C][/ROW]
[ROW][C]Raw Input[/C][C]view raw input (R code) [/C][/ROW]
[ROW][C]Raw Output[/C][C]view raw output of R engine [/C][/ROW]
[ROW][C]Computing time[/C][C]1 seconds[/C][/ROW]
[ROW][C]R Server[/C][C]'George Udny Yule' @ 72.249.76.132[/C][/ROW]
[/TABLE]
Source: https://freestatistics.org/blog/index.php?pk=34679&T=0

Globally Unique Identifier (entire table): ba.freestatistics.org/blog/index.php?pk=34679&T=0

As an alternative you can also use a QR Code:  

The GUIDs for individual cells are displayed in the table below:

Summary of computational transaction
Raw Inputview raw input (R code)
Raw Outputview raw output of R engine
Computing time1 seconds
R Server'George Udny Yule' @ 72.249.76.132


Central Tendency - Ungrouped Data
MeasureValueS.E.Value/S.E.
Arithmetic Mean422.7738095238103.75074485585801112.717293703279
Geometric Mean421.371054616196
Harmonic Mean419.948604404464
Quadratic Mean424.152502336241
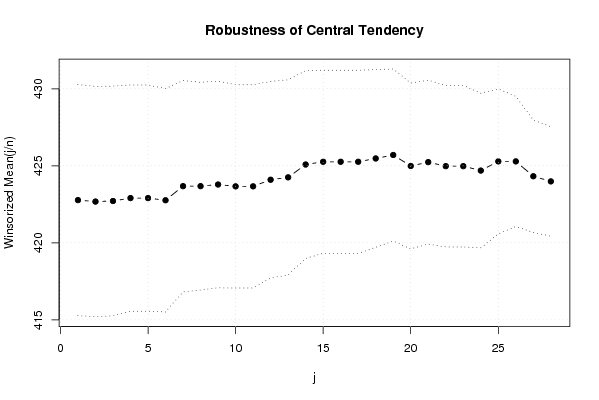
Winsorized Mean ( 1 / 28 )422.7738095238103.75074485585801112.717293703279
Winsorized Mean ( 2 / 28 )422.6785714285713.73502597354167113.166166560222
Winsorized Mean ( 3 / 28 )422.7142857142863.72750747036731113.404007657866
Winsorized Mean ( 4 / 28 )422.9047619047623.67164239067279115.181359431704
Winsorized Mean ( 5 / 28 )422.9047619047623.67164239067279115.181359431704
Winsorized Mean ( 6 / 28 )422.7619047619053.62462014737298116.636195676479
Winsorized Mean ( 7 / 28 )423.6785714285713.43023915382084123.512837568963
Winsorized Mean ( 8 / 28 )423.6785714285713.37017055133998125.714282103651
Winsorized Mean ( 9 / 28 )423.7857142857143.35280050215907126.397533647711
Winsorized Mean ( 10 / 28 )423.6666666666673.29899119359102128.423097184899
Winsorized Mean ( 11 / 28 )423.6666666666673.29899119359102128.423097184899
Winsorized Mean ( 12 / 28 )424.0952380952383.18962833717703132.960706785851
Winsorized Mean ( 13 / 28 )424.253.16635148052478133.987020269047
Winsorized Mean ( 14 / 28 )425.0833333333333.04622111647481139.544477265411
Winsorized Mean ( 15 / 28 )425.2619047619052.9713741867274143.119606632337
Winsorized Mean ( 16 / 28 )425.2619047619052.9713741867274143.119606632337
Winsorized Mean ( 17 / 28 )425.2619047619052.9713741867274143.119606632337
Winsorized Mean ( 18 / 28 )425.4761904761902.88329492297844147.565962498444
Winsorized Mean ( 19 / 28 )425.7023809523812.79197377226398152.473631801771
Winsorized Mean ( 20 / 28 )424.9880952380952.69103684520353157.927267326565
Winsorized Mean ( 21 / 28 )425.2380952380952.65881764298344159.935035921057
Winsorized Mean ( 22 / 28 )424.9761904761902.62249942042308162.050060780425
Winsorized Mean ( 23 / 28 )424.9761904761902.62249942042308162.050060780425
Winsorized Mean ( 24 / 28 )424.6904761904762.50753175210236169.365941561620
Winsorized Mean ( 25 / 28 )425.2857142857142.35415499361368180.653234574369
Winsorized Mean ( 26 / 28 )425.2857142857142.11377278980827201.197459034511
Winsorized Mean ( 27 / 28 )424.3214285714291.82237328272999232.840018339041
Winsorized Mean ( 28 / 28 )423.9880952380951.77923043563561238.298585020905
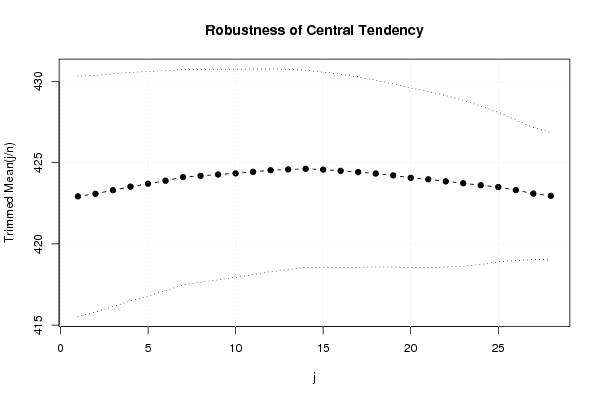
Trimmed Mean ( 1 / 28 )422.9268292682933.69984905279815114.309211871343
Trimmed Mean ( 2 / 28 )423.08753.64041109750819116.219703947611
Trimmed Mean ( 3 / 28 )423.3076923076923.58040267020649118.229074017331
Trimmed Mean ( 4 / 28 )423.5263157894743.51320684636374120.552627360337
Trimmed Mean ( 5 / 28 )423.7027027027033.45365088765583122.682551446389
Trimmed Mean ( 6 / 28 )423.8888888888893.38311162549533125.295566866442
Trimmed Mean ( 7 / 28 )424.1142857142863.31172350449815128.064521430679
Trimmed Mean ( 8 / 28 )424.1911764705883.27341013912949129.586931805434
Trimmed Mean ( 9 / 28 )424.2727272727273.23943831317555130.971077778240
Trimmed Mean ( 10 / 28 )424.343753.20088178807499132.570890802937
Trimmed Mean ( 11 / 28 )424.4354838709683.16349994007132134.166427030626
Trimmed Mean ( 12 / 28 )424.5333333333333.1167006554236136.212418281034
Trimmed Mean ( 13 / 28 )424.5862068965523.07892102497204137.900973572522
Trimmed Mean ( 14 / 28 )424.6253.03513649963697139.903098279365
Trimmed Mean ( 15 / 28 )424.5740740740743.00111810655365141.471964447822
Trimmed Mean ( 16 / 28 )424.52.96974436589976142.941596210887
Trimmed Mean ( 17 / 28 )424.422.92771276610536144.966406853016
Trimmed Mean ( 18 / 28 )424.3333333333332.87217843865097147.739196013406
Trimmed Mean ( 19 / 28 )424.2173913043482.81625938972612150.631505340707
Trimmed Mean ( 20 / 28 )424.0681818181822.75983686117283153.656974361147
Trimmed Mean ( 21 / 28 )423.9761904761902.70532835425602156.718939425298
Trimmed Mean ( 22 / 28 )423.852.63714832386259160.722852091684
Trimmed Mean ( 23 / 28 )423.7368421052632.55207059284187166.036489466151
Trimmed Mean ( 24 / 28 )423.6111111111112.43397831562179174.040626571027
Trimmed Mean ( 25 / 28 )423.52.30176635266180183.989134913828
Trimmed Mean ( 26 / 28 )423.31252.15920642344178196.050037367543
Trimmed Mean ( 27 / 28 )423.12.03156131566594208.263465511652
Trimmed Mean ( 28 / 28 )422.9642857142861.94533912037795217.424448664822
Median422
Midrange416.5
Midmean - Weighted Average at Xnp423.444444444444
Midmean - Weighted Average at X(n+1)p424.720930232558
Midmean - Empirical Distribution Function423.444444444444
Midmean - Empirical Distribution Function - Averaging424.720930232558
Midmean - Empirical Distribution Function - Interpolation424.720930232558
Midmean - Closest Observation423.444444444444
Midmean - True Basic - Statistics Graphics Toolkit424.720930232558
Midmean - MS Excel (old versions)423.444444444444
Number of observations84

\begin{tabular}{lllllllll}
\hline
Central Tendency - Ungrouped Data \tabularnewline
Measure & Value & S.E. & Value/S.E. \tabularnewline
Arithmetic Mean & 422.773809523810 & 3.75074485585801 & 112.717293703279 \tabularnewline
Geometric Mean & 421.371054616196 &  &  \tabularnewline
Harmonic Mean & 419.948604404464 &  &  \tabularnewline
Quadratic Mean & 424.152502336241 &  &  \tabularnewline
Winsorized Mean ( 1 / 28 ) & 422.773809523810 & 3.75074485585801 & 112.717293703279 \tabularnewline
Winsorized Mean ( 2 / 28 ) & 422.678571428571 & 3.73502597354167 & 113.166166560222 \tabularnewline
Winsorized Mean ( 3 / 28 ) & 422.714285714286 & 3.72750747036731 & 113.404007657866 \tabularnewline
Winsorized Mean ( 4 / 28 ) & 422.904761904762 & 3.67164239067279 & 115.181359431704 \tabularnewline
Winsorized Mean ( 5 / 28 ) & 422.904761904762 & 3.67164239067279 & 115.181359431704 \tabularnewline
Winsorized Mean ( 6 / 28 ) & 422.761904761905 & 3.62462014737298 & 116.636195676479 \tabularnewline
Winsorized Mean ( 7 / 28 ) & 423.678571428571 & 3.43023915382084 & 123.512837568963 \tabularnewline
Winsorized Mean ( 8 / 28 ) & 423.678571428571 & 3.37017055133998 & 125.714282103651 \tabularnewline
Winsorized Mean ( 9 / 28 ) & 423.785714285714 & 3.35280050215907 & 126.397533647711 \tabularnewline
Winsorized Mean ( 10 / 28 ) & 423.666666666667 & 3.29899119359102 & 128.423097184899 \tabularnewline
Winsorized Mean ( 11 / 28 ) & 423.666666666667 & 3.29899119359102 & 128.423097184899 \tabularnewline
Winsorized Mean ( 12 / 28 ) & 424.095238095238 & 3.18962833717703 & 132.960706785851 \tabularnewline
Winsorized Mean ( 13 / 28 ) & 424.25 & 3.16635148052478 & 133.987020269047 \tabularnewline
Winsorized Mean ( 14 / 28 ) & 425.083333333333 & 3.04622111647481 & 139.544477265411 \tabularnewline
Winsorized Mean ( 15 / 28 ) & 425.261904761905 & 2.9713741867274 & 143.119606632337 \tabularnewline
Winsorized Mean ( 16 / 28 ) & 425.261904761905 & 2.9713741867274 & 143.119606632337 \tabularnewline
Winsorized Mean ( 17 / 28 ) & 425.261904761905 & 2.9713741867274 & 143.119606632337 \tabularnewline
Winsorized Mean ( 18 / 28 ) & 425.476190476190 & 2.88329492297844 & 147.565962498444 \tabularnewline
Winsorized Mean ( 19 / 28 ) & 425.702380952381 & 2.79197377226398 & 152.473631801771 \tabularnewline
Winsorized Mean ( 20 / 28 ) & 424.988095238095 & 2.69103684520353 & 157.927267326565 \tabularnewline
Winsorized Mean ( 21 / 28 ) & 425.238095238095 & 2.65881764298344 & 159.935035921057 \tabularnewline
Winsorized Mean ( 22 / 28 ) & 424.976190476190 & 2.62249942042308 & 162.050060780425 \tabularnewline
Winsorized Mean ( 23 / 28 ) & 424.976190476190 & 2.62249942042308 & 162.050060780425 \tabularnewline
Winsorized Mean ( 24 / 28 ) & 424.690476190476 & 2.50753175210236 & 169.365941561620 \tabularnewline
Winsorized Mean ( 25 / 28 ) & 425.285714285714 & 2.35415499361368 & 180.653234574369 \tabularnewline
Winsorized Mean ( 26 / 28 ) & 425.285714285714 & 2.11377278980827 & 201.197459034511 \tabularnewline
Winsorized Mean ( 27 / 28 ) & 424.321428571429 & 1.82237328272999 & 232.840018339041 \tabularnewline
Winsorized Mean ( 28 / 28 ) & 423.988095238095 & 1.77923043563561 & 238.298585020905 \tabularnewline
Trimmed Mean ( 1 / 28 ) & 422.926829268293 & 3.69984905279815 & 114.309211871343 \tabularnewline
Trimmed Mean ( 2 / 28 ) & 423.0875 & 3.64041109750819 & 116.219703947611 \tabularnewline
Trimmed Mean ( 3 / 28 ) & 423.307692307692 & 3.58040267020649 & 118.229074017331 \tabularnewline
Trimmed Mean ( 4 / 28 ) & 423.526315789474 & 3.51320684636374 & 120.552627360337 \tabularnewline
Trimmed Mean ( 5 / 28 ) & 423.702702702703 & 3.45365088765583 & 122.682551446389 \tabularnewline
Trimmed Mean ( 6 / 28 ) & 423.888888888889 & 3.38311162549533 & 125.295566866442 \tabularnewline
Trimmed Mean ( 7 / 28 ) & 424.114285714286 & 3.31172350449815 & 128.064521430679 \tabularnewline
Trimmed Mean ( 8 / 28 ) & 424.191176470588 & 3.27341013912949 & 129.586931805434 \tabularnewline
Trimmed Mean ( 9 / 28 ) & 424.272727272727 & 3.23943831317555 & 130.971077778240 \tabularnewline
Trimmed Mean ( 10 / 28 ) & 424.34375 & 3.20088178807499 & 132.570890802937 \tabularnewline
Trimmed Mean ( 11 / 28 ) & 424.435483870968 & 3.16349994007132 & 134.166427030626 \tabularnewline
Trimmed Mean ( 12 / 28 ) & 424.533333333333 & 3.1167006554236 & 136.212418281034 \tabularnewline
Trimmed Mean ( 13 / 28 ) & 424.586206896552 & 3.07892102497204 & 137.900973572522 \tabularnewline
Trimmed Mean ( 14 / 28 ) & 424.625 & 3.03513649963697 & 139.903098279365 \tabularnewline
Trimmed Mean ( 15 / 28 ) & 424.574074074074 & 3.00111810655365 & 141.471964447822 \tabularnewline
Trimmed Mean ( 16 / 28 ) & 424.5 & 2.96974436589976 & 142.941596210887 \tabularnewline
Trimmed Mean ( 17 / 28 ) & 424.42 & 2.92771276610536 & 144.966406853016 \tabularnewline
Trimmed Mean ( 18 / 28 ) & 424.333333333333 & 2.87217843865097 & 147.739196013406 \tabularnewline
Trimmed Mean ( 19 / 28 ) & 424.217391304348 & 2.81625938972612 & 150.631505340707 \tabularnewline
Trimmed Mean ( 20 / 28 ) & 424.068181818182 & 2.75983686117283 & 153.656974361147 \tabularnewline
Trimmed Mean ( 21 / 28 ) & 423.976190476190 & 2.70532835425602 & 156.718939425298 \tabularnewline
Trimmed Mean ( 22 / 28 ) & 423.85 & 2.63714832386259 & 160.722852091684 \tabularnewline
Trimmed Mean ( 23 / 28 ) & 423.736842105263 & 2.55207059284187 & 166.036489466151 \tabularnewline
Trimmed Mean ( 24 / 28 ) & 423.611111111111 & 2.43397831562179 & 174.040626571027 \tabularnewline
Trimmed Mean ( 25 / 28 ) & 423.5 & 2.30176635266180 & 183.989134913828 \tabularnewline
Trimmed Mean ( 26 / 28 ) & 423.3125 & 2.15920642344178 & 196.050037367543 \tabularnewline
Trimmed Mean ( 27 / 28 ) & 423.1 & 2.03156131566594 & 208.263465511652 \tabularnewline
Trimmed Mean ( 28 / 28 ) & 422.964285714286 & 1.94533912037795 & 217.424448664822 \tabularnewline
Median & 422 &  &  \tabularnewline
Midrange & 416.5 &  &  \tabularnewline
Midmean - Weighted Average at Xnp & 423.444444444444 &  &  \tabularnewline
Midmean - Weighted Average at X(n+1)p & 424.720930232558 &  &  \tabularnewline
Midmean - Empirical Distribution Function & 423.444444444444 &  &  \tabularnewline
Midmean - Empirical Distribution Function - Averaging & 424.720930232558 &  &  \tabularnewline
Midmean - Empirical Distribution Function - Interpolation & 424.720930232558 &  &  \tabularnewline
Midmean - Closest Observation & 423.444444444444 &  &  \tabularnewline
Midmean - True Basic - Statistics Graphics Toolkit & 424.720930232558 &  &  \tabularnewline
Midmean - MS Excel (old versions) & 423.444444444444 &  &  \tabularnewline
Number of observations & 84 &  &  \tabularnewline
\hline
\end{tabular}
%Source: https://freestatistics.org/blog/index.php?pk=34679&T=1

[TABLE]
[ROW][C]Central Tendency - Ungrouped Data[/C][/ROW]
[ROW][C]Measure[/C][C]Value[/C][C]S.E.[/C][C]Value/S.E.[/C][/ROW]
[ROW][C]Arithmetic Mean[/C][C]422.773809523810[/C][C]3.75074485585801[/C][C]112.717293703279[/C][/ROW]
[ROW][C]Geometric Mean[/C][C]421.371054616196[/C][C][/C][C][/C][/ROW]
[ROW][C]Harmonic Mean[/C][C]419.948604404464[/C][C][/C][C][/C][/ROW]
[ROW][C]Quadratic Mean[/C][C]424.152502336241[/C][C][/C][C][/C][/ROW]
[ROW][C]Winsorized Mean ( 1 / 28 )[/C][C]422.773809523810[/C][C]3.75074485585801[/C][C]112.717293703279[/C][/ROW]
[ROW][C]Winsorized Mean ( 2 / 28 )[/C][C]422.678571428571[/C][C]3.73502597354167[/C][C]113.166166560222[/C][/ROW]
[ROW][C]Winsorized Mean ( 3 / 28 )[/C][C]422.714285714286[/C][C]3.72750747036731[/C][C]113.404007657866[/C][/ROW]
[ROW][C]Winsorized Mean ( 4 / 28 )[/C][C]422.904761904762[/C][C]3.67164239067279[/C][C]115.181359431704[/C][/ROW]
[ROW][C]Winsorized Mean ( 5 / 28 )[/C][C]422.904761904762[/C][C]3.67164239067279[/C][C]115.181359431704[/C][/ROW]
[ROW][C]Winsorized Mean ( 6 / 28 )[/C][C]422.761904761905[/C][C]3.62462014737298[/C][C]116.636195676479[/C][/ROW]
[ROW][C]Winsorized Mean ( 7 / 28 )[/C][C]423.678571428571[/C][C]3.43023915382084[/C][C]123.512837568963[/C][/ROW]
[ROW][C]Winsorized Mean ( 8 / 28 )[/C][C]423.678571428571[/C][C]3.37017055133998[/C][C]125.714282103651[/C][/ROW]
[ROW][C]Winsorized Mean ( 9 / 28 )[/C][C]423.785714285714[/C][C]3.35280050215907[/C][C]126.397533647711[/C][/ROW]
[ROW][C]Winsorized Mean ( 10 / 28 )[/C][C]423.666666666667[/C][C]3.29899119359102[/C][C]128.423097184899[/C][/ROW]
[ROW][C]Winsorized Mean ( 11 / 28 )[/C][C]423.666666666667[/C][C]3.29899119359102[/C][C]128.423097184899[/C][/ROW]
[ROW][C]Winsorized Mean ( 12 / 28 )[/C][C]424.095238095238[/C][C]3.18962833717703[/C][C]132.960706785851[/C][/ROW]
[ROW][C]Winsorized Mean ( 13 / 28 )[/C][C]424.25[/C][C]3.16635148052478[/C][C]133.987020269047[/C][/ROW]
[ROW][C]Winsorized Mean ( 14 / 28 )[/C][C]425.083333333333[/C][C]3.04622111647481[/C][C]139.544477265411[/C][/ROW]
[ROW][C]Winsorized Mean ( 15 / 28 )[/C][C]425.261904761905[/C][C]2.9713741867274[/C][C]143.119606632337[/C][/ROW]
[ROW][C]Winsorized Mean ( 16 / 28 )[/C][C]425.261904761905[/C][C]2.9713741867274[/C][C]143.119606632337[/C][/ROW]
[ROW][C]Winsorized Mean ( 17 / 28 )[/C][C]425.261904761905[/C][C]2.9713741867274[/C][C]143.119606632337[/C][/ROW]
[ROW][C]Winsorized Mean ( 18 / 28 )[/C][C]425.476190476190[/C][C]2.88329492297844[/C][C]147.565962498444[/C][/ROW]
[ROW][C]Winsorized Mean ( 19 / 28 )[/C][C]425.702380952381[/C][C]2.79197377226398[/C][C]152.473631801771[/C][/ROW]
[ROW][C]Winsorized Mean ( 20 / 28 )[/C][C]424.988095238095[/C][C]2.69103684520353[/C][C]157.927267326565[/C][/ROW]
[ROW][C]Winsorized Mean ( 21 / 28 )[/C][C]425.238095238095[/C][C]2.65881764298344[/C][C]159.935035921057[/C][/ROW]
[ROW][C]Winsorized Mean ( 22 / 28 )[/C][C]424.976190476190[/C][C]2.62249942042308[/C][C]162.050060780425[/C][/ROW]
[ROW][C]Winsorized Mean ( 23 / 28 )[/C][C]424.976190476190[/C][C]2.62249942042308[/C][C]162.050060780425[/C][/ROW]
[ROW][C]Winsorized Mean ( 24 / 28 )[/C][C]424.690476190476[/C][C]2.50753175210236[/C][C]169.365941561620[/C][/ROW]
[ROW][C]Winsorized Mean ( 25 / 28 )[/C][C]425.285714285714[/C][C]2.35415499361368[/C][C]180.653234574369[/C][/ROW]
[ROW][C]Winsorized Mean ( 26 / 28 )[/C][C]425.285714285714[/C][C]2.11377278980827[/C][C]201.197459034511[/C][/ROW]
[ROW][C]Winsorized Mean ( 27 / 28 )[/C][C]424.321428571429[/C][C]1.82237328272999[/C][C]232.840018339041[/C][/ROW]
[ROW][C]Winsorized Mean ( 28 / 28 )[/C][C]423.988095238095[/C][C]1.77923043563561[/C][C]238.298585020905[/C][/ROW]
[ROW][C]Trimmed Mean ( 1 / 28 )[/C][C]422.926829268293[/C][C]3.69984905279815[/C][C]114.309211871343[/C][/ROW]
[ROW][C]Trimmed Mean ( 2 / 28 )[/C][C]423.0875[/C][C]3.64041109750819[/C][C]116.219703947611[/C][/ROW]
[ROW][C]Trimmed Mean ( 3 / 28 )[/C][C]423.307692307692[/C][C]3.58040267020649[/C][C]118.229074017331[/C][/ROW]
[ROW][C]Trimmed Mean ( 4 / 28 )[/C][C]423.526315789474[/C][C]3.51320684636374[/C][C]120.552627360337[/C][/ROW]
[ROW][C]Trimmed Mean ( 5 / 28 )[/C][C]423.702702702703[/C][C]3.45365088765583[/C][C]122.682551446389[/C][/ROW]
[ROW][C]Trimmed Mean ( 6 / 28 )[/C][C]423.888888888889[/C][C]3.38311162549533[/C][C]125.295566866442[/C][/ROW]
[ROW][C]Trimmed Mean ( 7 / 28 )[/C][C]424.114285714286[/C][C]3.31172350449815[/C][C]128.064521430679[/C][/ROW]
[ROW][C]Trimmed Mean ( 8 / 28 )[/C][C]424.191176470588[/C][C]3.27341013912949[/C][C]129.586931805434[/C][/ROW]
[ROW][C]Trimmed Mean ( 9 / 28 )[/C][C]424.272727272727[/C][C]3.23943831317555[/C][C]130.971077778240[/C][/ROW]
[ROW][C]Trimmed Mean ( 10 / 28 )[/C][C]424.34375[/C][C]3.20088178807499[/C][C]132.570890802937[/C][/ROW]
[ROW][C]Trimmed Mean ( 11 / 28 )[/C][C]424.435483870968[/C][C]3.16349994007132[/C][C]134.166427030626[/C][/ROW]
[ROW][C]Trimmed Mean ( 12 / 28 )[/C][C]424.533333333333[/C][C]3.1167006554236[/C][C]136.212418281034[/C][/ROW]
[ROW][C]Trimmed Mean ( 13 / 28 )[/C][C]424.586206896552[/C][C]3.07892102497204[/C][C]137.900973572522[/C][/ROW]
[ROW][C]Trimmed Mean ( 14 / 28 )[/C][C]424.625[/C][C]3.03513649963697[/C][C]139.903098279365[/C][/ROW]
[ROW][C]Trimmed Mean ( 15 / 28 )[/C][C]424.574074074074[/C][C]3.00111810655365[/C][C]141.471964447822[/C][/ROW]
[ROW][C]Trimmed Mean ( 16 / 28 )[/C][C]424.5[/C][C]2.96974436589976[/C][C]142.941596210887[/C][/ROW]
[ROW][C]Trimmed Mean ( 17 / 28 )[/C][C]424.42[/C][C]2.92771276610536[/C][C]144.966406853016[/C][/ROW]
[ROW][C]Trimmed Mean ( 18 / 28 )[/C][C]424.333333333333[/C][C]2.87217843865097[/C][C]147.739196013406[/C][/ROW]
[ROW][C]Trimmed Mean ( 19 / 28 )[/C][C]424.217391304348[/C][C]2.81625938972612[/C][C]150.631505340707[/C][/ROW]
[ROW][C]Trimmed Mean ( 20 / 28 )[/C][C]424.068181818182[/C][C]2.75983686117283[/C][C]153.656974361147[/C][/ROW]
[ROW][C]Trimmed Mean ( 21 / 28 )[/C][C]423.976190476190[/C][C]2.70532835425602[/C][C]156.718939425298[/C][/ROW]
[ROW][C]Trimmed Mean ( 22 / 28 )[/C][C]423.85[/C][C]2.63714832386259[/C][C]160.722852091684[/C][/ROW]
[ROW][C]Trimmed Mean ( 23 / 28 )[/C][C]423.736842105263[/C][C]2.55207059284187[/C][C]166.036489466151[/C][/ROW]
[ROW][C]Trimmed Mean ( 24 / 28 )[/C][C]423.611111111111[/C][C]2.43397831562179[/C][C]174.040626571027[/C][/ROW]
[ROW][C]Trimmed Mean ( 25 / 28 )[/C][C]423.5[/C][C]2.30176635266180[/C][C]183.989134913828[/C][/ROW]
[ROW][C]Trimmed Mean ( 26 / 28 )[/C][C]423.3125[/C][C]2.15920642344178[/C][C]196.050037367543[/C][/ROW]
[ROW][C]Trimmed Mean ( 27 / 28 )[/C][C]423.1[/C][C]2.03156131566594[/C][C]208.263465511652[/C][/ROW]
[ROW][C]Trimmed Mean ( 28 / 28 )[/C][C]422.964285714286[/C][C]1.94533912037795[/C][C]217.424448664822[/C][/ROW]
[ROW][C]Median[/C][C]422[/C][C][/C][C][/C][/ROW]
[ROW][C]Midrange[/C][C]416.5[/C][C][/C][C][/C][/ROW]
[ROW][C]Midmean - Weighted Average at Xnp[/C][C]423.444444444444[/C][C][/C][C][/C][/ROW]
[ROW][C]Midmean - Weighted Average at X(n+1)p[/C][C]424.720930232558[/C][C][/C][C][/C][/ROW]
[ROW][C]Midmean - Empirical Distribution Function[/C][C]423.444444444444[/C][C][/C][C][/C][/ROW]
[ROW][C]Midmean - Empirical Distribution Function - Averaging[/C][C]424.720930232558[/C][C][/C][C][/C][/ROW]
[ROW][C]Midmean - Empirical Distribution Function - Interpolation[/C][C]424.720930232558[/C][C][/C][C][/C][/ROW]
[ROW][C]Midmean - Closest Observation[/C][C]423.444444444444[/C][C][/C][C][/C][/ROW]
[ROW][C]Midmean - True Basic - Statistics Graphics Toolkit[/C][C]424.720930232558[/C][C][/C][C][/C][/ROW]
[ROW][C]Midmean - MS Excel (old versions)[/C][C]423.444444444444[/C][C][/C][C][/C][/ROW]
[ROW][C]Number of observations[/C][C]84[/C][C][/C][C][/C][/ROW]
[/TABLE]
Source: https://freestatistics.org/blog/index.php?pk=34679&T=1

Globally Unique Identifier (entire table): ba.freestatistics.org/blog/index.php?pk=34679&T=1

As an alternative you can also use a QR Code:  

The GUIDs for individual cells are displayed in the table below:

Central Tendency - Ungrouped Data
MeasureValueS.E.Value/S.E.
Arithmetic Mean422.7738095238103.75074485585801112.717293703279
Geometric Mean421.371054616196
Harmonic Mean419.948604404464
Quadratic Mean424.152502336241
Winsorized Mean ( 1 / 28 )422.7738095238103.75074485585801112.717293703279
Winsorized Mean ( 2 / 28 )422.6785714285713.73502597354167113.166166560222
Winsorized Mean ( 3 / 28 )422.7142857142863.72750747036731113.404007657866
Winsorized Mean ( 4 / 28 )422.9047619047623.67164239067279115.181359431704
Winsorized Mean ( 5 / 28 )422.9047619047623.67164239067279115.181359431704
Winsorized Mean ( 6 / 28 )422.7619047619053.62462014737298116.636195676479
Winsorized Mean ( 7 / 28 )423.6785714285713.43023915382084123.512837568963
Winsorized Mean ( 8 / 28 )423.6785714285713.37017055133998125.714282103651
Winsorized Mean ( 9 / 28 )423.7857142857143.35280050215907126.397533647711
Winsorized Mean ( 10 / 28 )423.6666666666673.29899119359102128.423097184899
Winsorized Mean ( 11 / 28 )423.6666666666673.29899119359102128.423097184899
Winsorized Mean ( 12 / 28 )424.0952380952383.18962833717703132.960706785851
Winsorized Mean ( 13 / 28 )424.253.16635148052478133.987020269047
Winsorized Mean ( 14 / 28 )425.0833333333333.04622111647481139.544477265411
Winsorized Mean ( 15 / 28 )425.2619047619052.9713741867274143.119606632337
Winsorized Mean ( 16 / 28 )425.2619047619052.9713741867274143.119606632337
Winsorized Mean ( 17 / 28 )425.2619047619052.9713741867274143.119606632337
Winsorized Mean ( 18 / 28 )425.4761904761902.88329492297844147.565962498444
Winsorized Mean ( 19 / 28 )425.7023809523812.79197377226398152.473631801771
Winsorized Mean ( 20 / 28 )424.9880952380952.69103684520353157.927267326565
Winsorized Mean ( 21 / 28 )425.2380952380952.65881764298344159.935035921057
Winsorized Mean ( 22 / 28 )424.9761904761902.62249942042308162.050060780425
Winsorized Mean ( 23 / 28 )424.9761904761902.62249942042308162.050060780425
Winsorized Mean ( 24 / 28 )424.6904761904762.50753175210236169.365941561620
Winsorized Mean ( 25 / 28 )425.2857142857142.35415499361368180.653234574369
Winsorized Mean ( 26 / 28 )425.2857142857142.11377278980827201.197459034511
Winsorized Mean ( 27 / 28 )424.3214285714291.82237328272999232.840018339041
Winsorized Mean ( 28 / 28 )423.9880952380951.77923043563561238.298585020905
Trimmed Mean ( 1 / 28 )422.9268292682933.69984905279815114.309211871343
Trimmed Mean ( 2 / 28 )423.08753.64041109750819116.219703947611
Trimmed Mean ( 3 / 28 )423.3076923076923.58040267020649118.229074017331
Trimmed Mean ( 4 / 28 )423.5263157894743.51320684636374120.552627360337
Trimmed Mean ( 5 / 28 )423.7027027027033.45365088765583122.682551446389
Trimmed Mean ( 6 / 28 )423.8888888888893.38311162549533125.295566866442
Trimmed Mean ( 7 / 28 )424.1142857142863.31172350449815128.064521430679
Trimmed Mean ( 8 / 28 )424.1911764705883.27341013912949129.586931805434
Trimmed Mean ( 9 / 28 )424.2727272727273.23943831317555130.971077778240
Trimmed Mean ( 10 / 28 )424.343753.20088178807499132.570890802937
Trimmed Mean ( 11 / 28 )424.4354838709683.16349994007132134.166427030626
Trimmed Mean ( 12 / 28 )424.5333333333333.1167006554236136.212418281034
Trimmed Mean ( 13 / 28 )424.5862068965523.07892102497204137.900973572522
Trimmed Mean ( 14 / 28 )424.6253.03513649963697139.903098279365
Trimmed Mean ( 15 / 28 )424.5740740740743.00111810655365141.471964447822
Trimmed Mean ( 16 / 28 )424.52.96974436589976142.941596210887
Trimmed Mean ( 17 / 28 )424.422.92771276610536144.966406853016
Trimmed Mean ( 18 / 28 )424.3333333333332.87217843865097147.739196013406
Trimmed Mean ( 19 / 28 )424.2173913043482.81625938972612150.631505340707
Trimmed Mean ( 20 / 28 )424.0681818181822.75983686117283153.656974361147
Trimmed Mean ( 21 / 28 )423.9761904761902.70532835425602156.718939425298
Trimmed Mean ( 22 / 28 )423.852.63714832386259160.722852091684
Trimmed Mean ( 23 / 28 )423.7368421052632.55207059284187166.036489466151
Trimmed Mean ( 24 / 28 )423.6111111111112.43397831562179174.040626571027
Trimmed Mean ( 25 / 28 )423.52.30176635266180183.989134913828
Trimmed Mean ( 26 / 28 )423.31252.15920642344178196.050037367543
Trimmed Mean ( 27 / 28 )423.12.03156131566594208.263465511652
Trimmed Mean ( 28 / 28 )422.9642857142861.94533912037795217.424448664822
Median422
Midrange416.5
Midmean - Weighted Average at Xnp423.444444444444
Midmean - Weighted Average at X(n+1)p424.720930232558
Midmean - Empirical Distribution Function423.444444444444
Midmean - Empirical Distribution Function - Averaging424.720930232558
Midmean - Empirical Distribution Function - Interpolation424.720930232558
Midmean - Closest Observation423.444444444444
Midmean - True Basic - Statistics Graphics Toolkit424.720930232558
Midmean - MS Excel (old versions)423.444444444444
Number of observations84


Parameters (Session):
Parameters (R input):
R code (references can be found in the software module):
geomean <- function(x) {
return(exp(mean(log(x))))
}
harmean <- function(x) {
return(1/mean(1/x))
}
quamean <- function(x) {
return(sqrt(mean(x*x)))
}
winmean <- function(x) {
x <-sort(x[!is.na(x)])
n<-length(x)
denom <- 3
nodenom <- n/denom
if (nodenom>40) denom <- n/40
sqrtn = sqrt(n)
roundnodenom = floor(nodenom)
win <- array(NA,dim=c(roundnodenom,2))
for (j in 1:roundnodenom) {
win[j,1] <- (j*x[j+1]+sum(x[(j+1):(n-j)])+j*x[n-j])/n
win[j,2] <- sd(c(rep(x[j+1],j),x[(j+1):(n-j)],rep(x[n-j],j)))/sqrtn
}
return(win)
}
trimean <- function(x) {
x <-sort(x[!is.na(x)])
n<-length(x)
denom <- 3
nodenom <- n/denom
if (nodenom>40) denom <- n/40
sqrtn = sqrt(n)
roundnodenom = floor(nodenom)
tri <- array(NA,dim=c(roundnodenom,2))
for (j in 1:roundnodenom) {
tri[j,1] <- mean(x,trim=j/n)
tri[j,2] <- sd(x[(j+1):(n-j)]) / sqrt(n-j*2)
}
return(tri)
}
midrange <- function(x) {
return((max(x)+min(x))/2)
}
q1 <- function(data,n,p,i,f) {
np <- n*p;
i <<- floor(np)
f <<- np - i
qvalue <- (1-f)*data[i] + f*data[i+1]
}
q2 <- function(data,n,p,i,f) {
np <- (n+1)*p
i <<- floor(np)
f <<- np - i
qvalue <- (1-f)*data[i] + f*data[i+1]
}
q3 <- function(data,n,p,i,f) {
np <- n*p
i <<- floor(np)
f <<- np - i
if (f==0) {
qvalue <- data[i]
} else {
qvalue <- data[i+1]
}
}
q4 <- function(data,n,p,i,f) {
np <- n*p
i <<- floor(np)
f <<- np - i
if (f==0) {
qvalue <- (data[i]+data[i+1])/2
} else {
qvalue <- data[i+1]
}
}
q5 <- function(data,n,p,i,f) {
np <- (n-1)*p
i <<- floor(np)
f <<- np - i
if (f==0) {
qvalue <- data[i+1]
} else {
qvalue <- data[i+1] + f*(data[i+2]-data[i+1])
}
}
q6 <- function(data,n,p,i,f) {
np <- n*p+0.5
i <<- floor(np)
f <<- np - i
qvalue <- data[i]
}
q7 <- function(data,n,p,i,f) {
np <- (n+1)*p
i <<- floor(np)
f <<- np - i
if (f==0) {
qvalue <- data[i]
} else {
qvalue <- f*data[i] + (1-f)*data[i+1]
}
}
q8 <- function(data,n,p,i,f) {
np <- (n+1)*p
i <<- floor(np)
f <<- np - i
if (f==0) {
qvalue <- data[i]
} else {
if (f == 0.5) {
qvalue <- (data[i]+data[i+1])/2
} else {
if (f < 0.5) {
qvalue <- data[i]
} else {
qvalue <- data[i+1]
}
}
}
}
midmean <- function(x,def) {
x <-sort(x[!is.na(x)])
n<-length(x)
if (def==1) {
qvalue1 <- q1(x,n,0.25,i,f)
qvalue3 <- q1(x,n,0.75,i,f)
}
if (def==2) {
qvalue1 <- q2(x,n,0.25,i,f)
qvalue3 <- q2(x,n,0.75,i,f)
}
if (def==3) {
qvalue1 <- q3(x,n,0.25,i,f)
qvalue3 <- q3(x,n,0.75,i,f)
}
if (def==4) {
qvalue1 <- q4(x,n,0.25,i,f)
qvalue3 <- q4(x,n,0.75,i,f)
}
if (def==5) {
qvalue1 <- q5(x,n,0.25,i,f)
qvalue3 <- q5(x,n,0.75,i,f)
}
if (def==6) {
qvalue1 <- q6(x,n,0.25,i,f)
qvalue3 <- q6(x,n,0.75,i,f)
}
if (def==7) {
qvalue1 <- q7(x,n,0.25,i,f)
qvalue3 <- q7(x,n,0.75,i,f)
}
if (def==8) {
qvalue1 <- q8(x,n,0.25,i,f)
qvalue3 <- q8(x,n,0.75,i,f)
}
midm <- 0
myn <- 0
roundno4 <- round(n/4)
round3no4 <- round(3*n/4)
for (i in 1:n) {
if ((x[i]>=qvalue1) & (x[i]<=qvalue3)){
midm = midm + x[i]
myn = myn + 1
}
}
midm = midm / myn
return(midm)
}
(arm <- mean(x))
sqrtn <- sqrt(length(x))
(armse <- sd(x) / sqrtn)
(armose <- arm / armse)
(geo <- geomean(x))
(har <- harmean(x))
(qua <- quamean(x))
(win <- winmean(x))
(tri <- trimean(x))
(midr <- midrange(x))
midm <- array(NA,dim=8)
for (j in 1:8) midm[j] <- midmean(x,j)
midm
bitmap(file='test1.png')
lb <- win[,1] - 2*win[,2]
ub <- win[,1] + 2*win[,2]
if ((ylimmin == '') | (ylimmax == '')) plot(win[,1],type='b',main=main, xlab='j', pch=19, ylab='Winsorized Mean(j/n)', ylim=c(min(lb),max(ub))) else plot(win[,1],type='l',main=main, xlab='j', pch=19, ylab='Winsorized Mean(j/n)', ylim=c(ylimmin,ylimmax))
lines(ub,lty=3)
lines(lb,lty=3)
grid()
dev.off()
bitmap(file='test2.png')
lb <- tri[,1] - 2*tri[,2]
ub <- tri[,1] + 2*tri[,2]
if ((ylimmin == '') | (ylimmax == '')) plot(tri[,1],type='b',main=main, xlab='j', pch=19, ylab='Trimmed Mean(j/n)', ylim=c(min(lb),max(ub))) else plot(tri[,1],type='l',main=main, xlab='j', pch=19, ylab='Trimmed Mean(j/n)', ylim=c(ylimmin,ylimmax))
lines(ub,lty=3)
lines(lb,lty=3)
grid()
dev.off()
load(file='createtable')
a<-table.start()
a<-table.row.start(a)
a<-table.element(a,'Central Tendency - Ungrouped Data',4,TRUE)
a<-table.row.end(a)
a<-table.row.start(a)
a<-table.element(a,'Measure',header=TRUE)
a<-table.element(a,'Value',header=TRUE)
a<-table.element(a,'S.E.',header=TRUE)
a<-table.element(a,'Value/S.E.',header=TRUE)
a<-table.row.end(a)
a<-table.row.start(a)
a<-table.element(a,hyperlink('arithmetic_mean.htm', 'Arithmetic Mean', 'click to view the definition of the Arithmetic Mean'),header=TRUE)
a<-table.element(a,arm)
a<-table.element(a,hyperlink('arithmetic_mean_standard_error.htm', armse, 'click to view the definition of the Standard Error of the Arithmetic Mean'))
a<-table.element(a,armose)
a<-table.row.end(a)
a<-table.row.start(a)
a<-table.element(a,hyperlink('geometric_mean.htm', 'Geometric Mean', 'click to view the definition of the Geometric Mean'),header=TRUE)
a<-table.element(a,geo)
a<-table.element(a,'')
a<-table.row.end(a)
a<-table.row.start(a)
a<-table.element(a,hyperlink('harmonic_mean.htm', 'Harmonic Mean', 'click to view the definition of the Harmonic Mean'),header=TRUE)
a<-table.element(a,har)
a<-table.element(a,'')
a<-table.row.end(a)
a<-table.row.start(a)
a<-table.element(a,hyperlink('quadratic_mean.htm', 'Quadratic Mean', 'click to view the definition of the Quadratic Mean'),header=TRUE)
a<-table.element(a,qua)
a<-table.element(a,'')
a<-table.row.end(a)
for (j in 1:length(win[,1])) {
a<-table.row.start(a)
mylabel <- paste('Winsorized Mean (',j)
mylabel <- paste(mylabel,'/')
mylabel <- paste(mylabel,length(win[,1]))
mylabel <- paste(mylabel,')')
a<-table.element(a,hyperlink('winsorized_mean.htm', mylabel, 'click to view the definition of the Winsorized Mean'),header=TRUE)
a<-table.element(a,win[j,1])
a<-table.element(a,win[j,2])
a<-table.element(a,win[j,1]/win[j,2])
a<-table.row.end(a)
}
for (j in 1:length(tri[,1])) {
a<-table.row.start(a)
mylabel <- paste('Trimmed Mean (',j)
mylabel <- paste(mylabel,'/')
mylabel <- paste(mylabel,length(tri[,1]))
mylabel <- paste(mylabel,')')
a<-table.element(a,hyperlink('arithmetic_mean.htm', mylabel, 'click to view the definition of the Trimmed Mean'),header=TRUE)
a<-table.element(a,tri[j,1])
a<-table.element(a,tri[j,2])
a<-table.element(a,tri[j,1]/tri[j,2])
a<-table.row.end(a)
}
a<-table.row.start(a)
a<-table.element(a,hyperlink('median_1.htm', 'Median', 'click to view the definition of the Median'),header=TRUE)
a<-table.element(a,median(x))
a<-table.element(a,'')
a<-table.row.end(a)
a<-table.row.start(a)
a<-table.element(a,hyperlink('midrange.htm', 'Midrange', 'click to view the definition of the Midrange'),header=TRUE)
a<-table.element(a,midr)
a<-table.element(a,'')
a<-table.row.end(a)
a<-table.row.start(a)
mymid <- hyperlink('midmean.htm', 'Midmean', 'click to view the definition of the Midmean')
mylabel <- paste(mymid,hyperlink('method_1.htm','Weighted Average at Xnp',''),sep=' - ')
a<-table.element(a,mylabel,header=TRUE)
a<-table.element(a,midm[1])
a<-table.element(a,'')
a<-table.row.end(a)
a<-table.row.start(a)
mymid <- hyperlink('midmean.htm', 'Midmean', 'click to view the definition of the Midmean')
mylabel <- paste(mymid,hyperlink('method_2.htm','Weighted Average at X(n+1)p',''),sep=' - ')
a<-table.element(a,mylabel,header=TRUE)
a<-table.element(a,midm[2])
a<-table.element(a,'')
a<-table.row.end(a)
a<-table.row.start(a)
mymid <- hyperlink('midmean.htm', 'Midmean', 'click to view the definition of the Midmean')
mylabel <- paste(mymid,hyperlink('method_3.htm','Empirical Distribution Function',''),sep=' - ')
a<-table.element(a,mylabel,header=TRUE)
a<-table.element(a,midm[3])
a<-table.element(a,'')
a<-table.row.end(a)
a<-table.row.start(a)
mymid <- hyperlink('midmean.htm', 'Midmean', 'click to view the definition of the Midmean')
mylabel <- paste(mymid,hyperlink('method_4.htm','Empirical Distribution Function - Averaging',''),sep=' - ')
a<-table.element(a,mylabel,header=TRUE)
a<-table.element(a,midm[4])
a<-table.element(a,'')
a<-table.row.end(a)
a<-table.row.start(a)
mymid <- hyperlink('midmean.htm', 'Midmean', 'click to view the definition of the Midmean')
mylabel <- paste(mymid,hyperlink('method_5.htm','Empirical Distribution Function - Interpolation',''),sep=' - ')
a<-table.element(a,mylabel,header=TRUE)
a<-table.element(a,midm[5])
a<-table.element(a,'')
a<-table.row.end(a)
a<-table.row.start(a)
mymid <- hyperlink('midmean.htm', 'Midmean', 'click to view the definition of the Midmean')
mylabel <- paste(mymid,hyperlink('method_6.htm','Closest Observation',''),sep=' - ')
a<-table.element(a,mylabel,header=TRUE)
a<-table.element(a,midm[6])
a<-table.element(a,'')
a<-table.row.end(a)
a<-table.row.start(a)
mymid <- hyperlink('midmean.htm', 'Midmean', 'click to view the definition of the Midmean')
mylabel <- paste(mymid,hyperlink('method_7.htm','True Basic - Statistics Graphics Toolkit',''),sep=' - ')
a<-table.element(a,mylabel,header=TRUE)
a<-table.element(a,midm[7])
a<-table.element(a,'')
a<-table.row.end(a)
a<-table.row.start(a)
mymid <- hyperlink('midmean.htm', 'Midmean', 'click to view the definition of the Midmean')
mylabel <- paste(mymid,hyperlink('method_8.htm','MS Excel (old versions)',''),sep=' - ')
a<-table.element(a,mylabel,header=TRUE)
a<-table.element(a,midm[8])
a<-table.element(a,'')
a<-table.row.end(a)
a<-table.row.start(a)
a<-table.element(a,'Number of observations',header=TRUE)
a<-table.element(a,length(x))
a<-table.element(a,'')
a<-table.row.end(a)
a<-table.end(a)
table.save(a,file='mytable.tab')