Free Statistics

of Irreproducible Research!

Author's title

Author*The author of this computation has been verified*
R Software Modulerwasp_autocorrelation.wasp
Title produced by software(Partial) Autocorrelation Function
Date of computationThu, 18 Dec 2008 04:38:58 -0700
Cite this page as followsStatistical Computations at FreeStatistics.org, Office for Research Development and Education, URL https://freestatistics.org/blog/index.php?v=date/2008/Dec/18/t122960044054vkgctzqpqcety.htm/, Retrieved Sat, 11 May 2024 04:10:22 +0000
Statistical Computations at FreeStatistics.org, Office for Research Development and Education, URL https://freestatistics.org/blog/index.php?pk=34666, Retrieved Sat, 11 May 2024 04:10:22 +0000
QR Codes:

Original text written by user:
IsPrivate?No (this computation is public)
User-defined keywords
Estimated Impact187
Family? (F = Feedback message, R = changed R code, M = changed R Module, P = changed Parameters, D = changed Data)
-     [Mean Plot] [Gilliam Schoorel] [2008-11-06 14:07:56] [666bda00bbd072dde5655a1423b1377b]
- RM D  [Variance Reduction Matrix] [VRM suiker] [2008-12-09 16:07:08] [f77c9ab3b413812d7baee6b7ec69a15d]
- RMPD    [(Partial) Autocorrelation Function] [ACF chocopasta zo...] [2008-12-18 11:31:51] [f77c9ab3b413812d7baee6b7ec69a15d]
-   P         [(Partial) Autocorrelation Function] [ACF chocopasta me...] [2008-12-18 11:38:58] [3fc0b50a130253095e963177b0139835] [Current]
-  MPD          [(Partial) Autocorrelation Function] [autocorrelatie na...] [2010-12-06 13:29:52] [ff7c1e95cf99a1dae07ec89975494dde]
Feedback Forum

Post a new message
Dataseries X:
101.73
101.63
101.43
101.34
101.01
100.89
100.93
100.77
100.3
99.86
99.71
99.93
99.88
99.92
99.87
99.63
100.05
99.88
100.11
100.05
100.07
100.2
100.21
99.76
99.41
99.24
99.65
99.7
99.79
99.84
101
101.62
101.98
101.46
102.28
102.14
102.02
102.21
101.61
102.38
102.19
102.04
101.76
101.9
102.01
102.37
103.04
103.42
103.76
104.41
104.75
104.28
103.89
104.09
103.8
105.03
105.86
106.04
106.03
106.13
107.21
107.66
108.08
108.76
108.26
108.71
108.65
108.61
108.86
109.54
108.22
108.77
109.9
110.13
109.6
110.42
110.6
109.73
110.72
111.08
111.14
111.01
110.56
111.57


Summary of computational transaction
Raw Inputview raw input (R code)
Raw Outputview raw output of R engine
Computing time1 seconds
R Server'Gwilym Jenkins' @ 72.249.127.135

\begin{tabular}{lllllllll}
\hline
Summary of computational transaction \tabularnewline
Raw Input & view raw input (R code)  \tabularnewline
Raw Output & view raw output of R engine  \tabularnewline
Computing time & 1 seconds \tabularnewline
R Server & 'Gwilym Jenkins' @ 72.249.127.135 \tabularnewline
\hline
\end{tabular}
%Source: https://freestatistics.org/blog/index.php?pk=34666&T=0

[TABLE]
[ROW][C]Summary of computational transaction[/C][/ROW]
[ROW][C]Raw Input[/C][C]view raw input (R code) [/C][/ROW]
[ROW][C]Raw Output[/C][C]view raw output of R engine [/C][/ROW]
[ROW][C]Computing time[/C][C]1 seconds[/C][/ROW]
[ROW][C]R Server[/C][C]'Gwilym Jenkins' @ 72.249.127.135[/C][/ROW]
[/TABLE]
Source: https://freestatistics.org/blog/index.php?pk=34666&T=0

Globally Unique Identifier (entire table): ba.freestatistics.org/blog/index.php?pk=34666&T=0

As an alternative you can also use a QR Code:  

The GUIDs for individual cells are displayed in the table below:

Summary of computational transaction
Raw Inputview raw input (R code)
Raw Outputview raw output of R engine
Computing time1 seconds
R Server'Gwilym Jenkins' @ 72.249.127.135


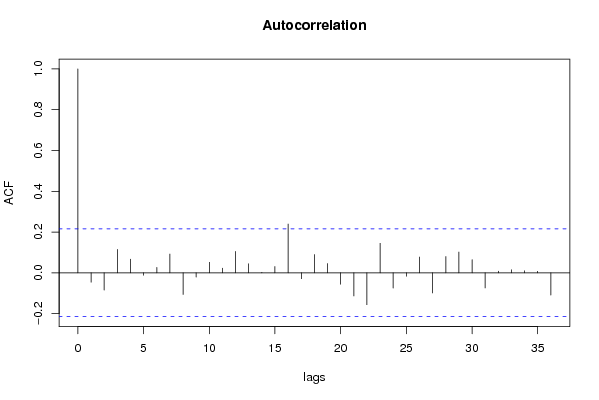
Autocorrelation Function
Time lag kACF(k)T-STATP-value
1-0.046118-0.42020.337729
2-0.084984-0.77420.220494
30.1145461.04360.149859
40.0668940.60940.271952
5-0.011796-0.10750.45734
60.0265670.2420.404676
70.091990.83810.202199
8-0.106453-0.96980.167474
9-0.021225-0.19340.423572
100.0515490.46960.319925
110.0228690.20830.417736
120.1048660.95540.171081
130.0442390.4030.343979
140.0017810.01620.493545
150.0307040.27970.390191
160.2388082.17560.016213
17-0.028883-0.26310.396548
180.089730.81750.207997
190.0450050.410.341426
20-0.055618-0.50670.306854
21-0.113601-1.0350.151849
22-0.15618-1.42290.079262
230.1448911.320.095229
24-0.07507-0.68390.247966
25-0.016496-0.15030.440453
260.0769820.70130.242525
27-0.098516-0.89750.186017
280.0796130.72530.235151
290.1018860.92820.177992
300.06460.58850.278885
31-0.074518-0.67890.249549
320.008160.07430.470459
330.0149660.13640.445937
340.0099170.09030.464115
350.0072040.06560.473916
36-0.109485-0.99750.16072

\begin{tabular}{lllllllll}
\hline
Autocorrelation Function \tabularnewline
Time lag k & ACF(k) & T-STAT & P-value \tabularnewline
1 & -0.046118 & -0.4202 & 0.337729 \tabularnewline
2 & -0.084984 & -0.7742 & 0.220494 \tabularnewline
3 & 0.114546 & 1.0436 & 0.149859 \tabularnewline
4 & 0.066894 & 0.6094 & 0.271952 \tabularnewline
5 & -0.011796 & -0.1075 & 0.45734 \tabularnewline
6 & 0.026567 & 0.242 & 0.404676 \tabularnewline
7 & 0.09199 & 0.8381 & 0.202199 \tabularnewline
8 & -0.106453 & -0.9698 & 0.167474 \tabularnewline
9 & -0.021225 & -0.1934 & 0.423572 \tabularnewline
10 & 0.051549 & 0.4696 & 0.319925 \tabularnewline
11 & 0.022869 & 0.2083 & 0.417736 \tabularnewline
12 & 0.104866 & 0.9554 & 0.171081 \tabularnewline
13 & 0.044239 & 0.403 & 0.343979 \tabularnewline
14 & 0.001781 & 0.0162 & 0.493545 \tabularnewline
15 & 0.030704 & 0.2797 & 0.390191 \tabularnewline
16 & 0.238808 & 2.1756 & 0.016213 \tabularnewline
17 & -0.028883 & -0.2631 & 0.396548 \tabularnewline
18 & 0.08973 & 0.8175 & 0.207997 \tabularnewline
19 & 0.045005 & 0.41 & 0.341426 \tabularnewline
20 & -0.055618 & -0.5067 & 0.306854 \tabularnewline
21 & -0.113601 & -1.035 & 0.151849 \tabularnewline
22 & -0.15618 & -1.4229 & 0.079262 \tabularnewline
23 & 0.144891 & 1.32 & 0.095229 \tabularnewline
24 & -0.07507 & -0.6839 & 0.247966 \tabularnewline
25 & -0.016496 & -0.1503 & 0.440453 \tabularnewline
26 & 0.076982 & 0.7013 & 0.242525 \tabularnewline
27 & -0.098516 & -0.8975 & 0.186017 \tabularnewline
28 & 0.079613 & 0.7253 & 0.235151 \tabularnewline
29 & 0.101886 & 0.9282 & 0.177992 \tabularnewline
30 & 0.0646 & 0.5885 & 0.278885 \tabularnewline
31 & -0.074518 & -0.6789 & 0.249549 \tabularnewline
32 & 0.00816 & 0.0743 & 0.470459 \tabularnewline
33 & 0.014966 & 0.1364 & 0.445937 \tabularnewline
34 & 0.009917 & 0.0903 & 0.464115 \tabularnewline
35 & 0.007204 & 0.0656 & 0.473916 \tabularnewline
36 & -0.109485 & -0.9975 & 0.16072 \tabularnewline
\hline
\end{tabular}
%Source: https://freestatistics.org/blog/index.php?pk=34666&T=1

[TABLE]
[ROW][C]Autocorrelation Function[/C][/ROW]
[ROW][C]Time lag k[/C][C]ACF(k)[/C][C]T-STAT[/C][C]P-value[/C][/ROW]
[ROW][C]1[/C][C]-0.046118[/C][C]-0.4202[/C][C]0.337729[/C][/ROW]
[ROW][C]2[/C][C]-0.084984[/C][C]-0.7742[/C][C]0.220494[/C][/ROW]
[ROW][C]3[/C][C]0.114546[/C][C]1.0436[/C][C]0.149859[/C][/ROW]
[ROW][C]4[/C][C]0.066894[/C][C]0.6094[/C][C]0.271952[/C][/ROW]
[ROW][C]5[/C][C]-0.011796[/C][C]-0.1075[/C][C]0.45734[/C][/ROW]
[ROW][C]6[/C][C]0.026567[/C][C]0.242[/C][C]0.404676[/C][/ROW]
[ROW][C]7[/C][C]0.09199[/C][C]0.8381[/C][C]0.202199[/C][/ROW]
[ROW][C]8[/C][C]-0.106453[/C][C]-0.9698[/C][C]0.167474[/C][/ROW]
[ROW][C]9[/C][C]-0.021225[/C][C]-0.1934[/C][C]0.423572[/C][/ROW]
[ROW][C]10[/C][C]0.051549[/C][C]0.4696[/C][C]0.319925[/C][/ROW]
[ROW][C]11[/C][C]0.022869[/C][C]0.2083[/C][C]0.417736[/C][/ROW]
[ROW][C]12[/C][C]0.104866[/C][C]0.9554[/C][C]0.171081[/C][/ROW]
[ROW][C]13[/C][C]0.044239[/C][C]0.403[/C][C]0.343979[/C][/ROW]
[ROW][C]14[/C][C]0.001781[/C][C]0.0162[/C][C]0.493545[/C][/ROW]
[ROW][C]15[/C][C]0.030704[/C][C]0.2797[/C][C]0.390191[/C][/ROW]
[ROW][C]16[/C][C]0.238808[/C][C]2.1756[/C][C]0.016213[/C][/ROW]
[ROW][C]17[/C][C]-0.028883[/C][C]-0.2631[/C][C]0.396548[/C][/ROW]
[ROW][C]18[/C][C]0.08973[/C][C]0.8175[/C][C]0.207997[/C][/ROW]
[ROW][C]19[/C][C]0.045005[/C][C]0.41[/C][C]0.341426[/C][/ROW]
[ROW][C]20[/C][C]-0.055618[/C][C]-0.5067[/C][C]0.306854[/C][/ROW]
[ROW][C]21[/C][C]-0.113601[/C][C]-1.035[/C][C]0.151849[/C][/ROW]
[ROW][C]22[/C][C]-0.15618[/C][C]-1.4229[/C][C]0.079262[/C][/ROW]
[ROW][C]23[/C][C]0.144891[/C][C]1.32[/C][C]0.095229[/C][/ROW]
[ROW][C]24[/C][C]-0.07507[/C][C]-0.6839[/C][C]0.247966[/C][/ROW]
[ROW][C]25[/C][C]-0.016496[/C][C]-0.1503[/C][C]0.440453[/C][/ROW]
[ROW][C]26[/C][C]0.076982[/C][C]0.7013[/C][C]0.242525[/C][/ROW]
[ROW][C]27[/C][C]-0.098516[/C][C]-0.8975[/C][C]0.186017[/C][/ROW]
[ROW][C]28[/C][C]0.079613[/C][C]0.7253[/C][C]0.235151[/C][/ROW]
[ROW][C]29[/C][C]0.101886[/C][C]0.9282[/C][C]0.177992[/C][/ROW]
[ROW][C]30[/C][C]0.0646[/C][C]0.5885[/C][C]0.278885[/C][/ROW]
[ROW][C]31[/C][C]-0.074518[/C][C]-0.6789[/C][C]0.249549[/C][/ROW]
[ROW][C]32[/C][C]0.00816[/C][C]0.0743[/C][C]0.470459[/C][/ROW]
[ROW][C]33[/C][C]0.014966[/C][C]0.1364[/C][C]0.445937[/C][/ROW]
[ROW][C]34[/C][C]0.009917[/C][C]0.0903[/C][C]0.464115[/C][/ROW]
[ROW][C]35[/C][C]0.007204[/C][C]0.0656[/C][C]0.473916[/C][/ROW]
[ROW][C]36[/C][C]-0.109485[/C][C]-0.9975[/C][C]0.16072[/C][/ROW]
[/TABLE]
Source: https://freestatistics.org/blog/index.php?pk=34666&T=1

Globally Unique Identifier (entire table): ba.freestatistics.org/blog/index.php?pk=34666&T=1

As an alternative you can also use a QR Code:  

The GUIDs for individual cells are displayed in the table below:

Autocorrelation Function
Time lag kACF(k)T-STATP-value
1-0.046118-0.42020.337729
2-0.084984-0.77420.220494
30.1145461.04360.149859
40.0668940.60940.271952
5-0.011796-0.10750.45734
60.0265670.2420.404676
70.091990.83810.202199
8-0.106453-0.96980.167474
9-0.021225-0.19340.423572
100.0515490.46960.319925
110.0228690.20830.417736
120.1048660.95540.171081
130.0442390.4030.343979
140.0017810.01620.493545
150.0307040.27970.390191
160.2388082.17560.016213
17-0.028883-0.26310.396548
180.089730.81750.207997
190.0450050.410.341426
20-0.055618-0.50670.306854
21-0.113601-1.0350.151849
22-0.15618-1.42290.079262
230.1448911.320.095229
24-0.07507-0.68390.247966
25-0.016496-0.15030.440453
260.0769820.70130.242525
27-0.098516-0.89750.186017
280.0796130.72530.235151
290.1018860.92820.177992
300.06460.58850.278885
31-0.074518-0.67890.249549
320.008160.07430.470459
330.0149660.13640.445937
340.0099170.09030.464115
350.0072040.06560.473916
36-0.109485-0.99750.16072


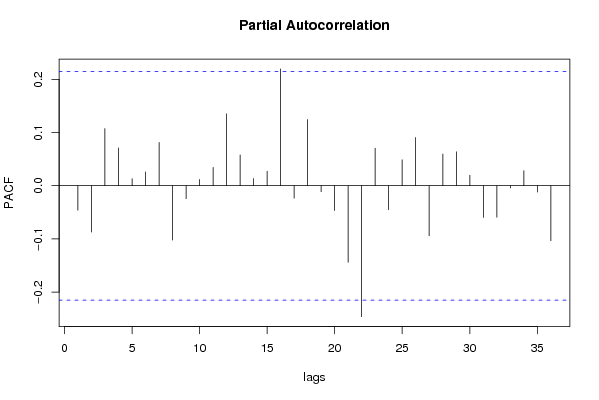
Partial Autocorrelation Function
Time lag kPACF(k)T-STATP-value
1-0.046118-0.42020.337729
2-0.087296-0.79530.214352
30.1073030.97760.165562
40.0710530.64730.259604
50.0131430.11970.452489
60.025810.23510.407339
70.0812870.74060.230525
8-0.102194-0.9310.177269
9-0.024545-0.22360.411804
100.0118390.10790.457183
110.0343880.31330.377424
120.1350861.23070.110958
130.0579080.52760.299602
140.01350.1230.451205
150.0272390.24820.402312
160.2195211.99990.024389
17-0.023468-0.21380.415614
180.1243111.13250.130338
19-0.011381-0.10370.458836
20-0.046817-0.42650.335417
21-0.144162-1.31340.096337
22-0.246293-2.24380.013753
230.0704620.64190.261342
24-0.04514-0.41120.340976
250.0486190.44290.32948
260.0905410.82490.205905
27-0.094313-0.85920.196344
280.059580.54280.294361
290.0637380.58070.281513
300.0194620.17730.429848
31-0.059804-0.54480.293661
32-0.059163-0.5390.295665
33-0.004349-0.03960.484246
340.02810.2560.39929
35-0.011906-0.10850.456943
36-0.103466-0.94260.174305

\begin{tabular}{lllllllll}
\hline
Partial Autocorrelation Function \tabularnewline
Time lag k & PACF(k) & T-STAT & P-value \tabularnewline
1 & -0.046118 & -0.4202 & 0.337729 \tabularnewline
2 & -0.087296 & -0.7953 & 0.214352 \tabularnewline
3 & 0.107303 & 0.9776 & 0.165562 \tabularnewline
4 & 0.071053 & 0.6473 & 0.259604 \tabularnewline
5 & 0.013143 & 0.1197 & 0.452489 \tabularnewline
6 & 0.02581 & 0.2351 & 0.407339 \tabularnewline
7 & 0.081287 & 0.7406 & 0.230525 \tabularnewline
8 & -0.102194 & -0.931 & 0.177269 \tabularnewline
9 & -0.024545 & -0.2236 & 0.411804 \tabularnewline
10 & 0.011839 & 0.1079 & 0.457183 \tabularnewline
11 & 0.034388 & 0.3133 & 0.377424 \tabularnewline
12 & 0.135086 & 1.2307 & 0.110958 \tabularnewline
13 & 0.057908 & 0.5276 & 0.299602 \tabularnewline
14 & 0.0135 & 0.123 & 0.451205 \tabularnewline
15 & 0.027239 & 0.2482 & 0.402312 \tabularnewline
16 & 0.219521 & 1.9999 & 0.024389 \tabularnewline
17 & -0.023468 & -0.2138 & 0.415614 \tabularnewline
18 & 0.124311 & 1.1325 & 0.130338 \tabularnewline
19 & -0.011381 & -0.1037 & 0.458836 \tabularnewline
20 & -0.046817 & -0.4265 & 0.335417 \tabularnewline
21 & -0.144162 & -1.3134 & 0.096337 \tabularnewline
22 & -0.246293 & -2.2438 & 0.013753 \tabularnewline
23 & 0.070462 & 0.6419 & 0.261342 \tabularnewline
24 & -0.04514 & -0.4112 & 0.340976 \tabularnewline
25 & 0.048619 & 0.4429 & 0.32948 \tabularnewline
26 & 0.090541 & 0.8249 & 0.205905 \tabularnewline
27 & -0.094313 & -0.8592 & 0.196344 \tabularnewline
28 & 0.05958 & 0.5428 & 0.294361 \tabularnewline
29 & 0.063738 & 0.5807 & 0.281513 \tabularnewline
30 & 0.019462 & 0.1773 & 0.429848 \tabularnewline
31 & -0.059804 & -0.5448 & 0.293661 \tabularnewline
32 & -0.059163 & -0.539 & 0.295665 \tabularnewline
33 & -0.004349 & -0.0396 & 0.484246 \tabularnewline
34 & 0.0281 & 0.256 & 0.39929 \tabularnewline
35 & -0.011906 & -0.1085 & 0.456943 \tabularnewline
36 & -0.103466 & -0.9426 & 0.174305 \tabularnewline
\hline
\end{tabular}
%Source: https://freestatistics.org/blog/index.php?pk=34666&T=2

[TABLE]
[ROW][C]Partial Autocorrelation Function[/C][/ROW]
[ROW][C]Time lag k[/C][C]PACF(k)[/C][C]T-STAT[/C][C]P-value[/C][/ROW]
[ROW][C]1[/C][C]-0.046118[/C][C]-0.4202[/C][C]0.337729[/C][/ROW]
[ROW][C]2[/C][C]-0.087296[/C][C]-0.7953[/C][C]0.214352[/C][/ROW]
[ROW][C]3[/C][C]0.107303[/C][C]0.9776[/C][C]0.165562[/C][/ROW]
[ROW][C]4[/C][C]0.071053[/C][C]0.6473[/C][C]0.259604[/C][/ROW]
[ROW][C]5[/C][C]0.013143[/C][C]0.1197[/C][C]0.452489[/C][/ROW]
[ROW][C]6[/C][C]0.02581[/C][C]0.2351[/C][C]0.407339[/C][/ROW]
[ROW][C]7[/C][C]0.081287[/C][C]0.7406[/C][C]0.230525[/C][/ROW]
[ROW][C]8[/C][C]-0.102194[/C][C]-0.931[/C][C]0.177269[/C][/ROW]
[ROW][C]9[/C][C]-0.024545[/C][C]-0.2236[/C][C]0.411804[/C][/ROW]
[ROW][C]10[/C][C]0.011839[/C][C]0.1079[/C][C]0.457183[/C][/ROW]
[ROW][C]11[/C][C]0.034388[/C][C]0.3133[/C][C]0.377424[/C][/ROW]
[ROW][C]12[/C][C]0.135086[/C][C]1.2307[/C][C]0.110958[/C][/ROW]
[ROW][C]13[/C][C]0.057908[/C][C]0.5276[/C][C]0.299602[/C][/ROW]
[ROW][C]14[/C][C]0.0135[/C][C]0.123[/C][C]0.451205[/C][/ROW]
[ROW][C]15[/C][C]0.027239[/C][C]0.2482[/C][C]0.402312[/C][/ROW]
[ROW][C]16[/C][C]0.219521[/C][C]1.9999[/C][C]0.024389[/C][/ROW]
[ROW][C]17[/C][C]-0.023468[/C][C]-0.2138[/C][C]0.415614[/C][/ROW]
[ROW][C]18[/C][C]0.124311[/C][C]1.1325[/C][C]0.130338[/C][/ROW]
[ROW][C]19[/C][C]-0.011381[/C][C]-0.1037[/C][C]0.458836[/C][/ROW]
[ROW][C]20[/C][C]-0.046817[/C][C]-0.4265[/C][C]0.335417[/C][/ROW]
[ROW][C]21[/C][C]-0.144162[/C][C]-1.3134[/C][C]0.096337[/C][/ROW]
[ROW][C]22[/C][C]-0.246293[/C][C]-2.2438[/C][C]0.013753[/C][/ROW]
[ROW][C]23[/C][C]0.070462[/C][C]0.6419[/C][C]0.261342[/C][/ROW]
[ROW][C]24[/C][C]-0.04514[/C][C]-0.4112[/C][C]0.340976[/C][/ROW]
[ROW][C]25[/C][C]0.048619[/C][C]0.4429[/C][C]0.32948[/C][/ROW]
[ROW][C]26[/C][C]0.090541[/C][C]0.8249[/C][C]0.205905[/C][/ROW]
[ROW][C]27[/C][C]-0.094313[/C][C]-0.8592[/C][C]0.196344[/C][/ROW]
[ROW][C]28[/C][C]0.05958[/C][C]0.5428[/C][C]0.294361[/C][/ROW]
[ROW][C]29[/C][C]0.063738[/C][C]0.5807[/C][C]0.281513[/C][/ROW]
[ROW][C]30[/C][C]0.019462[/C][C]0.1773[/C][C]0.429848[/C][/ROW]
[ROW][C]31[/C][C]-0.059804[/C][C]-0.5448[/C][C]0.293661[/C][/ROW]
[ROW][C]32[/C][C]-0.059163[/C][C]-0.539[/C][C]0.295665[/C][/ROW]
[ROW][C]33[/C][C]-0.004349[/C][C]-0.0396[/C][C]0.484246[/C][/ROW]
[ROW][C]34[/C][C]0.0281[/C][C]0.256[/C][C]0.39929[/C][/ROW]
[ROW][C]35[/C][C]-0.011906[/C][C]-0.1085[/C][C]0.456943[/C][/ROW]
[ROW][C]36[/C][C]-0.103466[/C][C]-0.9426[/C][C]0.174305[/C][/ROW]
[/TABLE]
Source: https://freestatistics.org/blog/index.php?pk=34666&T=2

Globally Unique Identifier (entire table): ba.freestatistics.org/blog/index.php?pk=34666&T=2

As an alternative you can also use a QR Code:  

The GUIDs for individual cells are displayed in the table below:

Partial Autocorrelation Function
Time lag kPACF(k)T-STATP-value
1-0.046118-0.42020.337729
2-0.087296-0.79530.214352
30.1073030.97760.165562
40.0710530.64730.259604
50.0131430.11970.452489
60.025810.23510.407339
70.0812870.74060.230525
8-0.102194-0.9310.177269
9-0.024545-0.22360.411804
100.0118390.10790.457183
110.0343880.31330.377424
120.1350861.23070.110958
130.0579080.52760.299602
140.01350.1230.451205
150.0272390.24820.402312
160.2195211.99990.024389
17-0.023468-0.21380.415614
180.1243111.13250.130338
19-0.011381-0.10370.458836
20-0.046817-0.42650.335417
21-0.144162-1.31340.096337
22-0.246293-2.24380.013753
230.0704620.64190.261342
24-0.04514-0.41120.340976
250.0486190.44290.32948
260.0905410.82490.205905
27-0.094313-0.85920.196344
280.059580.54280.294361
290.0637380.58070.281513
300.0194620.17730.429848
31-0.059804-0.54480.293661
32-0.059163-0.5390.295665
33-0.004349-0.03960.484246
340.02810.2560.39929
35-0.011906-0.10850.456943
36-0.103466-0.94260.174305


Parameters (Session):
par1 = 36 ; par2 = 1 ; par3 = 1 ; par4 = 0 ; par5 = 12 ;
Parameters (R input):
par1 = 36 ; par2 = 1 ; par3 = 1 ; par4 = 0 ; par5 = 12 ;
R code (references can be found in the software module):
if (par1 == 'Default') {
par1 = 10*log10(length(x))
} else {
par1 <- as.numeric(par1)
}
par2 <- as.numeric(par2)
par3 <- as.numeric(par3)
par4 <- as.numeric(par4)
par5 <- as.numeric(par5)
if (par2 == 0) {
x <- log(x)
} else {
x <- (x ^ par2 - 1) / par2
}
if (par3 > 0) x <- diff(x,lag=1,difference=par3)
if (par4 > 0) x <- diff(x,lag=par5,difference=par4)
bitmap(file='pic1.png')
racf <- acf(x,par1,main='Autocorrelation',xlab='lags',ylab='ACF')
dev.off()
bitmap(file='pic2.png')
rpacf <- pacf(x,par1,main='Partial Autocorrelation',xlab='lags',ylab='PACF')
dev.off()
(myacf <- c(racf$acf))
(mypacf <- c(rpacf$acf))
lengthx <- length(x)
sqrtn <- sqrt(lengthx)
load(file='createtable')
a<-table.start()
a<-table.row.start(a)
a<-table.element(a,'Autocorrelation Function',4,TRUE)
a<-table.row.end(a)
a<-table.row.start(a)
a<-table.element(a,'Time lag k',header=TRUE)
a<-table.element(a,hyperlink('basics.htm','ACF(k)','click here for more information about the Autocorrelation Function'),header=TRUE)
a<-table.element(a,'T-STAT',header=TRUE)
a<-table.element(a,'P-value',header=TRUE)
a<-table.row.end(a)
for (i in 2:(par1+1)) {
a<-table.row.start(a)
a<-table.element(a,i-1,header=TRUE)
a<-table.element(a,round(myacf[i],6))
mytstat <- myacf[i]*sqrtn
a<-table.element(a,round(mytstat,4))
a<-table.element(a,round(1-pt(abs(mytstat),lengthx),6))
a<-table.row.end(a)
}
a<-table.end(a)
table.save(a,file='mytable.tab')
a<-table.start()
a<-table.row.start(a)
a<-table.element(a,'Partial Autocorrelation Function',4,TRUE)
a<-table.row.end(a)
a<-table.row.start(a)
a<-table.element(a,'Time lag k',header=TRUE)
a<-table.element(a,hyperlink('basics.htm','PACF(k)','click here for more information about the Partial Autocorrelation Function'),header=TRUE)
a<-table.element(a,'T-STAT',header=TRUE)
a<-table.element(a,'P-value',header=TRUE)
a<-table.row.end(a)
for (i in 1:par1) {
a<-table.row.start(a)
a<-table.element(a,i,header=TRUE)
a<-table.element(a,round(mypacf[i],6))
mytstat <- mypacf[i]*sqrtn
a<-table.element(a,round(mytstat,4))
a<-table.element(a,round(1-pt(abs(mytstat),lengthx),6))
a<-table.row.end(a)
}
a<-table.end(a)
table.save(a,file='mytable1.tab')