Free Statistics

of Irreproducible Research!

Author's title

Author*The author of this computation has been verified*
R Software Modulerwasp_arimabackwardselection.wasp
Title produced by softwareARIMA Backward Selection
Date of computationThu, 18 Dec 2008 04:08:22 -0700
Cite this page as followsStatistical Computations at FreeStatistics.org, Office for Research Development and Education, URL https://freestatistics.org/blog/index.php?v=date/2008/Dec/18/t1229598716clknuhecklp6wbt.htm/, Retrieved Sat, 11 May 2024 08:37:36 +0000
Statistical Computations at FreeStatistics.org, Office for Research Development and Education, URL https://freestatistics.org/blog/index.php?pk=34647, Retrieved Sat, 11 May 2024 08:37:36 +0000
QR Codes:

Original text written by user:in samenwerking met kevin engels, stéphanie claes, katrien bourdiaudhy
IsPrivate?No (this computation is public)
User-defined keywords
Estimated Impact229
Family? (F = Feedback message, R = changed R code, M = changed R Module, P = changed Parameters, D = changed Data)
F     [Univariate Data Series] [blog 1e tijdreeks...] [2008-10-13 19:23:31] [7173087adebe3e3a714c80ea2417b3eb]
-   PD  [Univariate Data Series] [tijdreeksen opnie...] [2008-10-19 17:18:46] [7173087adebe3e3a714c80ea2417b3eb]
- RMP     [Central Tendency] [tijdreeks 2 centr...] [2008-10-19 17:39:42] [7173087adebe3e3a714c80ea2417b3eb]
- RMP       [(Partial) Autocorrelation Function] [ACF aanvragen hyp...] [2008-12-16 14:51:47] [7d3039e6253bb5fb3b26df1537d500b4]
- RMP         [ARIMA Backward Selection] [Arima backward aa...] [2008-12-16 15:38:56] [7d3039e6253bb5fb3b26df1537d500b4]
- RMP           [(Partial) Autocorrelation Function] [acf hypothecair k...] [2008-12-17 15:13:05] [7173087adebe3e3a714c80ea2417b3eb]
- RMP             [ARIMA Backward Selection] [Arima backward se...] [2008-12-17 19:36:16] [7d3039e6253bb5fb3b26df1537d500b4]
-   P                 [ARIMA Backward Selection] [Arima aanvragen h...] [2008-12-18 11:08:22] [35348cd8592af0baf5f138bd59921307] [Current]
- RMPD                  [Cross Correlation Function] [cross correlation] [2008-12-18 13:15:14] [7173087adebe3e3a714c80ea2417b3eb]
- RMPD                  [Cross Correlation Function] [cross correlation] [2008-12-18 13:27:32] [7173087adebe3e3a714c80ea2417b3eb]
- RMP                   [ARIMA Forecasting] [Arima Forecast hy...] [2008-12-22 12:55:27] [7d3039e6253bb5fb3b26df1537d500b4]
- RMP                   [ARIMA Forecasting] [forecast aantal a...] [2008-12-22 13:06:40] [7173087adebe3e3a714c80ea2417b3eb]
- RMP                   [ARIMA Forecasting] [Arima forecasting...] [2008-12-22 13:16:21] [c993f605b206b366f754f7f8c1fcc291]
Feedback Forum

Post a new message
Dataseries X:
2400
4700
3700
2900
2800
3000
3100
3700
3000
2000
1900
1900
1800
3400
3800
2800
3100
2100
2000
2500
2400
2500
3300
3100
3700
5600
3700
2900
4000
2900
2400
3300
3800
4400
4000
3100
2700
5200
4600
3700
3200
2400
2200
3200
3100
2300
2500
2900
2700
5000
3500
3000
3800
2800
2400
2700
2800
2700
2600
3100


Summary of computational transaction
Raw Inputview raw input (R code)
Raw Outputview raw output of R engine
Computing time7 seconds
R Server'Gwilym Jenkins' @ 72.249.127.135

\begin{tabular}{lllllllll}
\hline
Summary of computational transaction \tabularnewline
Raw Input & view raw input (R code)  \tabularnewline
Raw Output & view raw output of R engine  \tabularnewline
Computing time & 7 seconds \tabularnewline
R Server & 'Gwilym Jenkins' @ 72.249.127.135 \tabularnewline
\hline
\end{tabular}
%Source: https://freestatistics.org/blog/index.php?pk=34647&T=0

[TABLE]
[ROW][C]Summary of computational transaction[/C][/ROW]
[ROW][C]Raw Input[/C][C]view raw input (R code) [/C][/ROW]
[ROW][C]Raw Output[/C][C]view raw output of R engine [/C][/ROW]
[ROW][C]Computing time[/C][C]7 seconds[/C][/ROW]
[ROW][C]R Server[/C][C]'Gwilym Jenkins' @ 72.249.127.135[/C][/ROW]
[/TABLE]
Source: https://freestatistics.org/blog/index.php?pk=34647&T=0

Globally Unique Identifier (entire table): ba.freestatistics.org/blog/index.php?pk=34647&T=0

As an alternative you can also use a QR Code:  

The GUIDs for individual cells are displayed in the table below:

Summary of computational transaction
Raw Inputview raw input (R code)
Raw Outputview raw output of R engine
Computing time7 seconds
R Server'Gwilym Jenkins' @ 72.249.127.135


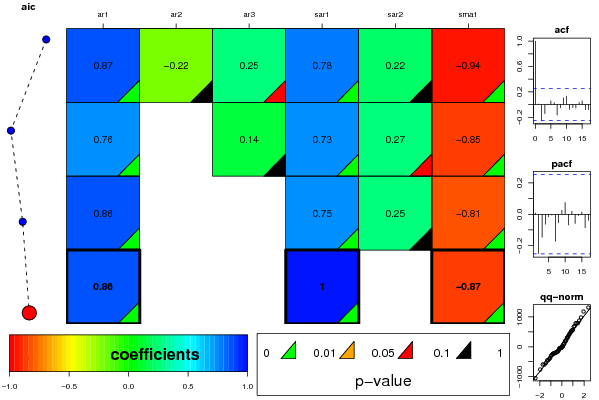
ARIMA Parameter Estimation and Backward Selection
Iterationar1ar2ar3sar1sar2sma1
Estimates ( 1 )0.8666-0.21650.24760.78010.2193-0.9406
(p-val)(0 )(0.2165 )(0.0559 )(0 )(0.1929 )(6e-04 )
Estimates ( 2 )0.759600.14410.72870.2674-0.8477
(p-val)(0 )(NA )(0.1514 )(0 )(0.0913 )(0 )
Estimates ( 3 )0.8636000.74690.2482-0.8124
(p-val)(0 )(NA )(NA )(0 )(0.1189 )(0 )
Estimates ( 4 )0.8575000.99670-0.8692
(p-val)(0 )(NA )(NA )(0 )(NA )(0 )
Estimates ( 5 )NANANANANANA
(p-val)(NA )(NA )(NA )(NA )(NA )(NA )
Estimates ( 6 )NANANANANANA
(p-val)(NA )(NA )(NA )(NA )(NA )(NA )
Estimates ( 7 )NANANANANANA
(p-val)(NA )(NA )(NA )(NA )(NA )(NA )
Estimates ( 8 )NANANANANANA
(p-val)(NA )(NA )(NA )(NA )(NA )(NA )
Estimates ( 9 )NANANANANANA
(p-val)(NA )(NA )(NA )(NA )(NA )(NA )
Estimates ( 10 )NANANANANANA
(p-val)(NA )(NA )(NA )(NA )(NA )(NA )
Estimates ( 11 )NANANANANANA
(p-val)(NA )(NA )(NA )(NA )(NA )(NA )

\begin{tabular}{lllllllll}
\hline
ARIMA Parameter Estimation and Backward Selection \tabularnewline
Iteration & ar1 & ar2 & ar3 & sar1 & sar2 & sma1 \tabularnewline
Estimates ( 1 ) & 0.8666 & -0.2165 & 0.2476 & 0.7801 & 0.2193 & -0.9406 \tabularnewline
(p-val) & (0 ) & (0.2165 ) & (0.0559 ) & (0 ) & (0.1929 ) & (6e-04 ) \tabularnewline
Estimates ( 2 ) & 0.7596 & 0 & 0.1441 & 0.7287 & 0.2674 & -0.8477 \tabularnewline
(p-val) & (0 ) & (NA ) & (0.1514 ) & (0 ) & (0.0913 ) & (0 ) \tabularnewline
Estimates ( 3 ) & 0.8636 & 0 & 0 & 0.7469 & 0.2482 & -0.8124 \tabularnewline
(p-val) & (0 ) & (NA ) & (NA ) & (0 ) & (0.1189 ) & (0 ) \tabularnewline
Estimates ( 4 ) & 0.8575 & 0 & 0 & 0.9967 & 0 & -0.8692 \tabularnewline
(p-val) & (0 ) & (NA ) & (NA ) & (0 ) & (NA ) & (0 ) \tabularnewline
Estimates ( 5 ) & NA & NA & NA & NA & NA & NA \tabularnewline
(p-val) & (NA ) & (NA ) & (NA ) & (NA ) & (NA ) & (NA ) \tabularnewline
Estimates ( 6 ) & NA & NA & NA & NA & NA & NA \tabularnewline
(p-val) & (NA ) & (NA ) & (NA ) & (NA ) & (NA ) & (NA ) \tabularnewline
Estimates ( 7 ) & NA & NA & NA & NA & NA & NA \tabularnewline
(p-val) & (NA ) & (NA ) & (NA ) & (NA ) & (NA ) & (NA ) \tabularnewline
Estimates ( 8 ) & NA & NA & NA & NA & NA & NA \tabularnewline
(p-val) & (NA ) & (NA ) & (NA ) & (NA ) & (NA ) & (NA ) \tabularnewline
Estimates ( 9 ) & NA & NA & NA & NA & NA & NA \tabularnewline
(p-val) & (NA ) & (NA ) & (NA ) & (NA ) & (NA ) & (NA ) \tabularnewline
Estimates ( 10 ) & NA & NA & NA & NA & NA & NA \tabularnewline
(p-val) & (NA ) & (NA ) & (NA ) & (NA ) & (NA ) & (NA ) \tabularnewline
Estimates ( 11 ) & NA & NA & NA & NA & NA & NA \tabularnewline
(p-val) & (NA ) & (NA ) & (NA ) & (NA ) & (NA ) & (NA ) \tabularnewline
\hline
\end{tabular}
%Source: https://freestatistics.org/blog/index.php?pk=34647&T=1

[TABLE]
[ROW][C]ARIMA Parameter Estimation and Backward Selection[/C][/ROW]
[ROW][C]Iteration[/C][C]ar1[/C][C]ar2[/C][C]ar3[/C][C]sar1[/C][C]sar2[/C][C]sma1[/C][/ROW]
[ROW][C]Estimates ( 1 )[/C][C]0.8666[/C][C]-0.2165[/C][C]0.2476[/C][C]0.7801[/C][C]0.2193[/C][C]-0.9406[/C][/ROW]
[ROW][C](p-val)[/C][C](0 )[/C][C](0.2165 )[/C][C](0.0559 )[/C][C](0 )[/C][C](0.1929 )[/C][C](6e-04 )[/C][/ROW]
[ROW][C]Estimates ( 2 )[/C][C]0.7596[/C][C]0[/C][C]0.1441[/C][C]0.7287[/C][C]0.2674[/C][C]-0.8477[/C][/ROW]
[ROW][C](p-val)[/C][C](0 )[/C][C](NA )[/C][C](0.1514 )[/C][C](0 )[/C][C](0.0913 )[/C][C](0 )[/C][/ROW]
[ROW][C]Estimates ( 3 )[/C][C]0.8636[/C][C]0[/C][C]0[/C][C]0.7469[/C][C]0.2482[/C][C]-0.8124[/C][/ROW]
[ROW][C](p-val)[/C][C](0 )[/C][C](NA )[/C][C](NA )[/C][C](0 )[/C][C](0.1189 )[/C][C](0 )[/C][/ROW]
[ROW][C]Estimates ( 4 )[/C][C]0.8575[/C][C]0[/C][C]0[/C][C]0.9967[/C][C]0[/C][C]-0.8692[/C][/ROW]
[ROW][C](p-val)[/C][C](0 )[/C][C](NA )[/C][C](NA )[/C][C](0 )[/C][C](NA )[/C][C](0 )[/C][/ROW]
[ROW][C]Estimates ( 5 )[/C][C]NA[/C][C]NA[/C][C]NA[/C][C]NA[/C][C]NA[/C][C]NA[/C][/ROW]
[ROW][C](p-val)[/C][C](NA )[/C][C](NA )[/C][C](NA )[/C][C](NA )[/C][C](NA )[/C][C](NA )[/C][/ROW]
[ROW][C]Estimates ( 6 )[/C][C]NA[/C][C]NA[/C][C]NA[/C][C]NA[/C][C]NA[/C][C]NA[/C][/ROW]
[ROW][C](p-val)[/C][C](NA )[/C][C](NA )[/C][C](NA )[/C][C](NA )[/C][C](NA )[/C][C](NA )[/C][/ROW]
[ROW][C]Estimates ( 7 )[/C][C]NA[/C][C]NA[/C][C]NA[/C][C]NA[/C][C]NA[/C][C]NA[/C][/ROW]
[ROW][C](p-val)[/C][C](NA )[/C][C](NA )[/C][C](NA )[/C][C](NA )[/C][C](NA )[/C][C](NA )[/C][/ROW]
[ROW][C]Estimates ( 8 )[/C][C]NA[/C][C]NA[/C][C]NA[/C][C]NA[/C][C]NA[/C][C]NA[/C][/ROW]
[ROW][C](p-val)[/C][C](NA )[/C][C](NA )[/C][C](NA )[/C][C](NA )[/C][C](NA )[/C][C](NA )[/C][/ROW]
[ROW][C]Estimates ( 9 )[/C][C]NA[/C][C]NA[/C][C]NA[/C][C]NA[/C][C]NA[/C][C]NA[/C][/ROW]
[ROW][C](p-val)[/C][C](NA )[/C][C](NA )[/C][C](NA )[/C][C](NA )[/C][C](NA )[/C][C](NA )[/C][/ROW]
[ROW][C]Estimates ( 10 )[/C][C]NA[/C][C]NA[/C][C]NA[/C][C]NA[/C][C]NA[/C][C]NA[/C][/ROW]
[ROW][C](p-val)[/C][C](NA )[/C][C](NA )[/C][C](NA )[/C][C](NA )[/C][C](NA )[/C][C](NA )[/C][/ROW]
[ROW][C]Estimates ( 11 )[/C][C]NA[/C][C]NA[/C][C]NA[/C][C]NA[/C][C]NA[/C][C]NA[/C][/ROW]
[ROW][C](p-val)[/C][C](NA )[/C][C](NA )[/C][C](NA )[/C][C](NA )[/C][C](NA )[/C][C](NA )[/C][/ROW]
[/TABLE]
Source: https://freestatistics.org/blog/index.php?pk=34647&T=1

Globally Unique Identifier (entire table): ba.freestatistics.org/blog/index.php?pk=34647&T=1

As an alternative you can also use a QR Code:  

The GUIDs for individual cells are displayed in the table below:

ARIMA Parameter Estimation and Backward Selection
Iterationar1ar2ar3sar1sar2sma1
Estimates ( 1 )0.8666-0.21650.24760.78010.2193-0.9406
(p-val)(0 )(0.2165 )(0.0559 )(0 )(0.1929 )(6e-04 )
Estimates ( 2 )0.759600.14410.72870.2674-0.8477
(p-val)(0 )(NA )(0.1514 )(0 )(0.0913 )(0 )
Estimates ( 3 )0.8636000.74690.2482-0.8124
(p-val)(0 )(NA )(NA )(0 )(0.1189 )(0 )
Estimates ( 4 )0.8575000.99670-0.8692
(p-val)(0 )(NA )(NA )(0 )(NA )(0 )
Estimates ( 5 )NANANANANANA
(p-val)(NA )(NA )(NA )(NA )(NA )(NA )
Estimates ( 6 )NANANANANANA
(p-val)(NA )(NA )(NA )(NA )(NA )(NA )
Estimates ( 7 )NANANANANANA
(p-val)(NA )(NA )(NA )(NA )(NA )(NA )
Estimates ( 8 )NANANANANANA
(p-val)(NA )(NA )(NA )(NA )(NA )(NA )
Estimates ( 9 )NANANANANANA
(p-val)(NA )(NA )(NA )(NA )(NA )(NA )
Estimates ( 10 )NANANANANANA
(p-val)(NA )(NA )(NA )(NA )(NA )(NA )
Estimates ( 11 )NANANANANANA
(p-val)(NA )(NA )(NA )(NA )(NA )(NA )


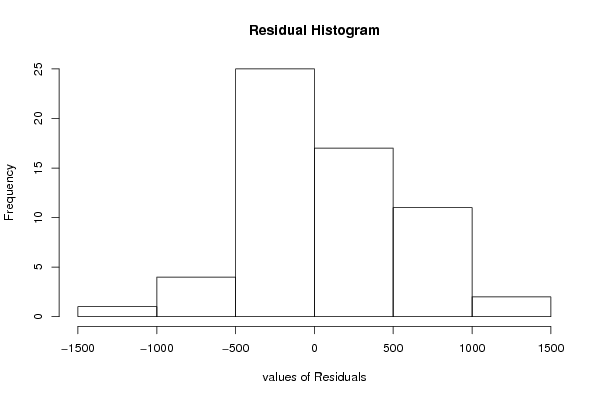
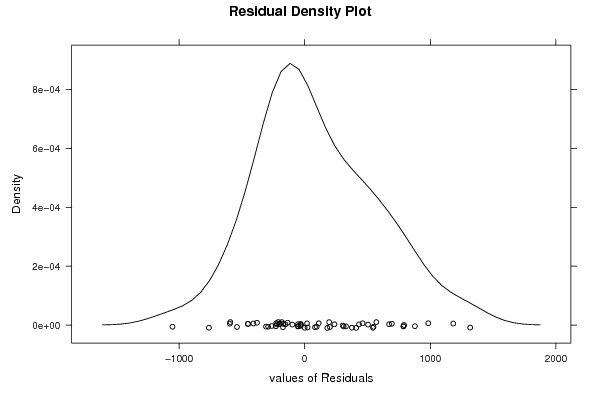
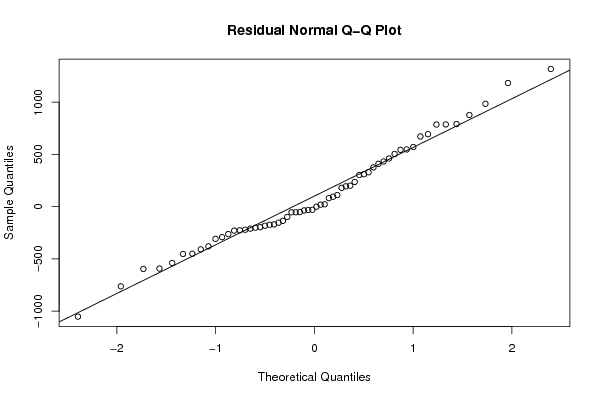
Estimated ARIMA Residuals
Value
547.995731502885
1317.93162356686
-225.796063410288
-201.439936222822
95.2531393167182
237.156438531592
195.021688881198
461.112478611811
-172.489813915744
-408.350112293751
-51.5036271703885
-35.4475857199179
-135.648989328892
-31.0896738469681
786.566228174453
-228.926422035591
310.731042079950
-761.891890818721
-181.829684536758
-29.6254758807332
201.262618678901
543.688466533747
694.274418155144
19.0576392268075
672.32310567441
329.555869703536
-1051.91311433509
23.2401709853333
984.446158159638
-595.480662047692
-379.213039348935
376.4319649403
877.796205928327
1183.08868730335
-169.168353166969
-449.998735569299
-291.129498897748
790.693677113256
0.0324588032688611
82.5292710412334
-538.595496455739
-210.09659489978
-97.723468179569
432.700099797742
180.700023867731
-452.313509487957
-53.1664298137714
570.912325224767
-261.74822528617
504.743795828869
-591.836458545287
303.220080155466
410.093934282324
-220.488053168112
-153.028507482072
-307.472292280229
111.847354608524
-53.4770185570314
-195.775230969551
787.020938587108

\begin{tabular}{lllllllll}
\hline
Estimated ARIMA Residuals \tabularnewline
Value \tabularnewline
 \tabularnewline
547.995731502885 \tabularnewline
1317.93162356686 \tabularnewline
-225.796063410288 \tabularnewline
-201.439936222822 \tabularnewline
95.2531393167182 \tabularnewline
237.156438531592 \tabularnewline
195.021688881198 \tabularnewline
461.112478611811 \tabularnewline
-172.489813915744 \tabularnewline
-408.350112293751 \tabularnewline
-51.5036271703885 \tabularnewline
-35.4475857199179 \tabularnewline
-135.648989328892 \tabularnewline
-31.0896738469681 \tabularnewline
786.566228174453 \tabularnewline
-228.926422035591 \tabularnewline
310.731042079950 \tabularnewline
-761.891890818721 \tabularnewline
-181.829684536758 \tabularnewline
-29.6254758807332 \tabularnewline
201.262618678901 \tabularnewline
543.688466533747 \tabularnewline
694.274418155144 \tabularnewline
19.0576392268075 \tabularnewline
672.32310567441 \tabularnewline
329.555869703536 \tabularnewline
-1051.91311433509 \tabularnewline
23.2401709853333 \tabularnewline
984.446158159638 \tabularnewline
-595.480662047692 \tabularnewline
-379.213039348935 \tabularnewline
376.4319649403 \tabularnewline
877.796205928327 \tabularnewline
1183.08868730335 \tabularnewline
-169.168353166969 \tabularnewline
-449.998735569299 \tabularnewline
-291.129498897748 \tabularnewline
790.693677113256 \tabularnewline
0.0324588032688611 \tabularnewline
82.5292710412334 \tabularnewline
-538.595496455739 \tabularnewline
-210.09659489978 \tabularnewline
-97.723468179569 \tabularnewline
432.700099797742 \tabularnewline
180.700023867731 \tabularnewline
-452.313509487957 \tabularnewline
-53.1664298137714 \tabularnewline
570.912325224767 \tabularnewline
-261.74822528617 \tabularnewline
504.743795828869 \tabularnewline
-591.836458545287 \tabularnewline
303.220080155466 \tabularnewline
410.093934282324 \tabularnewline
-220.488053168112 \tabularnewline
-153.028507482072 \tabularnewline
-307.472292280229 \tabularnewline
111.847354608524 \tabularnewline
-53.4770185570314 \tabularnewline
-195.775230969551 \tabularnewline
787.020938587108 \tabularnewline
\hline
\end{tabular}
%Source: https://freestatistics.org/blog/index.php?pk=34647&T=2

[TABLE]
[ROW][C]Estimated ARIMA Residuals[/C][/ROW]
[ROW][C]Value[/C][/ROW]
[ROW][C][/C][/ROW]
[ROW][C]547.995731502885[/C][/ROW]
[ROW][C]1317.93162356686[/C][/ROW]
[ROW][C]-225.796063410288[/C][/ROW]
[ROW][C]-201.439936222822[/C][/ROW]
[ROW][C]95.2531393167182[/C][/ROW]
[ROW][C]237.156438531592[/C][/ROW]
[ROW][C]195.021688881198[/C][/ROW]
[ROW][C]461.112478611811[/C][/ROW]
[ROW][C]-172.489813915744[/C][/ROW]
[ROW][C]-408.350112293751[/C][/ROW]
[ROW][C]-51.5036271703885[/C][/ROW]
[ROW][C]-35.4475857199179[/C][/ROW]
[ROW][C]-135.648989328892[/C][/ROW]
[ROW][C]-31.0896738469681[/C][/ROW]
[ROW][C]786.566228174453[/C][/ROW]
[ROW][C]-228.926422035591[/C][/ROW]
[ROW][C]310.731042079950[/C][/ROW]
[ROW][C]-761.891890818721[/C][/ROW]
[ROW][C]-181.829684536758[/C][/ROW]
[ROW][C]-29.6254758807332[/C][/ROW]
[ROW][C]201.262618678901[/C][/ROW]
[ROW][C]543.688466533747[/C][/ROW]
[ROW][C]694.274418155144[/C][/ROW]
[ROW][C]19.0576392268075[/C][/ROW]
[ROW][C]672.32310567441[/C][/ROW]
[ROW][C]329.555869703536[/C][/ROW]
[ROW][C]-1051.91311433509[/C][/ROW]
[ROW][C]23.2401709853333[/C][/ROW]
[ROW][C]984.446158159638[/C][/ROW]
[ROW][C]-595.480662047692[/C][/ROW]
[ROW][C]-379.213039348935[/C][/ROW]
[ROW][C]376.4319649403[/C][/ROW]
[ROW][C]877.796205928327[/C][/ROW]
[ROW][C]1183.08868730335[/C][/ROW]
[ROW][C]-169.168353166969[/C][/ROW]
[ROW][C]-449.998735569299[/C][/ROW]
[ROW][C]-291.129498897748[/C][/ROW]
[ROW][C]790.693677113256[/C][/ROW]
[ROW][C]0.0324588032688611[/C][/ROW]
[ROW][C]82.5292710412334[/C][/ROW]
[ROW][C]-538.595496455739[/C][/ROW]
[ROW][C]-210.09659489978[/C][/ROW]
[ROW][C]-97.723468179569[/C][/ROW]
[ROW][C]432.700099797742[/C][/ROW]
[ROW][C]180.700023867731[/C][/ROW]
[ROW][C]-452.313509487957[/C][/ROW]
[ROW][C]-53.1664298137714[/C][/ROW]
[ROW][C]570.912325224767[/C][/ROW]
[ROW][C]-261.74822528617[/C][/ROW]
[ROW][C]504.743795828869[/C][/ROW]
[ROW][C]-591.836458545287[/C][/ROW]
[ROW][C]303.220080155466[/C][/ROW]
[ROW][C]410.093934282324[/C][/ROW]
[ROW][C]-220.488053168112[/C][/ROW]
[ROW][C]-153.028507482072[/C][/ROW]
[ROW][C]-307.472292280229[/C][/ROW]
[ROW][C]111.847354608524[/C][/ROW]
[ROW][C]-53.4770185570314[/C][/ROW]
[ROW][C]-195.775230969551[/C][/ROW]
[ROW][C]787.020938587108[/C][/ROW]
[/TABLE]
Source: https://freestatistics.org/blog/index.php?pk=34647&T=2

Globally Unique Identifier (entire table): ba.freestatistics.org/blog/index.php?pk=34647&T=2

As an alternative you can also use a QR Code:  

The GUIDs for individual cells are displayed in the table below:

Estimated ARIMA Residuals
Value
547.995731502885
1317.93162356686
-225.796063410288
-201.439936222822
95.2531393167182
237.156438531592
195.021688881198
461.112478611811
-172.489813915744
-408.350112293751
-51.5036271703885
-35.4475857199179
-135.648989328892
-31.0896738469681
786.566228174453
-228.926422035591
310.731042079950
-761.891890818721
-181.829684536758
-29.6254758807332
201.262618678901
543.688466533747
694.274418155144
19.0576392268075
672.32310567441
329.555869703536
-1051.91311433509
23.2401709853333
984.446158159638
-595.480662047692
-379.213039348935
376.4319649403
877.796205928327
1183.08868730335
-169.168353166969
-449.998735569299
-291.129498897748
790.693677113256
0.0324588032688611
82.5292710412334
-538.595496455739
-210.09659489978
-97.723468179569
432.700099797742
180.700023867731
-452.313509487957
-53.1664298137714
570.912325224767
-261.74822528617
504.743795828869
-591.836458545287
303.220080155466
410.093934282324
-220.488053168112
-153.028507482072
-307.472292280229
111.847354608524
-53.4770185570314
-195.775230969551
787.020938587108


Parameters (Session):
par1 = FALSE ; par2 = 1 ; par3 = 0 ; par4 = 0 ; par5 = 12 ; par6 = 3 ; par7 = 0 ; par8 = 2 ; par9 = 1 ;
Parameters (R input):
par1 = FALSE ; par2 = 1 ; par3 = 0 ; par4 = 0 ; par5 = 12 ; par6 = 3 ; par7 = 0 ; par8 = 2 ; par9 = 1 ;
R code (references can be found in the software module):
library(lattice)
if (par1 == 'TRUE') par1 <- TRUE
if (par1 == 'FALSE') par1 <- FALSE
par2 <- as.numeric(par2) #Box-Cox lambda transformation parameter
par3 <- as.numeric(par3) #degree of non-seasonal differencing
par4 <- as.numeric(par4) #degree of seasonal differencing
par5 <- as.numeric(par5) #seasonal period
par6 <- as.numeric(par6) #degree (p) of the non-seasonal AR(p) polynomial
par7 <- as.numeric(par7) #degree (q) of the non-seasonal MA(q) polynomial
par8 <- as.numeric(par8) #degree (P) of the seasonal AR(P) polynomial
par9 <- as.numeric(par9) #degree (Q) of the seasonal MA(Q) polynomial
armaGR <- function(arima.out, names, n){
try1 <- arima.out$coef
try2 <- sqrt(diag(arima.out$var.coef))
try.data.frame <- data.frame(matrix(NA,ncol=4,nrow=length(names)))
dimnames(try.data.frame) <- list(names,c('coef','std','tstat','pv'))
try.data.frame[,1] <- try1
for(i in 1:length(try2)) try.data.frame[which(rownames(try.data.frame)==names(try2)[i]),2] <- try2[i]
try.data.frame[,3] <- try.data.frame[,1] / try.data.frame[,2]
try.data.frame[,4] <- round((1-pt(abs(try.data.frame[,3]),df=n-(length(try2)+1)))*2,5)
vector <- rep(NA,length(names))
vector[is.na(try.data.frame[,4])] <- 0
maxi <- which.max(try.data.frame[,4])
continue <- max(try.data.frame[,4],na.rm=TRUE) > .05
vector[maxi] <- 0
list(summary=try.data.frame,next.vector=vector,continue=continue)
}
arimaSelect <- function(series, order=c(13,0,0), seasonal=list(order=c(2,0,0),period=12), include.mean=F){
nrc <- order[1]+order[3]+seasonal$order[1]+seasonal$order[3]
coeff <- matrix(NA, nrow=nrc*2, ncol=nrc)
pval <- matrix(NA, nrow=nrc*2, ncol=nrc)
mylist <- rep(list(NULL), nrc)
names <- NULL
if(order[1] > 0) names <- paste('ar',1:order[1],sep='')
if(order[3] > 0) names <- c( names , paste('ma',1:order[3],sep='') )
if(seasonal$order[1] > 0) names <- c(names, paste('sar',1:seasonal$order[1],sep=''))
if(seasonal$order[3] > 0) names <- c(names, paste('sma',1:seasonal$order[3],sep=''))
arima.out <- arima(series, order=order, seasonal=seasonal, include.mean=include.mean, method='ML')
mylist[[1]] <- arima.out
last.arma <- armaGR(arima.out, names, length(series))
mystop <- FALSE
i <- 1
coeff[i,] <- last.arma[[1]][,1]
pval [i,] <- last.arma[[1]][,4]
i <- 2
aic <- arima.out$aic
while(!mystop){
mylist[[i]] <- arima.out
arima.out <- arima(series, order=order, seasonal=seasonal, include.mean=include.mean, method='ML', fixed=last.arma$next.vector)
aic <- c(aic, arima.out$aic)
last.arma <- armaGR(arima.out, names, length(series))
mystop <- !last.arma$continue
coeff[i,] <- last.arma[[1]][,1]
pval [i,] <- last.arma[[1]][,4]
i <- i+1
}
list(coeff, pval, mylist, aic=aic)
}
arimaSelectplot <- function(arimaSelect.out,noms,choix){
noms <- names(arimaSelect.out[[3]][[1]]$coef)
coeff <- arimaSelect.out[[1]]
k <- min(which(is.na(coeff[,1])))-1
coeff <- coeff[1:k,]
pval <- arimaSelect.out[[2]][1:k,]
aic <- arimaSelect.out$aic[1:k]
coeff[coeff==0] <- NA
n <- ncol(coeff)
if(missing(choix)) choix <- k
layout(matrix(c(1,1,1,2,
3,3,3,2,
3,3,3,4,
5,6,7,7),nr=4),
widths=c(10,35,45,15),
heights=c(30,30,15,15))
couleurs <- rainbow(75)[1:50]#(50)
ticks <- pretty(coeff)
par(mar=c(1,1,3,1))
plot(aic,k:1-.5,type='o',pch=21,bg='blue',cex=2,axes=F,lty=2,xpd=NA)
points(aic[choix],k-choix+.5,pch=21,cex=4,bg=2,xpd=NA)
title('aic',line=2)
par(mar=c(3,0,0,0))
plot(0,axes=F,xlab='',ylab='',xlim=range(ticks),ylim=c(.1,1))
rect(xleft = min(ticks) + (0:49)/50*(max(ticks)-min(ticks)),
xright = min(ticks) + (1:50)/50*(max(ticks)-min(ticks)),
ytop = rep(1,50),
ybottom= rep(0,50),col=couleurs,border=NA)
axis(1,ticks)
rect(xleft=min(ticks),xright=max(ticks),ytop=1,ybottom=0)
text(mean(coeff,na.rm=T),.5,'coefficients',cex=2,font=2)
par(mar=c(1,1,3,1))
image(1:n,1:k,t(coeff[k:1,]),axes=F,col=couleurs,zlim=range(ticks))
for(i in 1:n) for(j in 1:k) if(!is.na(coeff[j,i])) {
if(pval[j,i]<.01) symb = 'green'
else if( (pval[j,i]<.05) & (pval[j,i]>=.01)) symb = 'orange'
else if( (pval[j,i]<.1) & (pval[j,i]>=.05)) symb = 'red'
else symb = 'black'
polygon(c(i+.5 ,i+.2 ,i+.5 ,i+.5),
c(k-j+0.5,k-j+0.5,k-j+0.8,k-j+0.5),
col=symb)
if(j==choix) {
rect(xleft=i-.5,
xright=i+.5,
ybottom=k-j+1.5,
ytop=k-j+.5,
lwd=4)
text(i,
k-j+1,
round(coeff[j,i],2),
cex=1.2,
font=2)
}
else{
rect(xleft=i-.5,xright=i+.5,ybottom=k-j+1.5,ytop=k-j+.5)
text(i,k-j+1,round(coeff[j,i],2),cex=1.2,font=1)
}
}
axis(3,1:n,noms)
par(mar=c(0.5,0,0,0.5))
plot(0,axes=F,xlab='',ylab='',type='n',xlim=c(0,8),ylim=c(-.2,.8))
cols <- c('green','orange','red','black')
niv <- c('0','0.01','0.05','0.1')
for(i in 0:3){
polygon(c(1+2*i ,1+2*i ,1+2*i-.5 ,1+2*i),
c(.4 ,.7 , .4 , .4),
col=cols[i+1])
text(2*i,0.5,niv[i+1],cex=1.5)
}
text(8,.5,1,cex=1.5)
text(4,0,'p-value',cex=2)
box()
residus <- arimaSelect.out[[3]][[choix]]$res
par(mar=c(1,2,4,1))
acf(residus,main='')
title('acf',line=.5)
par(mar=c(1,2,4,1))
pacf(residus,main='')
title('pacf',line=.5)
par(mar=c(2,2,4,1))
qqnorm(residus,main='')
title('qq-norm',line=.5)
qqline(residus)
residus
}
if (par2 == 0) x <- log(x)
if (par2 != 0) x <- x^par2
(selection <- arimaSelect(x, order=c(par6,par3,par7), seasonal=list(order=c(par8,par4,par9), period=par5)))
bitmap(file='test1.png')
resid <- arimaSelectplot(selection)
dev.off()
resid
bitmap(file='test2.png')
acf(resid,length(resid)/2, main='Residual Autocorrelation Function')
dev.off()
bitmap(file='test3.png')
pacf(resid,length(resid)/2, main='Residual Partial Autocorrelation Function')
dev.off()
bitmap(file='test4.png')
cpgram(resid, main='Residual Cumulative Periodogram')
dev.off()
bitmap(file='test5.png')
hist(resid, main='Residual Histogram', xlab='values of Residuals')
dev.off()
bitmap(file='test6.png')
densityplot(~resid,col='black',main='Residual Density Plot', xlab='values of Residuals')
dev.off()
bitmap(file='test7.png')
qqnorm(resid, main='Residual Normal Q-Q Plot')
qqline(resid)
dev.off()
ncols <- length(selection[[1]][1,])
nrows <- length(selection[[2]][,1])-1
load(file='createtable')
a<-table.start()
a<-table.row.start(a)
a<-table.element(a,'ARIMA Parameter Estimation and Backward Selection', ncols+1,TRUE)
a<-table.row.end(a)
a<-table.row.start(a)
a<-table.element(a,'Iteration', header=TRUE)
for (i in 1:ncols) {
a<-table.element(a,names(selection[[3]][[1]]$coef)[i],header=TRUE)
}
a<-table.row.end(a)
for (j in 1:nrows) {
a<-table.row.start(a)
mydum <- 'Estimates ('
mydum <- paste(mydum,j)
mydum <- paste(mydum,')')
a<-table.element(a,mydum, header=TRUE)
for (i in 1:ncols) {
a<-table.element(a,round(selection[[1]][j,i],4))
}
a<-table.row.end(a)
a<-table.row.start(a)
a<-table.element(a,'(p-val)', header=TRUE)
for (i in 1:ncols) {
mydum <- '('
mydum <- paste(mydum,round(selection[[2]][j,i],4),sep='')
mydum <- paste(mydum,')')
a<-table.element(a,mydum)
}
a<-table.row.end(a)
}
a<-table.end(a)
table.save(a,file='mytable.tab')
a<-table.start()
a<-table.row.start(a)
a<-table.element(a,'Estimated ARIMA Residuals', 1,TRUE)
a<-table.row.end(a)
a<-table.row.start(a)
a<-table.element(a,'Value', 1,TRUE)
a<-table.row.end(a)
for (i in (par4*par5+par3):length(resid)) {
a<-table.row.start(a)
a<-table.element(a,resid[i])
a<-table.row.end(a)
}
a<-table.end(a)
table.save(a,file='mytable1.tab')