Free Statistics

of Irreproducible Research!

Author's title

Author*The author of this computation has been verified*
R Software Modulerwasp_autocorrelation.wasp
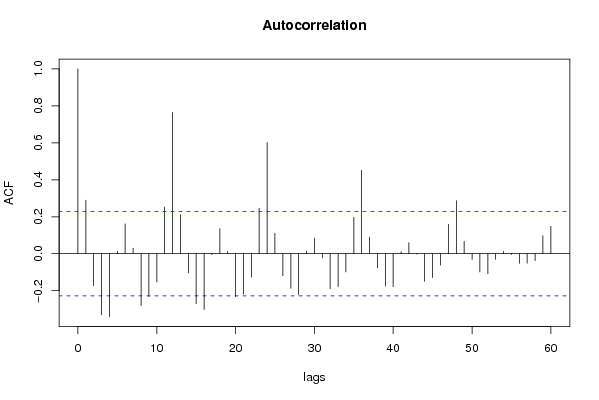
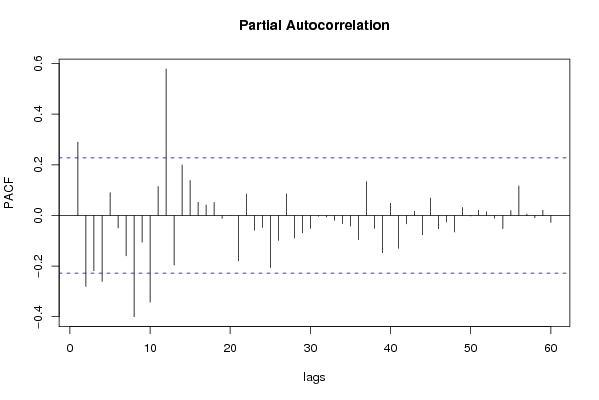
Title produced by software(Partial) Autocorrelation Function
Date of computationThu, 18 Dec 2008 03:45:28 -0700
Cite this page as followsStatistical Computations at FreeStatistics.org, Office for Research Development and Education, URL https://freestatistics.org/blog/index.php?v=date/2008/Dec/18/t1229597185qmusvreh1ggued2.htm/, Retrieved Sat, 11 May 2024 10:28:51 +0000
Statistical Computations at FreeStatistics.org, Office for Research Development and Education, URL https://freestatistics.org/blog/index.php?pk=34639, Retrieved Sat, 11 May 2024 10:28:51 +0000
QR Codes:

Original text written by user:
IsPrivate?No (this computation is public)
User-defined keywords
Estimated Impact214
Family? (F = Feedback message, R = changed R code, M = changed R Module, P = changed Parameters, D = changed Data)
-     [(Partial) Autocorrelation Function] [Autocorrelation F...] [2008-12-12 14:01:57] [1ce0d16c8f4225c977b42c8fa93bc163]
-   P     [(Partial) Autocorrelation Function] [Autocorrelation F...] [2008-12-18 10:45:28] [8758b22b4a10c08c31202f233362e983] [Current]
-           [(Partial) Autocorrelation Function] [2] [2008-12-22 16:28:32] [76963dc1903f0f612b6153510a3818cf]
Feedback Forum

Post a new message
Dataseries X:
492865
480961
461935
456608
441977
439148
488180
520564
501492
485025
464196
460170
467037
460070
447988
442867
436087
431328
484015
509673
512927
502831
470984
471067
476049
474605
470439
461251
454724
455626
516847
525192
522975
518585
509239
512238
519164
517009
509933
509127
500857
506971
569323
579714
577992
565464
547344
554788
562325
560854
555332
543599
536662
542722
593530
610763
612613
611324
594167
595454
590865
589379
584428
573100
567456
569028
620735
628884
628232
612117
595404
597141
593408
590072
579799


Summary of computational transaction
Raw Inputview raw input (R code)
Raw Outputview raw output of R engine
Computing time1 seconds
R Server'Gwilym Jenkins' @ 72.249.127.135

\begin{tabular}{lllllllll}
\hline
Summary of computational transaction \tabularnewline
Raw Input & view raw input (R code)  \tabularnewline
Raw Output & view raw output of R engine  \tabularnewline
Computing time & 1 seconds \tabularnewline
R Server & 'Gwilym Jenkins' @ 72.249.127.135 \tabularnewline
\hline
\end{tabular}
%Source: https://freestatistics.org/blog/index.php?pk=34639&T=0

[TABLE]
[ROW][C]Summary of computational transaction[/C][/ROW]
[ROW][C]Raw Input[/C][C]view raw input (R code) [/C][/ROW]
[ROW][C]Raw Output[/C][C]view raw output of R engine [/C][/ROW]
[ROW][C]Computing time[/C][C]1 seconds[/C][/ROW]
[ROW][C]R Server[/C][C]'Gwilym Jenkins' @ 72.249.127.135[/C][/ROW]
[/TABLE]
Source: https://freestatistics.org/blog/index.php?pk=34639&T=0

Globally Unique Identifier (entire table): ba.freestatistics.org/blog/index.php?pk=34639&T=0

As an alternative you can also use a QR Code:  

The GUIDs for individual cells are displayed in the table below:

Summary of computational transaction
Raw Inputview raw input (R code)
Raw Outputview raw output of R engine
Computing time1 seconds
R Server'Gwilym Jenkins' @ 72.249.127.135


Autocorrelation Function
Time lag kACF(k)T-STATP-value
10.2895512.49080.007494
2-0.173302-1.49080.070132
3-0.330197-2.84050.002907
4-0.340579-2.92980.002254
50.0128190.11030.456245
60.161511.38940.084444
70.0302430.26020.39773
8-0.279876-2.40760.009276
9-0.231013-1.98720.025298
10-0.153312-1.31880.095644
110.2534892.18060.016196
120.7646966.57820
130.2118131.82210.036242
14-0.104058-0.89510.186807
15-0.270176-2.32410.011433
16-0.301303-2.59190.005747
17-0.005085-0.04370.482614
180.1358681.16880.123121
190.0117670.10120.459823
20-0.231565-1.9920.025031
21-0.218448-1.87920.03208
22-0.126596-1.0890.139839
230.2463172.11890.018728
240.6018515.17731e-06
250.1104630.95020.172542
26-0.11856-1.01990.15555
27-0.187115-1.60960.055869
28-0.220584-1.89750.030829
290.0149410.12850.449039
300.0838020.72090.236624
31-0.022338-0.19220.424073
32-0.189978-1.63430.053227
33-0.177364-1.52570.065669
34-0.098842-0.85030.198959
350.1966741.69190.04744
360.4514323.88340.000111
370.0900780.77490.22044
38-0.076654-0.65940.255842
39-0.175271-1.50770.067939
40-0.178685-1.53710.064266
410.0104670.090.464248
420.0595540.51230.304981
43-0.002505-0.02150.491433
44-0.149331-1.28460.101471
45-0.129044-1.11010.13528
46-0.061213-0.52660.300033
470.1591581.36910.08755
480.287072.46950.007919
490.0666010.57290.284217
50-0.03103-0.26690.395133
51-0.098475-0.84710.199832
52-0.107817-0.92750.178348
53-0.030143-0.25930.398061
540.0127080.10930.456623
55-0.004865-0.04190.483365
56-0.052064-0.44790.327777
57-0.051364-0.44190.329942
58-0.037324-0.32110.374532
590.097060.83490.20322
600.1486981.27920.10242

\begin{tabular}{lllllllll}
\hline
Autocorrelation Function \tabularnewline
Time lag k & ACF(k) & T-STAT & P-value \tabularnewline
1 & 0.289551 & 2.4908 & 0.007494 \tabularnewline
2 & -0.173302 & -1.4908 & 0.070132 \tabularnewline
3 & -0.330197 & -2.8405 & 0.002907 \tabularnewline
4 & -0.340579 & -2.9298 & 0.002254 \tabularnewline
5 & 0.012819 & 0.1103 & 0.456245 \tabularnewline
6 & 0.16151 & 1.3894 & 0.084444 \tabularnewline
7 & 0.030243 & 0.2602 & 0.39773 \tabularnewline
8 & -0.279876 & -2.4076 & 0.009276 \tabularnewline
9 & -0.231013 & -1.9872 & 0.025298 \tabularnewline
10 & -0.153312 & -1.3188 & 0.095644 \tabularnewline
11 & 0.253489 & 2.1806 & 0.016196 \tabularnewline
12 & 0.764696 & 6.5782 & 0 \tabularnewline
13 & 0.211813 & 1.8221 & 0.036242 \tabularnewline
14 & -0.104058 & -0.8951 & 0.186807 \tabularnewline
15 & -0.270176 & -2.3241 & 0.011433 \tabularnewline
16 & -0.301303 & -2.5919 & 0.005747 \tabularnewline
17 & -0.005085 & -0.0437 & 0.482614 \tabularnewline
18 & 0.135868 & 1.1688 & 0.123121 \tabularnewline
19 & 0.011767 & 0.1012 & 0.459823 \tabularnewline
20 & -0.231565 & -1.992 & 0.025031 \tabularnewline
21 & -0.218448 & -1.8792 & 0.03208 \tabularnewline
22 & -0.126596 & -1.089 & 0.139839 \tabularnewline
23 & 0.246317 & 2.1189 & 0.018728 \tabularnewline
24 & 0.601851 & 5.1773 & 1e-06 \tabularnewline
25 & 0.110463 & 0.9502 & 0.172542 \tabularnewline
26 & -0.11856 & -1.0199 & 0.15555 \tabularnewline
27 & -0.187115 & -1.6096 & 0.055869 \tabularnewline
28 & -0.220584 & -1.8975 & 0.030829 \tabularnewline
29 & 0.014941 & 0.1285 & 0.449039 \tabularnewline
30 & 0.083802 & 0.7209 & 0.236624 \tabularnewline
31 & -0.022338 & -0.1922 & 0.424073 \tabularnewline
32 & -0.189978 & -1.6343 & 0.053227 \tabularnewline
33 & -0.177364 & -1.5257 & 0.065669 \tabularnewline
34 & -0.098842 & -0.8503 & 0.198959 \tabularnewline
35 & 0.196674 & 1.6919 & 0.04744 \tabularnewline
36 & 0.451432 & 3.8834 & 0.000111 \tabularnewline
37 & 0.090078 & 0.7749 & 0.22044 \tabularnewline
38 & -0.076654 & -0.6594 & 0.255842 \tabularnewline
39 & -0.175271 & -1.5077 & 0.067939 \tabularnewline
40 & -0.178685 & -1.5371 & 0.064266 \tabularnewline
41 & 0.010467 & 0.09 & 0.464248 \tabularnewline
42 & 0.059554 & 0.5123 & 0.304981 \tabularnewline
43 & -0.002505 & -0.0215 & 0.491433 \tabularnewline
44 & -0.149331 & -1.2846 & 0.101471 \tabularnewline
45 & -0.129044 & -1.1101 & 0.13528 \tabularnewline
46 & -0.061213 & -0.5266 & 0.300033 \tabularnewline
47 & 0.159158 & 1.3691 & 0.08755 \tabularnewline
48 & 0.28707 & 2.4695 & 0.007919 \tabularnewline
49 & 0.066601 & 0.5729 & 0.284217 \tabularnewline
50 & -0.03103 & -0.2669 & 0.395133 \tabularnewline
51 & -0.098475 & -0.8471 & 0.199832 \tabularnewline
52 & -0.107817 & -0.9275 & 0.178348 \tabularnewline
53 & -0.030143 & -0.2593 & 0.398061 \tabularnewline
54 & 0.012708 & 0.1093 & 0.456623 \tabularnewline
55 & -0.004865 & -0.0419 & 0.483365 \tabularnewline
56 & -0.052064 & -0.4479 & 0.327777 \tabularnewline
57 & -0.051364 & -0.4419 & 0.329942 \tabularnewline
58 & -0.037324 & -0.3211 & 0.374532 \tabularnewline
59 & 0.09706 & 0.8349 & 0.20322 \tabularnewline
60 & 0.148698 & 1.2792 & 0.10242 \tabularnewline
\hline
\end{tabular}
%Source: https://freestatistics.org/blog/index.php?pk=34639&T=1

[TABLE]
[ROW][C]Autocorrelation Function[/C][/ROW]
[ROW][C]Time lag k[/C][C]ACF(k)[/C][C]T-STAT[/C][C]P-value[/C][/ROW]
[ROW][C]1[/C][C]0.289551[/C][C]2.4908[/C][C]0.007494[/C][/ROW]
[ROW][C]2[/C][C]-0.173302[/C][C]-1.4908[/C][C]0.070132[/C][/ROW]
[ROW][C]3[/C][C]-0.330197[/C][C]-2.8405[/C][C]0.002907[/C][/ROW]
[ROW][C]4[/C][C]-0.340579[/C][C]-2.9298[/C][C]0.002254[/C][/ROW]
[ROW][C]5[/C][C]0.012819[/C][C]0.1103[/C][C]0.456245[/C][/ROW]
[ROW][C]6[/C][C]0.16151[/C][C]1.3894[/C][C]0.084444[/C][/ROW]
[ROW][C]7[/C][C]0.030243[/C][C]0.2602[/C][C]0.39773[/C][/ROW]
[ROW][C]8[/C][C]-0.279876[/C][C]-2.4076[/C][C]0.009276[/C][/ROW]
[ROW][C]9[/C][C]-0.231013[/C][C]-1.9872[/C][C]0.025298[/C][/ROW]
[ROW][C]10[/C][C]-0.153312[/C][C]-1.3188[/C][C]0.095644[/C][/ROW]
[ROW][C]11[/C][C]0.253489[/C][C]2.1806[/C][C]0.016196[/C][/ROW]
[ROW][C]12[/C][C]0.764696[/C][C]6.5782[/C][C]0[/C][/ROW]
[ROW][C]13[/C][C]0.211813[/C][C]1.8221[/C][C]0.036242[/C][/ROW]
[ROW][C]14[/C][C]-0.104058[/C][C]-0.8951[/C][C]0.186807[/C][/ROW]
[ROW][C]15[/C][C]-0.270176[/C][C]-2.3241[/C][C]0.011433[/C][/ROW]
[ROW][C]16[/C][C]-0.301303[/C][C]-2.5919[/C][C]0.005747[/C][/ROW]
[ROW][C]17[/C][C]-0.005085[/C][C]-0.0437[/C][C]0.482614[/C][/ROW]
[ROW][C]18[/C][C]0.135868[/C][C]1.1688[/C][C]0.123121[/C][/ROW]
[ROW][C]19[/C][C]0.011767[/C][C]0.1012[/C][C]0.459823[/C][/ROW]
[ROW][C]20[/C][C]-0.231565[/C][C]-1.992[/C][C]0.025031[/C][/ROW]
[ROW][C]21[/C][C]-0.218448[/C][C]-1.8792[/C][C]0.03208[/C][/ROW]
[ROW][C]22[/C][C]-0.126596[/C][C]-1.089[/C][C]0.139839[/C][/ROW]
[ROW][C]23[/C][C]0.246317[/C][C]2.1189[/C][C]0.018728[/C][/ROW]
[ROW][C]24[/C][C]0.601851[/C][C]5.1773[/C][C]1e-06[/C][/ROW]
[ROW][C]25[/C][C]0.110463[/C][C]0.9502[/C][C]0.172542[/C][/ROW]
[ROW][C]26[/C][C]-0.11856[/C][C]-1.0199[/C][C]0.15555[/C][/ROW]
[ROW][C]27[/C][C]-0.187115[/C][C]-1.6096[/C][C]0.055869[/C][/ROW]
[ROW][C]28[/C][C]-0.220584[/C][C]-1.8975[/C][C]0.030829[/C][/ROW]
[ROW][C]29[/C][C]0.014941[/C][C]0.1285[/C][C]0.449039[/C][/ROW]
[ROW][C]30[/C][C]0.083802[/C][C]0.7209[/C][C]0.236624[/C][/ROW]
[ROW][C]31[/C][C]-0.022338[/C][C]-0.1922[/C][C]0.424073[/C][/ROW]
[ROW][C]32[/C][C]-0.189978[/C][C]-1.6343[/C][C]0.053227[/C][/ROW]
[ROW][C]33[/C][C]-0.177364[/C][C]-1.5257[/C][C]0.065669[/C][/ROW]
[ROW][C]34[/C][C]-0.098842[/C][C]-0.8503[/C][C]0.198959[/C][/ROW]
[ROW][C]35[/C][C]0.196674[/C][C]1.6919[/C][C]0.04744[/C][/ROW]
[ROW][C]36[/C][C]0.451432[/C][C]3.8834[/C][C]0.000111[/C][/ROW]
[ROW][C]37[/C][C]0.090078[/C][C]0.7749[/C][C]0.22044[/C][/ROW]
[ROW][C]38[/C][C]-0.076654[/C][C]-0.6594[/C][C]0.255842[/C][/ROW]
[ROW][C]39[/C][C]-0.175271[/C][C]-1.5077[/C][C]0.067939[/C][/ROW]
[ROW][C]40[/C][C]-0.178685[/C][C]-1.5371[/C][C]0.064266[/C][/ROW]
[ROW][C]41[/C][C]0.010467[/C][C]0.09[/C][C]0.464248[/C][/ROW]
[ROW][C]42[/C][C]0.059554[/C][C]0.5123[/C][C]0.304981[/C][/ROW]
[ROW][C]43[/C][C]-0.002505[/C][C]-0.0215[/C][C]0.491433[/C][/ROW]
[ROW][C]44[/C][C]-0.149331[/C][C]-1.2846[/C][C]0.101471[/C][/ROW]
[ROW][C]45[/C][C]-0.129044[/C][C]-1.1101[/C][C]0.13528[/C][/ROW]
[ROW][C]46[/C][C]-0.061213[/C][C]-0.5266[/C][C]0.300033[/C][/ROW]
[ROW][C]47[/C][C]0.159158[/C][C]1.3691[/C][C]0.08755[/C][/ROW]
[ROW][C]48[/C][C]0.28707[/C][C]2.4695[/C][C]0.007919[/C][/ROW]
[ROW][C]49[/C][C]0.066601[/C][C]0.5729[/C][C]0.284217[/C][/ROW]
[ROW][C]50[/C][C]-0.03103[/C][C]-0.2669[/C][C]0.395133[/C][/ROW]
[ROW][C]51[/C][C]-0.098475[/C][C]-0.8471[/C][C]0.199832[/C][/ROW]
[ROW][C]52[/C][C]-0.107817[/C][C]-0.9275[/C][C]0.178348[/C][/ROW]
[ROW][C]53[/C][C]-0.030143[/C][C]-0.2593[/C][C]0.398061[/C][/ROW]
[ROW][C]54[/C][C]0.012708[/C][C]0.1093[/C][C]0.456623[/C][/ROW]
[ROW][C]55[/C][C]-0.004865[/C][C]-0.0419[/C][C]0.483365[/C][/ROW]
[ROW][C]56[/C][C]-0.052064[/C][C]-0.4479[/C][C]0.327777[/C][/ROW]
[ROW][C]57[/C][C]-0.051364[/C][C]-0.4419[/C][C]0.329942[/C][/ROW]
[ROW][C]58[/C][C]-0.037324[/C][C]-0.3211[/C][C]0.374532[/C][/ROW]
[ROW][C]59[/C][C]0.09706[/C][C]0.8349[/C][C]0.20322[/C][/ROW]
[ROW][C]60[/C][C]0.148698[/C][C]1.2792[/C][C]0.10242[/C][/ROW]
[/TABLE]
Source: https://freestatistics.org/blog/index.php?pk=34639&T=1

Globally Unique Identifier (entire table): ba.freestatistics.org/blog/index.php?pk=34639&T=1

As an alternative you can also use a QR Code:  

The GUIDs for individual cells are displayed in the table below:

Autocorrelation Function
Time lag kACF(k)T-STATP-value
10.2895512.49080.007494
2-0.173302-1.49080.070132
3-0.330197-2.84050.002907
4-0.340579-2.92980.002254
50.0128190.11030.456245
60.161511.38940.084444
70.0302430.26020.39773
8-0.279876-2.40760.009276
9-0.231013-1.98720.025298
10-0.153312-1.31880.095644
110.2534892.18060.016196
120.7646966.57820
130.2118131.82210.036242
14-0.104058-0.89510.186807
15-0.270176-2.32410.011433
16-0.301303-2.59190.005747
17-0.005085-0.04370.482614
180.1358681.16880.123121
190.0117670.10120.459823
20-0.231565-1.9920.025031
21-0.218448-1.87920.03208
22-0.126596-1.0890.139839
230.2463172.11890.018728
240.6018515.17731e-06
250.1104630.95020.172542
26-0.11856-1.01990.15555
27-0.187115-1.60960.055869
28-0.220584-1.89750.030829
290.0149410.12850.449039
300.0838020.72090.236624
31-0.022338-0.19220.424073
32-0.189978-1.63430.053227
33-0.177364-1.52570.065669
34-0.098842-0.85030.198959
350.1966741.69190.04744
360.4514323.88340.000111
370.0900780.77490.22044
38-0.076654-0.65940.255842
39-0.175271-1.50770.067939
40-0.178685-1.53710.064266
410.0104670.090.464248
420.0595540.51230.304981
43-0.002505-0.02150.491433
44-0.149331-1.28460.101471
45-0.129044-1.11010.13528
46-0.061213-0.52660.300033
470.1591581.36910.08755
480.287072.46950.007919
490.0666010.57290.284217
50-0.03103-0.26690.395133
51-0.098475-0.84710.199832
52-0.107817-0.92750.178348
53-0.030143-0.25930.398061
540.0127080.10930.456623
55-0.004865-0.04190.483365
56-0.052064-0.44790.327777
57-0.051364-0.44190.329942
58-0.037324-0.32110.374532
590.097060.83490.20322
600.1486981.27920.10242


Partial Autocorrelation Function
Time lag kPACF(k)T-STATP-value
10.2895512.49080.007494
2-0.280674-2.41440.009116
3-0.218799-1.88220.031872
4-0.260881-2.24420.013905
50.0898530.77290.221007
6-0.049503-0.42580.335729
7-0.159657-1.37340.086884
8-0.39977-3.43890.000481
9-0.105461-0.90720.18362
10-0.34276-2.94850.002135
110.1142830.98310.16438
120.5785754.97712e-06
13-0.195872-1.6850.048105
140.1988211.71030.045698
150.1379421.18660.119587
160.0519730.44710.328058
170.0407830.35080.363355
180.0513180.44150.330085
19-0.011797-0.10150.459721
20-0.000409-0.00350.498602
21-0.179361-1.54290.063558
220.0844660.72660.234881
23-0.058127-0.50.309269
24-0.047354-0.40740.342463
25-0.205841-1.77070.040364
26-0.098635-0.84850.199452
270.0851880.73280.232992
28-0.089346-0.76860.222294
29-0.068842-0.59220.277759
30-0.051252-0.44090.330291
31-0.003093-0.02660.489422
32-0.005888-0.05070.47987
33-0.01943-0.16710.433858
34-0.032258-0.27750.391089
35-0.041843-0.35990.359957
36-0.095252-0.81940.207597
370.1333891.14750.127444
38-0.051541-0.44340.329395
39-0.147301-1.26710.104541
400.047770.41090.341154
41-0.129736-1.1160.13401
42-0.033143-0.28510.38818
430.0165220.14210.443683
44-0.076559-0.65860.256103
450.0686990.5910.278171
46-0.052604-0.45250.32611
47-0.025673-0.22080.412911
48-0.065159-0.56050.288409
490.0318080.27360.39257
50-0.002208-0.0190.492447
510.0206360.17750.429793
520.0142720.12280.451309
53-0.01091-0.09390.46274
54-0.051746-0.44510.328761
550.0192680.16580.434402
560.1166421.00340.15947
570.005260.04530.482014
58-0.008703-0.07490.470261
590.0209360.18010.428782
60-0.027761-0.23880.405957

\begin{tabular}{lllllllll}
\hline
Partial Autocorrelation Function \tabularnewline
Time lag k & PACF(k) & T-STAT & P-value \tabularnewline
1 & 0.289551 & 2.4908 & 0.007494 \tabularnewline
2 & -0.280674 & -2.4144 & 0.009116 \tabularnewline
3 & -0.218799 & -1.8822 & 0.031872 \tabularnewline
4 & -0.260881 & -2.2442 & 0.013905 \tabularnewline
5 & 0.089853 & 0.7729 & 0.221007 \tabularnewline
6 & -0.049503 & -0.4258 & 0.335729 \tabularnewline
7 & -0.159657 & -1.3734 & 0.086884 \tabularnewline
8 & -0.39977 & -3.4389 & 0.000481 \tabularnewline
9 & -0.105461 & -0.9072 & 0.18362 \tabularnewline
10 & -0.34276 & -2.9485 & 0.002135 \tabularnewline
11 & 0.114283 & 0.9831 & 0.16438 \tabularnewline
12 & 0.578575 & 4.9771 & 2e-06 \tabularnewline
13 & -0.195872 & -1.685 & 0.048105 \tabularnewline
14 & 0.198821 & 1.7103 & 0.045698 \tabularnewline
15 & 0.137942 & 1.1866 & 0.119587 \tabularnewline
16 & 0.051973 & 0.4471 & 0.328058 \tabularnewline
17 & 0.040783 & 0.3508 & 0.363355 \tabularnewline
18 & 0.051318 & 0.4415 & 0.330085 \tabularnewline
19 & -0.011797 & -0.1015 & 0.459721 \tabularnewline
20 & -0.000409 & -0.0035 & 0.498602 \tabularnewline
21 & -0.179361 & -1.5429 & 0.063558 \tabularnewline
22 & 0.084466 & 0.7266 & 0.234881 \tabularnewline
23 & -0.058127 & -0.5 & 0.309269 \tabularnewline
24 & -0.047354 & -0.4074 & 0.342463 \tabularnewline
25 & -0.205841 & -1.7707 & 0.040364 \tabularnewline
26 & -0.098635 & -0.8485 & 0.199452 \tabularnewline
27 & 0.085188 & 0.7328 & 0.232992 \tabularnewline
28 & -0.089346 & -0.7686 & 0.222294 \tabularnewline
29 & -0.068842 & -0.5922 & 0.277759 \tabularnewline
30 & -0.051252 & -0.4409 & 0.330291 \tabularnewline
31 & -0.003093 & -0.0266 & 0.489422 \tabularnewline
32 & -0.005888 & -0.0507 & 0.47987 \tabularnewline
33 & -0.01943 & -0.1671 & 0.433858 \tabularnewline
34 & -0.032258 & -0.2775 & 0.391089 \tabularnewline
35 & -0.041843 & -0.3599 & 0.359957 \tabularnewline
36 & -0.095252 & -0.8194 & 0.207597 \tabularnewline
37 & 0.133389 & 1.1475 & 0.127444 \tabularnewline
38 & -0.051541 & -0.4434 & 0.329395 \tabularnewline
39 & -0.147301 & -1.2671 & 0.104541 \tabularnewline
40 & 0.04777 & 0.4109 & 0.341154 \tabularnewline
41 & -0.129736 & -1.116 & 0.13401 \tabularnewline
42 & -0.033143 & -0.2851 & 0.38818 \tabularnewline
43 & 0.016522 & 0.1421 & 0.443683 \tabularnewline
44 & -0.076559 & -0.6586 & 0.256103 \tabularnewline
45 & 0.068699 & 0.591 & 0.278171 \tabularnewline
46 & -0.052604 & -0.4525 & 0.32611 \tabularnewline
47 & -0.025673 & -0.2208 & 0.412911 \tabularnewline
48 & -0.065159 & -0.5605 & 0.288409 \tabularnewline
49 & 0.031808 & 0.2736 & 0.39257 \tabularnewline
50 & -0.002208 & -0.019 & 0.492447 \tabularnewline
51 & 0.020636 & 0.1775 & 0.429793 \tabularnewline
52 & 0.014272 & 0.1228 & 0.451309 \tabularnewline
53 & -0.01091 & -0.0939 & 0.46274 \tabularnewline
54 & -0.051746 & -0.4451 & 0.328761 \tabularnewline
55 & 0.019268 & 0.1658 & 0.434402 \tabularnewline
56 & 0.116642 & 1.0034 & 0.15947 \tabularnewline
57 & 0.00526 & 0.0453 & 0.482014 \tabularnewline
58 & -0.008703 & -0.0749 & 0.470261 \tabularnewline
59 & 0.020936 & 0.1801 & 0.428782 \tabularnewline
60 & -0.027761 & -0.2388 & 0.405957 \tabularnewline
\hline
\end{tabular}
%Source: https://freestatistics.org/blog/index.php?pk=34639&T=2

[TABLE]
[ROW][C]Partial Autocorrelation Function[/C][/ROW]
[ROW][C]Time lag k[/C][C]PACF(k)[/C][C]T-STAT[/C][C]P-value[/C][/ROW]
[ROW][C]1[/C][C]0.289551[/C][C]2.4908[/C][C]0.007494[/C][/ROW]
[ROW][C]2[/C][C]-0.280674[/C][C]-2.4144[/C][C]0.009116[/C][/ROW]
[ROW][C]3[/C][C]-0.218799[/C][C]-1.8822[/C][C]0.031872[/C][/ROW]
[ROW][C]4[/C][C]-0.260881[/C][C]-2.2442[/C][C]0.013905[/C][/ROW]
[ROW][C]5[/C][C]0.089853[/C][C]0.7729[/C][C]0.221007[/C][/ROW]
[ROW][C]6[/C][C]-0.049503[/C][C]-0.4258[/C][C]0.335729[/C][/ROW]
[ROW][C]7[/C][C]-0.159657[/C][C]-1.3734[/C][C]0.086884[/C][/ROW]
[ROW][C]8[/C][C]-0.39977[/C][C]-3.4389[/C][C]0.000481[/C][/ROW]
[ROW][C]9[/C][C]-0.105461[/C][C]-0.9072[/C][C]0.18362[/C][/ROW]
[ROW][C]10[/C][C]-0.34276[/C][C]-2.9485[/C][C]0.002135[/C][/ROW]
[ROW][C]11[/C][C]0.114283[/C][C]0.9831[/C][C]0.16438[/C][/ROW]
[ROW][C]12[/C][C]0.578575[/C][C]4.9771[/C][C]2e-06[/C][/ROW]
[ROW][C]13[/C][C]-0.195872[/C][C]-1.685[/C][C]0.048105[/C][/ROW]
[ROW][C]14[/C][C]0.198821[/C][C]1.7103[/C][C]0.045698[/C][/ROW]
[ROW][C]15[/C][C]0.137942[/C][C]1.1866[/C][C]0.119587[/C][/ROW]
[ROW][C]16[/C][C]0.051973[/C][C]0.4471[/C][C]0.328058[/C][/ROW]
[ROW][C]17[/C][C]0.040783[/C][C]0.3508[/C][C]0.363355[/C][/ROW]
[ROW][C]18[/C][C]0.051318[/C][C]0.4415[/C][C]0.330085[/C][/ROW]
[ROW][C]19[/C][C]-0.011797[/C][C]-0.1015[/C][C]0.459721[/C][/ROW]
[ROW][C]20[/C][C]-0.000409[/C][C]-0.0035[/C][C]0.498602[/C][/ROW]
[ROW][C]21[/C][C]-0.179361[/C][C]-1.5429[/C][C]0.063558[/C][/ROW]
[ROW][C]22[/C][C]0.084466[/C][C]0.7266[/C][C]0.234881[/C][/ROW]
[ROW][C]23[/C][C]-0.058127[/C][C]-0.5[/C][C]0.309269[/C][/ROW]
[ROW][C]24[/C][C]-0.047354[/C][C]-0.4074[/C][C]0.342463[/C][/ROW]
[ROW][C]25[/C][C]-0.205841[/C][C]-1.7707[/C][C]0.040364[/C][/ROW]
[ROW][C]26[/C][C]-0.098635[/C][C]-0.8485[/C][C]0.199452[/C][/ROW]
[ROW][C]27[/C][C]0.085188[/C][C]0.7328[/C][C]0.232992[/C][/ROW]
[ROW][C]28[/C][C]-0.089346[/C][C]-0.7686[/C][C]0.222294[/C][/ROW]
[ROW][C]29[/C][C]-0.068842[/C][C]-0.5922[/C][C]0.277759[/C][/ROW]
[ROW][C]30[/C][C]-0.051252[/C][C]-0.4409[/C][C]0.330291[/C][/ROW]
[ROW][C]31[/C][C]-0.003093[/C][C]-0.0266[/C][C]0.489422[/C][/ROW]
[ROW][C]32[/C][C]-0.005888[/C][C]-0.0507[/C][C]0.47987[/C][/ROW]
[ROW][C]33[/C][C]-0.01943[/C][C]-0.1671[/C][C]0.433858[/C][/ROW]
[ROW][C]34[/C][C]-0.032258[/C][C]-0.2775[/C][C]0.391089[/C][/ROW]
[ROW][C]35[/C][C]-0.041843[/C][C]-0.3599[/C][C]0.359957[/C][/ROW]
[ROW][C]36[/C][C]-0.095252[/C][C]-0.8194[/C][C]0.207597[/C][/ROW]
[ROW][C]37[/C][C]0.133389[/C][C]1.1475[/C][C]0.127444[/C][/ROW]
[ROW][C]38[/C][C]-0.051541[/C][C]-0.4434[/C][C]0.329395[/C][/ROW]
[ROW][C]39[/C][C]-0.147301[/C][C]-1.2671[/C][C]0.104541[/C][/ROW]
[ROW][C]40[/C][C]0.04777[/C][C]0.4109[/C][C]0.341154[/C][/ROW]
[ROW][C]41[/C][C]-0.129736[/C][C]-1.116[/C][C]0.13401[/C][/ROW]
[ROW][C]42[/C][C]-0.033143[/C][C]-0.2851[/C][C]0.38818[/C][/ROW]
[ROW][C]43[/C][C]0.016522[/C][C]0.1421[/C][C]0.443683[/C][/ROW]
[ROW][C]44[/C][C]-0.076559[/C][C]-0.6586[/C][C]0.256103[/C][/ROW]
[ROW][C]45[/C][C]0.068699[/C][C]0.591[/C][C]0.278171[/C][/ROW]
[ROW][C]46[/C][C]-0.052604[/C][C]-0.4525[/C][C]0.32611[/C][/ROW]
[ROW][C]47[/C][C]-0.025673[/C][C]-0.2208[/C][C]0.412911[/C][/ROW]
[ROW][C]48[/C][C]-0.065159[/C][C]-0.5605[/C][C]0.288409[/C][/ROW]
[ROW][C]49[/C][C]0.031808[/C][C]0.2736[/C][C]0.39257[/C][/ROW]
[ROW][C]50[/C][C]-0.002208[/C][C]-0.019[/C][C]0.492447[/C][/ROW]
[ROW][C]51[/C][C]0.020636[/C][C]0.1775[/C][C]0.429793[/C][/ROW]
[ROW][C]52[/C][C]0.014272[/C][C]0.1228[/C][C]0.451309[/C][/ROW]
[ROW][C]53[/C][C]-0.01091[/C][C]-0.0939[/C][C]0.46274[/C][/ROW]
[ROW][C]54[/C][C]-0.051746[/C][C]-0.4451[/C][C]0.328761[/C][/ROW]
[ROW][C]55[/C][C]0.019268[/C][C]0.1658[/C][C]0.434402[/C][/ROW]
[ROW][C]56[/C][C]0.116642[/C][C]1.0034[/C][C]0.15947[/C][/ROW]
[ROW][C]57[/C][C]0.00526[/C][C]0.0453[/C][C]0.482014[/C][/ROW]
[ROW][C]58[/C][C]-0.008703[/C][C]-0.0749[/C][C]0.470261[/C][/ROW]
[ROW][C]59[/C][C]0.020936[/C][C]0.1801[/C][C]0.428782[/C][/ROW]
[ROW][C]60[/C][C]-0.027761[/C][C]-0.2388[/C][C]0.405957[/C][/ROW]
[/TABLE]
Source: https://freestatistics.org/blog/index.php?pk=34639&T=2

Globally Unique Identifier (entire table): ba.freestatistics.org/blog/index.php?pk=34639&T=2

As an alternative you can also use a QR Code:  

The GUIDs for individual cells are displayed in the table below:

Partial Autocorrelation Function
Time lag kPACF(k)T-STATP-value
10.2895512.49080.007494
2-0.280674-2.41440.009116
3-0.218799-1.88220.031872
4-0.260881-2.24420.013905
50.0898530.77290.221007
6-0.049503-0.42580.335729
7-0.159657-1.37340.086884
8-0.39977-3.43890.000481
9-0.105461-0.90720.18362
10-0.34276-2.94850.002135
110.1142830.98310.16438
120.5785754.97712e-06
13-0.195872-1.6850.048105
140.1988211.71030.045698
150.1379421.18660.119587
160.0519730.44710.328058
170.0407830.35080.363355
180.0513180.44150.330085
19-0.011797-0.10150.459721
20-0.000409-0.00350.498602
21-0.179361-1.54290.063558
220.0844660.72660.234881
23-0.058127-0.50.309269
24-0.047354-0.40740.342463
25-0.205841-1.77070.040364
26-0.098635-0.84850.199452
270.0851880.73280.232992
28-0.089346-0.76860.222294
29-0.068842-0.59220.277759
30-0.051252-0.44090.330291
31-0.003093-0.02660.489422
32-0.005888-0.05070.47987
33-0.01943-0.16710.433858
34-0.032258-0.27750.391089
35-0.041843-0.35990.359957
36-0.095252-0.81940.207597
370.1333891.14750.127444
38-0.051541-0.44340.329395
39-0.147301-1.26710.104541
400.047770.41090.341154
41-0.129736-1.1160.13401
42-0.033143-0.28510.38818
430.0165220.14210.443683
44-0.076559-0.65860.256103
450.0686990.5910.278171
46-0.052604-0.45250.32611
47-0.025673-0.22080.412911
48-0.065159-0.56050.288409
490.0318080.27360.39257
50-0.002208-0.0190.492447
510.0206360.17750.429793
520.0142720.12280.451309
53-0.01091-0.09390.46274
54-0.051746-0.44510.328761
550.0192680.16580.434402
560.1166421.00340.15947
570.005260.04530.482014
58-0.008703-0.07490.470261
590.0209360.18010.428782
60-0.027761-0.23880.405957


Parameters (Session):
par1 = 60 ; par2 = 1 ; par3 = 1 ; par4 = 0 ; par5 = 12 ;
Parameters (R input):
par1 = 60 ; par2 = 1 ; par3 = 1 ; par4 = 0 ; par5 = 12 ;
R code (references can be found in the software module):
if (par1 == 'Default') {
par1 = 10*log10(length(x))
} else {
par1 <- as.numeric(par1)
}
par2 <- as.numeric(par2)
par3 <- as.numeric(par3)
par4 <- as.numeric(par4)
par5 <- as.numeric(par5)
if (par2 == 0) {
x <- log(x)
} else {
x <- (x ^ par2 - 1) / par2
}
if (par3 > 0) x <- diff(x,lag=1,difference=par3)
if (par4 > 0) x <- diff(x,lag=par5,difference=par4)
bitmap(file='pic1.png')
racf <- acf(x,par1,main='Autocorrelation',xlab='lags',ylab='ACF')
dev.off()
bitmap(file='pic2.png')
rpacf <- pacf(x,par1,main='Partial Autocorrelation',xlab='lags',ylab='PACF')
dev.off()
(myacf <- c(racf$acf))
(mypacf <- c(rpacf$acf))
lengthx <- length(x)
sqrtn <- sqrt(lengthx)
load(file='createtable')
a<-table.start()
a<-table.row.start(a)
a<-table.element(a,'Autocorrelation Function',4,TRUE)
a<-table.row.end(a)
a<-table.row.start(a)
a<-table.element(a,'Time lag k',header=TRUE)
a<-table.element(a,hyperlink('basics.htm','ACF(k)','click here for more information about the Autocorrelation Function'),header=TRUE)
a<-table.element(a,'T-STAT',header=TRUE)
a<-table.element(a,'P-value',header=TRUE)
a<-table.row.end(a)
for (i in 2:(par1+1)) {
a<-table.row.start(a)
a<-table.element(a,i-1,header=TRUE)
a<-table.element(a,round(myacf[i],6))
mytstat <- myacf[i]*sqrtn
a<-table.element(a,round(mytstat,4))
a<-table.element(a,round(1-pt(abs(mytstat),lengthx),6))
a<-table.row.end(a)
}
a<-table.end(a)
table.save(a,file='mytable.tab')
a<-table.start()
a<-table.row.start(a)
a<-table.element(a,'Partial Autocorrelation Function',4,TRUE)
a<-table.row.end(a)
a<-table.row.start(a)
a<-table.element(a,'Time lag k',header=TRUE)
a<-table.element(a,hyperlink('basics.htm','PACF(k)','click here for more information about the Partial Autocorrelation Function'),header=TRUE)
a<-table.element(a,'T-STAT',header=TRUE)
a<-table.element(a,'P-value',header=TRUE)
a<-table.row.end(a)
for (i in 1:par1) {
a<-table.row.start(a)
a<-table.element(a,i,header=TRUE)
a<-table.element(a,round(mypacf[i],6))
mytstat <- mypacf[i]*sqrtn
a<-table.element(a,round(mytstat,4))
a<-table.element(a,round(1-pt(abs(mytstat),lengthx),6))
a<-table.row.end(a)
}
a<-table.end(a)
table.save(a,file='mytable1.tab')