Free Statistics
of Irreproducible Research!
Description of Statistical Computation | |||||||||||||||||||||||||||||||||||||||||
|---|---|---|---|---|---|---|---|---|---|---|---|---|---|---|---|---|---|---|---|---|---|---|---|---|---|---|---|---|---|---|---|---|---|---|---|---|---|---|---|---|---|
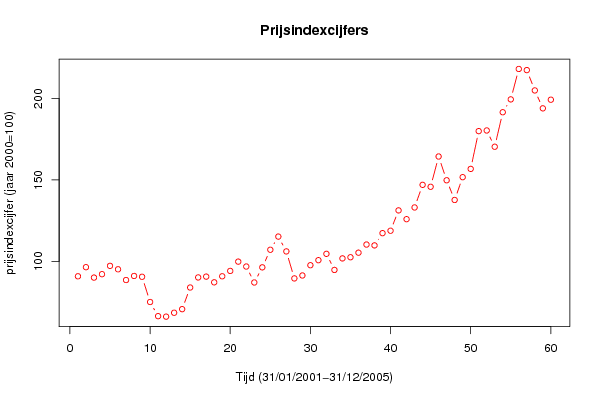
| Author's title | Tijdreeks 2: Prijsindexcijfers van de grondstoffen , energiegrondstoffen, r... | ||||||||||||||||||||||||||||||||||||||||
| Author | *The author of this computation has been verified* | ||||||||||||||||||||||||||||||||||||||||
| R Software Module | rwasp_univariatedataseries.wasp | ||||||||||||||||||||||||||||||||||||||||
| Title produced by software | Univariate Data Series | ||||||||||||||||||||||||||||||||||||||||
| Date of computation | Thu, 18 Dec 2008 02:53:38 -0700 | ||||||||||||||||||||||||||||||||||||||||
| Cite this page as follows | Statistical Computations at FreeStatistics.org, Office for Research Development and Education, URL https://freestatistics.org/blog/index.php?v=date/2008/Dec/18/t1229594149w62v2mrr2e6ki27.htm/, Retrieved Sat, 11 May 2024 15:00:35 +0000 | ||||||||||||||||||||||||||||||||||||||||
| Statistical Computations at FreeStatistics.org, Office for Research Development and Education, URL https://freestatistics.org/blog/index.php?pk=34616, Retrieved Sat, 11 May 2024 15:00:35 +0000 | |||||||||||||||||||||||||||||||||||||||||
| QR Codes: | |||||||||||||||||||||||||||||||||||||||||
|
| |||||||||||||||||||||||||||||||||||||||||
| Original text written by user: | |||||||||||||||||||||||||||||||||||||||||
| IsPrivate? | No (this computation is public) | ||||||||||||||||||||||||||||||||||||||||
| User-defined keywords | |||||||||||||||||||||||||||||||||||||||||
| Estimated Impact | 199 | ||||||||||||||||||||||||||||||||||||||||
Tree of Dependent Computations | |||||||||||||||||||||||||||||||||||||||||
| Family? (F = Feedback message, R = changed R code, M = changed R Module, P = changed Parameters, D = changed Data) | |||||||||||||||||||||||||||||||||||||||||
| F [Univariate Data Series] [Tijdreeks 1:Prijs...] [2008-10-13 18:16:31] [e562c84ebfc887cc5a7a99782625ca3b] - PD [Univariate Data Series] [Prijsindexcijfers...] [2008-10-20 17:08:40] [e562c84ebfc887cc5a7a99782625ca3b] - P [Univariate Data Series] [Tijdreeks 2: Prij...] [2008-12-18 09:53:38] [2fdb1a8e4a6fa49ce74bdce2c154874d] [Current] | |||||||||||||||||||||||||||||||||||||||||
| Feedback Forum | |||||||||||||||||||||||||||||||||||||||||
Post a new message | |||||||||||||||||||||||||||||||||||||||||
Dataset | |||||||||||||||||||||||||||||||||||||||||
| Dataseries X: | |||||||||||||||||||||||||||||||||||||||||
90.8 96.4 90 92.1 97.2 95.1 88.5 91 90.5 75 66.3 66 68.4 70.6 83.9 90.1 90.6 87.1 90.8 94.1 99.8 96.8 87 96.3 107.1 115.2 106.1 89.5 91.3 97.6 100.7 104.6 94.7 101.8 102.5 105.3 110.3 109.8 117.3 118.8 131.3 125.9 133.1 147 145.8 164.4 149.8 137.7 151.7 156.8 180 180.4 170.4 191.6 199.5 218.2 217.5 205 194 199.3 | |||||||||||||||||||||||||||||||||||||||||
Tables (Output of Computation) | |||||||||||||||||||||||||||||||||||||||||
| |||||||||||||||||||||||||||||||||||||||||
Figures (Output of Computation) | |||||||||||||||||||||||||||||||||||||||||
Input Parameters & R Code | |||||||||||||||||||||||||||||||||||||||||
| Parameters (Session): | |||||||||||||||||||||||||||||||||||||||||
| par1 = Prijsindexcijfers van de grondstoffen, Energiegrondstoffen, Ruwe aardolie ; par2 = www.belgostat.be ; | |||||||||||||||||||||||||||||||||||||||||
| Parameters (R input): | |||||||||||||||||||||||||||||||||||||||||
| par1 = Prijsindexcijfers van de grondstoffen, Energiegrondstoffen, Ruwe aardolie ; par2 = www.belgostat.be ; par3 = ; | |||||||||||||||||||||||||||||||||||||||||
| R code (references can be found in the software module): | |||||||||||||||||||||||||||||||||||||||||
bitmap(file='test1.png') | |||||||||||||||||||||||||||||||||||||||||