Free Statistics

of Irreproducible Research!

Author's title

paper: autocorrelation Investeringen seizoenaal gedifferentieerd (met seizo...

Author*The author of this computation has been verified*
R Software Modulerwasp_autocorrelation.wasp
Title produced by software(Partial) Autocorrelation Function
Date of computationWed, 17 Dec 2008 22:47:30 -0700
Cite this page as followsStatistical Computations at FreeStatistics.org, Office for Research Development and Education, URL https://freestatistics.org/blog/index.php?v=date/2008/Dec/18/t1229579307h99aews567tbe55.htm/, Retrieved Sat, 11 May 2024 10:36:52 +0000
Statistical Computations at FreeStatistics.org, Office for Research Development and Education, URL https://freestatistics.org/blog/index.php?pk=34609, Retrieved Sat, 11 May 2024 10:36:52 +0000
QR Codes:

Original text written by user:
IsPrivate?No (this computation is public)
User-defined keywords
Estimated Impact174
Family? (F = Feedback message, R = changed R code, M = changed R Module, P = changed Parameters, D = changed Data)
-       [(Partial) Autocorrelation Function] [paper: autocorrel...] [2008-12-18 05:47:30] [366411ff82333cf2a466cacd3525c11d] [Current]
Feedback Forum

Post a new message
Dataseries X:
101,3
91,5
152,6
86,6
86,6
98,5
86,7
89,1
111
92,6
85,1
116,1
98,3
97,7
177,9
94,2
83,8
109,5
102,3
102,5
162,7
85,3
88,2
104,7
99,4
113,8
166,6
89,2
93,2
115
97,2
112,5
121,8
100,2
93,8
113,6
110,7
127,6
185,9
105,9
108
125,2
106,2
123,3
145,2
114,3
108,4
120,9
126,3
141,3
208,2
131,6
119,8
122,5
137,6
141
154,1
127
106,1
129,9


Summary of computational transaction
Raw Inputview raw input (R code)
Raw Outputview raw output of R engine
Computing time1 seconds
R Server'Gwilym Jenkins' @ 72.249.127.135

\begin{tabular}{lllllllll}
\hline
Summary of computational transaction \tabularnewline
Raw Input & view raw input (R code)  \tabularnewline
Raw Output & view raw output of R engine  \tabularnewline
Computing time & 1 seconds \tabularnewline
R Server & 'Gwilym Jenkins' @ 72.249.127.135 \tabularnewline
\hline
\end{tabular}
%Source: https://freestatistics.org/blog/index.php?pk=34609&T=0

[TABLE]
[ROW][C]Summary of computational transaction[/C][/ROW]
[ROW][C]Raw Input[/C][C]view raw input (R code) [/C][/ROW]
[ROW][C]Raw Output[/C][C]view raw output of R engine [/C][/ROW]
[ROW][C]Computing time[/C][C]1 seconds[/C][/ROW]
[ROW][C]R Server[/C][C]'Gwilym Jenkins' @ 72.249.127.135[/C][/ROW]
[/TABLE]
Source: https://freestatistics.org/blog/index.php?pk=34609&T=0

Globally Unique Identifier (entire table): ba.freestatistics.org/blog/index.php?pk=34609&T=0

As an alternative you can also use a QR Code:  

The GUIDs for individual cells are displayed in the table below:

Summary of computational transaction
Raw Inputview raw input (R code)
Raw Outputview raw output of R engine
Computing time1 seconds
R Server'Gwilym Jenkins' @ 72.249.127.135


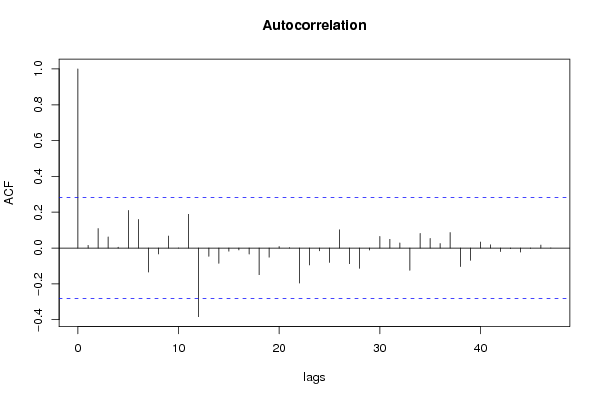
Autocorrelation Function
Time lag kACF(k)T-STATP-value
10.0148740.1030.459178
20.1089520.75480.227017
30.0619780.42940.334779
40.0047430.03290.486962
50.2099361.45450.076161
60.1598591.10750.13679
7-0.133985-0.92830.178955
8-0.033112-0.22940.409765
90.0666450.46170.32318
100.0001870.00130.499486
110.1881311.30340.099326
12-0.383144-2.65450.005371
13-0.046195-0.32010.375159
14-0.085358-0.59140.278522
15-0.017612-0.1220.451697
16-0.010598-0.07340.470888
17-0.033793-0.23410.407943
18-0.148616-1.02960.154169
19-0.051397-0.35610.361666
200.0083590.05790.477028
210.0020240.0140.494434
22-0.195599-1.35510.090857
23-0.094117-0.65210.258736
24-0.015693-0.10870.456938
25-0.080579-0.55830.289627
260.1018410.70560.241932
27-0.087688-0.60750.273184
28-0.113376-0.78550.218013
29-0.011632-0.08060.468051
300.0649640.45010.327337
310.0488050.33810.368369
320.0285710.19790.421962
33-0.124111-0.85990.197069
340.0813710.56380.287773
350.0537220.37220.355693
360.0252970.17530.430805
370.0862780.59780.276408
38-0.103433-0.71660.238545
39-0.068365-0.47360.318949
400.0330950.22930.409811
410.017770.12310.451265
42-0.020021-0.13870.445131
43-0.002813-0.01950.492265
44-0.022366-0.1550.438753
45-0.001227-0.00850.496627
460.0169530.11750.453495
470.0004740.00330.498698
48NANANA
49NANANA
50NANANA
51NANANA
52NANANA
53NANANA
54NANANA
55NANANA
56NANANA
57NANANA
58NANANA
59NANANA
60NANANA

\begin{tabular}{lllllllll}
\hline
Autocorrelation Function \tabularnewline
Time lag k & ACF(k) & T-STAT & P-value \tabularnewline
1 & 0.014874 & 0.103 & 0.459178 \tabularnewline
2 & 0.108952 & 0.7548 & 0.227017 \tabularnewline
3 & 0.061978 & 0.4294 & 0.334779 \tabularnewline
4 & 0.004743 & 0.0329 & 0.486962 \tabularnewline
5 & 0.209936 & 1.4545 & 0.076161 \tabularnewline
6 & 0.159859 & 1.1075 & 0.13679 \tabularnewline
7 & -0.133985 & -0.9283 & 0.178955 \tabularnewline
8 & -0.033112 & -0.2294 & 0.409765 \tabularnewline
9 & 0.066645 & 0.4617 & 0.32318 \tabularnewline
10 & 0.000187 & 0.0013 & 0.499486 \tabularnewline
11 & 0.188131 & 1.3034 & 0.099326 \tabularnewline
12 & -0.383144 & -2.6545 & 0.005371 \tabularnewline
13 & -0.046195 & -0.3201 & 0.375159 \tabularnewline
14 & -0.085358 & -0.5914 & 0.278522 \tabularnewline
15 & -0.017612 & -0.122 & 0.451697 \tabularnewline
16 & -0.010598 & -0.0734 & 0.470888 \tabularnewline
17 & -0.033793 & -0.2341 & 0.407943 \tabularnewline
18 & -0.148616 & -1.0296 & 0.154169 \tabularnewline
19 & -0.051397 & -0.3561 & 0.361666 \tabularnewline
20 & 0.008359 & 0.0579 & 0.477028 \tabularnewline
21 & 0.002024 & 0.014 & 0.494434 \tabularnewline
22 & -0.195599 & -1.3551 & 0.090857 \tabularnewline
23 & -0.094117 & -0.6521 & 0.258736 \tabularnewline
24 & -0.015693 & -0.1087 & 0.456938 \tabularnewline
25 & -0.080579 & -0.5583 & 0.289627 \tabularnewline
26 & 0.101841 & 0.7056 & 0.241932 \tabularnewline
27 & -0.087688 & -0.6075 & 0.273184 \tabularnewline
28 & -0.113376 & -0.7855 & 0.218013 \tabularnewline
29 & -0.011632 & -0.0806 & 0.468051 \tabularnewline
30 & 0.064964 & 0.4501 & 0.327337 \tabularnewline
31 & 0.048805 & 0.3381 & 0.368369 \tabularnewline
32 & 0.028571 & 0.1979 & 0.421962 \tabularnewline
33 & -0.124111 & -0.8599 & 0.197069 \tabularnewline
34 & 0.081371 & 0.5638 & 0.287773 \tabularnewline
35 & 0.053722 & 0.3722 & 0.355693 \tabularnewline
36 & 0.025297 & 0.1753 & 0.430805 \tabularnewline
37 & 0.086278 & 0.5978 & 0.276408 \tabularnewline
38 & -0.103433 & -0.7166 & 0.238545 \tabularnewline
39 & -0.068365 & -0.4736 & 0.318949 \tabularnewline
40 & 0.033095 & 0.2293 & 0.409811 \tabularnewline
41 & 0.01777 & 0.1231 & 0.451265 \tabularnewline
42 & -0.020021 & -0.1387 & 0.445131 \tabularnewline
43 & -0.002813 & -0.0195 & 0.492265 \tabularnewline
44 & -0.022366 & -0.155 & 0.438753 \tabularnewline
45 & -0.001227 & -0.0085 & 0.496627 \tabularnewline
46 & 0.016953 & 0.1175 & 0.453495 \tabularnewline
47 & 0.000474 & 0.0033 & 0.498698 \tabularnewline
48 & NA & NA & NA \tabularnewline
49 & NA & NA & NA \tabularnewline
50 & NA & NA & NA \tabularnewline
51 & NA & NA & NA \tabularnewline
52 & NA & NA & NA \tabularnewline
53 & NA & NA & NA \tabularnewline
54 & NA & NA & NA \tabularnewline
55 & NA & NA & NA \tabularnewline
56 & NA & NA & NA \tabularnewline
57 & NA & NA & NA \tabularnewline
58 & NA & NA & NA \tabularnewline
59 & NA & NA & NA \tabularnewline
60 & NA & NA & NA \tabularnewline
\hline
\end{tabular}
%Source: https://freestatistics.org/blog/index.php?pk=34609&T=1

[TABLE]
[ROW][C]Autocorrelation Function[/C][/ROW]
[ROW][C]Time lag k[/C][C]ACF(k)[/C][C]T-STAT[/C][C]P-value[/C][/ROW]
[ROW][C]1[/C][C]0.014874[/C][C]0.103[/C][C]0.459178[/C][/ROW]
[ROW][C]2[/C][C]0.108952[/C][C]0.7548[/C][C]0.227017[/C][/ROW]
[ROW][C]3[/C][C]0.061978[/C][C]0.4294[/C][C]0.334779[/C][/ROW]
[ROW][C]4[/C][C]0.004743[/C][C]0.0329[/C][C]0.486962[/C][/ROW]
[ROW][C]5[/C][C]0.209936[/C][C]1.4545[/C][C]0.076161[/C][/ROW]
[ROW][C]6[/C][C]0.159859[/C][C]1.1075[/C][C]0.13679[/C][/ROW]
[ROW][C]7[/C][C]-0.133985[/C][C]-0.9283[/C][C]0.178955[/C][/ROW]
[ROW][C]8[/C][C]-0.033112[/C][C]-0.2294[/C][C]0.409765[/C][/ROW]
[ROW][C]9[/C][C]0.066645[/C][C]0.4617[/C][C]0.32318[/C][/ROW]
[ROW][C]10[/C][C]0.000187[/C][C]0.0013[/C][C]0.499486[/C][/ROW]
[ROW][C]11[/C][C]0.188131[/C][C]1.3034[/C][C]0.099326[/C][/ROW]
[ROW][C]12[/C][C]-0.383144[/C][C]-2.6545[/C][C]0.005371[/C][/ROW]
[ROW][C]13[/C][C]-0.046195[/C][C]-0.3201[/C][C]0.375159[/C][/ROW]
[ROW][C]14[/C][C]-0.085358[/C][C]-0.5914[/C][C]0.278522[/C][/ROW]
[ROW][C]15[/C][C]-0.017612[/C][C]-0.122[/C][C]0.451697[/C][/ROW]
[ROW][C]16[/C][C]-0.010598[/C][C]-0.0734[/C][C]0.470888[/C][/ROW]
[ROW][C]17[/C][C]-0.033793[/C][C]-0.2341[/C][C]0.407943[/C][/ROW]
[ROW][C]18[/C][C]-0.148616[/C][C]-1.0296[/C][C]0.154169[/C][/ROW]
[ROW][C]19[/C][C]-0.051397[/C][C]-0.3561[/C][C]0.361666[/C][/ROW]
[ROW][C]20[/C][C]0.008359[/C][C]0.0579[/C][C]0.477028[/C][/ROW]
[ROW][C]21[/C][C]0.002024[/C][C]0.014[/C][C]0.494434[/C][/ROW]
[ROW][C]22[/C][C]-0.195599[/C][C]-1.3551[/C][C]0.090857[/C][/ROW]
[ROW][C]23[/C][C]-0.094117[/C][C]-0.6521[/C][C]0.258736[/C][/ROW]
[ROW][C]24[/C][C]-0.015693[/C][C]-0.1087[/C][C]0.456938[/C][/ROW]
[ROW][C]25[/C][C]-0.080579[/C][C]-0.5583[/C][C]0.289627[/C][/ROW]
[ROW][C]26[/C][C]0.101841[/C][C]0.7056[/C][C]0.241932[/C][/ROW]
[ROW][C]27[/C][C]-0.087688[/C][C]-0.6075[/C][C]0.273184[/C][/ROW]
[ROW][C]28[/C][C]-0.113376[/C][C]-0.7855[/C][C]0.218013[/C][/ROW]
[ROW][C]29[/C][C]-0.011632[/C][C]-0.0806[/C][C]0.468051[/C][/ROW]
[ROW][C]30[/C][C]0.064964[/C][C]0.4501[/C][C]0.327337[/C][/ROW]
[ROW][C]31[/C][C]0.048805[/C][C]0.3381[/C][C]0.368369[/C][/ROW]
[ROW][C]32[/C][C]0.028571[/C][C]0.1979[/C][C]0.421962[/C][/ROW]
[ROW][C]33[/C][C]-0.124111[/C][C]-0.8599[/C][C]0.197069[/C][/ROW]
[ROW][C]34[/C][C]0.081371[/C][C]0.5638[/C][C]0.287773[/C][/ROW]
[ROW][C]35[/C][C]0.053722[/C][C]0.3722[/C][C]0.355693[/C][/ROW]
[ROW][C]36[/C][C]0.025297[/C][C]0.1753[/C][C]0.430805[/C][/ROW]
[ROW][C]37[/C][C]0.086278[/C][C]0.5978[/C][C]0.276408[/C][/ROW]
[ROW][C]38[/C][C]-0.103433[/C][C]-0.7166[/C][C]0.238545[/C][/ROW]
[ROW][C]39[/C][C]-0.068365[/C][C]-0.4736[/C][C]0.318949[/C][/ROW]
[ROW][C]40[/C][C]0.033095[/C][C]0.2293[/C][C]0.409811[/C][/ROW]
[ROW][C]41[/C][C]0.01777[/C][C]0.1231[/C][C]0.451265[/C][/ROW]
[ROW][C]42[/C][C]-0.020021[/C][C]-0.1387[/C][C]0.445131[/C][/ROW]
[ROW][C]43[/C][C]-0.002813[/C][C]-0.0195[/C][C]0.492265[/C][/ROW]
[ROW][C]44[/C][C]-0.022366[/C][C]-0.155[/C][C]0.438753[/C][/ROW]
[ROW][C]45[/C][C]-0.001227[/C][C]-0.0085[/C][C]0.496627[/C][/ROW]
[ROW][C]46[/C][C]0.016953[/C][C]0.1175[/C][C]0.453495[/C][/ROW]
[ROW][C]47[/C][C]0.000474[/C][C]0.0033[/C][C]0.498698[/C][/ROW]
[ROW][C]48[/C][C]NA[/C][C]NA[/C][C]NA[/C][/ROW]
[ROW][C]49[/C][C]NA[/C][C]NA[/C][C]NA[/C][/ROW]
[ROW][C]50[/C][C]NA[/C][C]NA[/C][C]NA[/C][/ROW]
[ROW][C]51[/C][C]NA[/C][C]NA[/C][C]NA[/C][/ROW]
[ROW][C]52[/C][C]NA[/C][C]NA[/C][C]NA[/C][/ROW]
[ROW][C]53[/C][C]NA[/C][C]NA[/C][C]NA[/C][/ROW]
[ROW][C]54[/C][C]NA[/C][C]NA[/C][C]NA[/C][/ROW]
[ROW][C]55[/C][C]NA[/C][C]NA[/C][C]NA[/C][/ROW]
[ROW][C]56[/C][C]NA[/C][C]NA[/C][C]NA[/C][/ROW]
[ROW][C]57[/C][C]NA[/C][C]NA[/C][C]NA[/C][/ROW]
[ROW][C]58[/C][C]NA[/C][C]NA[/C][C]NA[/C][/ROW]
[ROW][C]59[/C][C]NA[/C][C]NA[/C][C]NA[/C][/ROW]
[ROW][C]60[/C][C]NA[/C][C]NA[/C][C]NA[/C][/ROW]
[/TABLE]
Source: https://freestatistics.org/blog/index.php?pk=34609&T=1

Globally Unique Identifier (entire table): ba.freestatistics.org/blog/index.php?pk=34609&T=1

As an alternative you can also use a QR Code:  

The GUIDs for individual cells are displayed in the table below:

Autocorrelation Function
Time lag kACF(k)T-STATP-value
10.0148740.1030.459178
20.1089520.75480.227017
30.0619780.42940.334779
40.0047430.03290.486962
50.2099361.45450.076161
60.1598591.10750.13679
7-0.133985-0.92830.178955
8-0.033112-0.22940.409765
90.0666450.46170.32318
100.0001870.00130.499486
110.1881311.30340.099326
12-0.383144-2.65450.005371
13-0.046195-0.32010.375159
14-0.085358-0.59140.278522
15-0.017612-0.1220.451697
16-0.010598-0.07340.470888
17-0.033793-0.23410.407943
18-0.148616-1.02960.154169
19-0.051397-0.35610.361666
200.0083590.05790.477028
210.0020240.0140.494434
22-0.195599-1.35510.090857
23-0.094117-0.65210.258736
24-0.015693-0.10870.456938
25-0.080579-0.55830.289627
260.1018410.70560.241932
27-0.087688-0.60750.273184
28-0.113376-0.78550.218013
29-0.011632-0.08060.468051
300.0649640.45010.327337
310.0488050.33810.368369
320.0285710.19790.421962
33-0.124111-0.85990.197069
340.0813710.56380.287773
350.0537220.37220.355693
360.0252970.17530.430805
370.0862780.59780.276408
38-0.103433-0.71660.238545
39-0.068365-0.47360.318949
400.0330950.22930.409811
410.017770.12310.451265
42-0.020021-0.13870.445131
43-0.002813-0.01950.492265
44-0.022366-0.1550.438753
45-0.001227-0.00850.496627
460.0169530.11750.453495
470.0004740.00330.498698
48NANANA
49NANANA
50NANANA
51NANANA
52NANANA
53NANANA
54NANANA
55NANANA
56NANANA
57NANANA
58NANANA
59NANANA
60NANANA


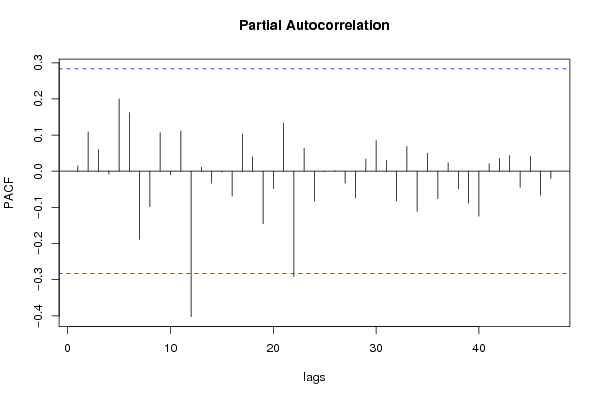
Partial Autocorrelation Function
Time lag kPACF(k)T-STATP-value
10.0148740.1030.459178
20.1087550.75350.227423
30.0596340.41320.340665
4-0.008459-0.05860.476756
50.19991.3850.086236
60.1621881.12370.13337
7-0.188573-1.30650.098809
8-0.098361-0.68150.249425
90.1065670.73830.231959
10-0.009897-0.06860.47281
110.1113180.77120.222173
12-0.402492-2.78850.003784
130.0109730.0760.469859
14-0.032753-0.22690.410724
15-0.002129-0.01480.494146
16-0.068809-0.47670.317861
170.103170.71480.239103
180.0397090.27510.392206
19-0.145273-1.00650.159615
20-0.048176-0.33380.370002
210.1336590.9260.179536
22-0.291647-2.02060.02446
230.0633130.43860.331443
24-0.082571-0.57210.284972
25-0.001268-0.00880.496515
260.0014230.00990.496086
27-0.033332-0.23090.409175
28-0.074086-0.51330.305053
290.0340690.2360.407204
300.0847740.58730.279867
310.0297080.20580.4189
32-0.082396-0.57090.285381
330.0685070.47460.318602
34-0.111399-0.77180.222009
350.0498760.34560.365594
36-0.075784-0.5250.300985
370.0233970.16210.435955
38-0.048493-0.3360.36918
39-0.08856-0.61360.271202
40-0.124684-0.86380.195988
410.0203880.14130.444131
420.0352430.24420.40407
430.0436890.30270.381717
44-0.044301-0.30690.380115
450.0413290.28630.387925
46-0.066753-0.46250.322913
47-0.020441-0.14160.443987
48NANANA
49NANANA
50NANANA
51NANANA
52NANANA
53NANANA
54NANANA
55NANANA
56NANANA
57NANANA
58NANANA
59NANANA
60NANANA

\begin{tabular}{lllllllll}
\hline
Partial Autocorrelation Function \tabularnewline
Time lag k & PACF(k) & T-STAT & P-value \tabularnewline
1 & 0.014874 & 0.103 & 0.459178 \tabularnewline
2 & 0.108755 & 0.7535 & 0.227423 \tabularnewline
3 & 0.059634 & 0.4132 & 0.340665 \tabularnewline
4 & -0.008459 & -0.0586 & 0.476756 \tabularnewline
5 & 0.1999 & 1.385 & 0.086236 \tabularnewline
6 & 0.162188 & 1.1237 & 0.13337 \tabularnewline
7 & -0.188573 & -1.3065 & 0.098809 \tabularnewline
8 & -0.098361 & -0.6815 & 0.249425 \tabularnewline
9 & 0.106567 & 0.7383 & 0.231959 \tabularnewline
10 & -0.009897 & -0.0686 & 0.47281 \tabularnewline
11 & 0.111318 & 0.7712 & 0.222173 \tabularnewline
12 & -0.402492 & -2.7885 & 0.003784 \tabularnewline
13 & 0.010973 & 0.076 & 0.469859 \tabularnewline
14 & -0.032753 & -0.2269 & 0.410724 \tabularnewline
15 & -0.002129 & -0.0148 & 0.494146 \tabularnewline
16 & -0.068809 & -0.4767 & 0.317861 \tabularnewline
17 & 0.10317 & 0.7148 & 0.239103 \tabularnewline
18 & 0.039709 & 0.2751 & 0.392206 \tabularnewline
19 & -0.145273 & -1.0065 & 0.159615 \tabularnewline
20 & -0.048176 & -0.3338 & 0.370002 \tabularnewline
21 & 0.133659 & 0.926 & 0.179536 \tabularnewline
22 & -0.291647 & -2.0206 & 0.02446 \tabularnewline
23 & 0.063313 & 0.4386 & 0.331443 \tabularnewline
24 & -0.082571 & -0.5721 & 0.284972 \tabularnewline
25 & -0.001268 & -0.0088 & 0.496515 \tabularnewline
26 & 0.001423 & 0.0099 & 0.496086 \tabularnewline
27 & -0.033332 & -0.2309 & 0.409175 \tabularnewline
28 & -0.074086 & -0.5133 & 0.305053 \tabularnewline
29 & 0.034069 & 0.236 & 0.407204 \tabularnewline
30 & 0.084774 & 0.5873 & 0.279867 \tabularnewline
31 & 0.029708 & 0.2058 & 0.4189 \tabularnewline
32 & -0.082396 & -0.5709 & 0.285381 \tabularnewline
33 & 0.068507 & 0.4746 & 0.318602 \tabularnewline
34 & -0.111399 & -0.7718 & 0.222009 \tabularnewline
35 & 0.049876 & 0.3456 & 0.365594 \tabularnewline
36 & -0.075784 & -0.525 & 0.300985 \tabularnewline
37 & 0.023397 & 0.1621 & 0.435955 \tabularnewline
38 & -0.048493 & -0.336 & 0.36918 \tabularnewline
39 & -0.08856 & -0.6136 & 0.271202 \tabularnewline
40 & -0.124684 & -0.8638 & 0.195988 \tabularnewline
41 & 0.020388 & 0.1413 & 0.444131 \tabularnewline
42 & 0.035243 & 0.2442 & 0.40407 \tabularnewline
43 & 0.043689 & 0.3027 & 0.381717 \tabularnewline
44 & -0.044301 & -0.3069 & 0.380115 \tabularnewline
45 & 0.041329 & 0.2863 & 0.387925 \tabularnewline
46 & -0.066753 & -0.4625 & 0.322913 \tabularnewline
47 & -0.020441 & -0.1416 & 0.443987 \tabularnewline
48 & NA & NA & NA \tabularnewline
49 & NA & NA & NA \tabularnewline
50 & NA & NA & NA \tabularnewline
51 & NA & NA & NA \tabularnewline
52 & NA & NA & NA \tabularnewline
53 & NA & NA & NA \tabularnewline
54 & NA & NA & NA \tabularnewline
55 & NA & NA & NA \tabularnewline
56 & NA & NA & NA \tabularnewline
57 & NA & NA & NA \tabularnewline
58 & NA & NA & NA \tabularnewline
59 & NA & NA & NA \tabularnewline
60 & NA & NA & NA \tabularnewline
\hline
\end{tabular}
%Source: https://freestatistics.org/blog/index.php?pk=34609&T=2

[TABLE]
[ROW][C]Partial Autocorrelation Function[/C][/ROW]
[ROW][C]Time lag k[/C][C]PACF(k)[/C][C]T-STAT[/C][C]P-value[/C][/ROW]
[ROW][C]1[/C][C]0.014874[/C][C]0.103[/C][C]0.459178[/C][/ROW]
[ROW][C]2[/C][C]0.108755[/C][C]0.7535[/C][C]0.227423[/C][/ROW]
[ROW][C]3[/C][C]0.059634[/C][C]0.4132[/C][C]0.340665[/C][/ROW]
[ROW][C]4[/C][C]-0.008459[/C][C]-0.0586[/C][C]0.476756[/C][/ROW]
[ROW][C]5[/C][C]0.1999[/C][C]1.385[/C][C]0.086236[/C][/ROW]
[ROW][C]6[/C][C]0.162188[/C][C]1.1237[/C][C]0.13337[/C][/ROW]
[ROW][C]7[/C][C]-0.188573[/C][C]-1.3065[/C][C]0.098809[/C][/ROW]
[ROW][C]8[/C][C]-0.098361[/C][C]-0.6815[/C][C]0.249425[/C][/ROW]
[ROW][C]9[/C][C]0.106567[/C][C]0.7383[/C][C]0.231959[/C][/ROW]
[ROW][C]10[/C][C]-0.009897[/C][C]-0.0686[/C][C]0.47281[/C][/ROW]
[ROW][C]11[/C][C]0.111318[/C][C]0.7712[/C][C]0.222173[/C][/ROW]
[ROW][C]12[/C][C]-0.402492[/C][C]-2.7885[/C][C]0.003784[/C][/ROW]
[ROW][C]13[/C][C]0.010973[/C][C]0.076[/C][C]0.469859[/C][/ROW]
[ROW][C]14[/C][C]-0.032753[/C][C]-0.2269[/C][C]0.410724[/C][/ROW]
[ROW][C]15[/C][C]-0.002129[/C][C]-0.0148[/C][C]0.494146[/C][/ROW]
[ROW][C]16[/C][C]-0.068809[/C][C]-0.4767[/C][C]0.317861[/C][/ROW]
[ROW][C]17[/C][C]0.10317[/C][C]0.7148[/C][C]0.239103[/C][/ROW]
[ROW][C]18[/C][C]0.039709[/C][C]0.2751[/C][C]0.392206[/C][/ROW]
[ROW][C]19[/C][C]-0.145273[/C][C]-1.0065[/C][C]0.159615[/C][/ROW]
[ROW][C]20[/C][C]-0.048176[/C][C]-0.3338[/C][C]0.370002[/C][/ROW]
[ROW][C]21[/C][C]0.133659[/C][C]0.926[/C][C]0.179536[/C][/ROW]
[ROW][C]22[/C][C]-0.291647[/C][C]-2.0206[/C][C]0.02446[/C][/ROW]
[ROW][C]23[/C][C]0.063313[/C][C]0.4386[/C][C]0.331443[/C][/ROW]
[ROW][C]24[/C][C]-0.082571[/C][C]-0.5721[/C][C]0.284972[/C][/ROW]
[ROW][C]25[/C][C]-0.001268[/C][C]-0.0088[/C][C]0.496515[/C][/ROW]
[ROW][C]26[/C][C]0.001423[/C][C]0.0099[/C][C]0.496086[/C][/ROW]
[ROW][C]27[/C][C]-0.033332[/C][C]-0.2309[/C][C]0.409175[/C][/ROW]
[ROW][C]28[/C][C]-0.074086[/C][C]-0.5133[/C][C]0.305053[/C][/ROW]
[ROW][C]29[/C][C]0.034069[/C][C]0.236[/C][C]0.407204[/C][/ROW]
[ROW][C]30[/C][C]0.084774[/C][C]0.5873[/C][C]0.279867[/C][/ROW]
[ROW][C]31[/C][C]0.029708[/C][C]0.2058[/C][C]0.4189[/C][/ROW]
[ROW][C]32[/C][C]-0.082396[/C][C]-0.5709[/C][C]0.285381[/C][/ROW]
[ROW][C]33[/C][C]0.068507[/C][C]0.4746[/C][C]0.318602[/C][/ROW]
[ROW][C]34[/C][C]-0.111399[/C][C]-0.7718[/C][C]0.222009[/C][/ROW]
[ROW][C]35[/C][C]0.049876[/C][C]0.3456[/C][C]0.365594[/C][/ROW]
[ROW][C]36[/C][C]-0.075784[/C][C]-0.525[/C][C]0.300985[/C][/ROW]
[ROW][C]37[/C][C]0.023397[/C][C]0.1621[/C][C]0.435955[/C][/ROW]
[ROW][C]38[/C][C]-0.048493[/C][C]-0.336[/C][C]0.36918[/C][/ROW]
[ROW][C]39[/C][C]-0.08856[/C][C]-0.6136[/C][C]0.271202[/C][/ROW]
[ROW][C]40[/C][C]-0.124684[/C][C]-0.8638[/C][C]0.195988[/C][/ROW]
[ROW][C]41[/C][C]0.020388[/C][C]0.1413[/C][C]0.444131[/C][/ROW]
[ROW][C]42[/C][C]0.035243[/C][C]0.2442[/C][C]0.40407[/C][/ROW]
[ROW][C]43[/C][C]0.043689[/C][C]0.3027[/C][C]0.381717[/C][/ROW]
[ROW][C]44[/C][C]-0.044301[/C][C]-0.3069[/C][C]0.380115[/C][/ROW]
[ROW][C]45[/C][C]0.041329[/C][C]0.2863[/C][C]0.387925[/C][/ROW]
[ROW][C]46[/C][C]-0.066753[/C][C]-0.4625[/C][C]0.322913[/C][/ROW]
[ROW][C]47[/C][C]-0.020441[/C][C]-0.1416[/C][C]0.443987[/C][/ROW]
[ROW][C]48[/C][C]NA[/C][C]NA[/C][C]NA[/C][/ROW]
[ROW][C]49[/C][C]NA[/C][C]NA[/C][C]NA[/C][/ROW]
[ROW][C]50[/C][C]NA[/C][C]NA[/C][C]NA[/C][/ROW]
[ROW][C]51[/C][C]NA[/C][C]NA[/C][C]NA[/C][/ROW]
[ROW][C]52[/C][C]NA[/C][C]NA[/C][C]NA[/C][/ROW]
[ROW][C]53[/C][C]NA[/C][C]NA[/C][C]NA[/C][/ROW]
[ROW][C]54[/C][C]NA[/C][C]NA[/C][C]NA[/C][/ROW]
[ROW][C]55[/C][C]NA[/C][C]NA[/C][C]NA[/C][/ROW]
[ROW][C]56[/C][C]NA[/C][C]NA[/C][C]NA[/C][/ROW]
[ROW][C]57[/C][C]NA[/C][C]NA[/C][C]NA[/C][/ROW]
[ROW][C]58[/C][C]NA[/C][C]NA[/C][C]NA[/C][/ROW]
[ROW][C]59[/C][C]NA[/C][C]NA[/C][C]NA[/C][/ROW]
[ROW][C]60[/C][C]NA[/C][C]NA[/C][C]NA[/C][/ROW]
[/TABLE]
Source: https://freestatistics.org/blog/index.php?pk=34609&T=2

Globally Unique Identifier (entire table): ba.freestatistics.org/blog/index.php?pk=34609&T=2

As an alternative you can also use a QR Code:  

The GUIDs for individual cells are displayed in the table below:

Partial Autocorrelation Function
Time lag kPACF(k)T-STATP-value
10.0148740.1030.459178
20.1087550.75350.227423
30.0596340.41320.340665
4-0.008459-0.05860.476756
50.19991.3850.086236
60.1621881.12370.13337
7-0.188573-1.30650.098809
8-0.098361-0.68150.249425
90.1065670.73830.231959
10-0.009897-0.06860.47281
110.1113180.77120.222173
12-0.402492-2.78850.003784
130.0109730.0760.469859
14-0.032753-0.22690.410724
15-0.002129-0.01480.494146
16-0.068809-0.47670.317861
170.103170.71480.239103
180.0397090.27510.392206
19-0.145273-1.00650.159615
20-0.048176-0.33380.370002
210.1336590.9260.179536
22-0.291647-2.02060.02446
230.0633130.43860.331443
24-0.082571-0.57210.284972
25-0.001268-0.00880.496515
260.0014230.00990.496086
27-0.033332-0.23090.409175
28-0.074086-0.51330.305053
290.0340690.2360.407204
300.0847740.58730.279867
310.0297080.20580.4189
32-0.082396-0.57090.285381
330.0685070.47460.318602
34-0.111399-0.77180.222009
350.0498760.34560.365594
36-0.075784-0.5250.300985
370.0233970.16210.435955
38-0.048493-0.3360.36918
39-0.08856-0.61360.271202
40-0.124684-0.86380.195988
410.0203880.14130.444131
420.0352430.24420.40407
430.0436890.30270.381717
44-0.044301-0.30690.380115
450.0413290.28630.387925
46-0.066753-0.46250.322913
47-0.020441-0.14160.443987
48NANANA
49NANANA
50NANANA
51NANANA
52NANANA
53NANANA
54NANANA
55NANANA
56NANANA
57NANANA
58NANANA
59NANANA
60NANANA


Parameters (Session):
par1 = 60 ; par2 = 1 ; par3 = 0 ; par4 = 1 ; par5 = 12 ;
Parameters (R input):
par1 = 60 ; par2 = 1 ; par3 = 0 ; par4 = 1 ; par5 = 12 ;
R code (references can be found in the software module):
if (par1 == 'Default') {
par1 = 10*log10(length(x))
} else {
par1 <- as.numeric(par1)
}
par2 <- as.numeric(par2)
par3 <- as.numeric(par3)
par4 <- as.numeric(par4)
par5 <- as.numeric(par5)
if (par2 == 0) {
x <- log(x)
} else {
x <- (x ^ par2 - 1) / par2
}
if (par3 > 0) x <- diff(x,lag=1,difference=par3)
if (par4 > 0) x <- diff(x,lag=par5,difference=par4)
bitmap(file='pic1.png')
racf <- acf(x,par1,main='Autocorrelation',xlab='lags',ylab='ACF')
dev.off()
bitmap(file='pic2.png')
rpacf <- pacf(x,par1,main='Partial Autocorrelation',xlab='lags',ylab='PACF')
dev.off()
(myacf <- c(racf$acf))
(mypacf <- c(rpacf$acf))
lengthx <- length(x)
sqrtn <- sqrt(lengthx)
load(file='createtable')
a<-table.start()
a<-table.row.start(a)
a<-table.element(a,'Autocorrelation Function',4,TRUE)
a<-table.row.end(a)
a<-table.row.start(a)
a<-table.element(a,'Time lag k',header=TRUE)
a<-table.element(a,hyperlink('basics.htm','ACF(k)','click here for more information about the Autocorrelation Function'),header=TRUE)
a<-table.element(a,'T-STAT',header=TRUE)
a<-table.element(a,'P-value',header=TRUE)
a<-table.row.end(a)
for (i in 2:(par1+1)) {
a<-table.row.start(a)
a<-table.element(a,i-1,header=TRUE)
a<-table.element(a,round(myacf[i],6))
mytstat <- myacf[i]*sqrtn
a<-table.element(a,round(mytstat,4))
a<-table.element(a,round(1-pt(abs(mytstat),lengthx),6))
a<-table.row.end(a)
}
a<-table.end(a)
table.save(a,file='mytable.tab')
a<-table.start()
a<-table.row.start(a)
a<-table.element(a,'Partial Autocorrelation Function',4,TRUE)
a<-table.row.end(a)
a<-table.row.start(a)
a<-table.element(a,'Time lag k',header=TRUE)
a<-table.element(a,hyperlink('basics.htm','PACF(k)','click here for more information about the Partial Autocorrelation Function'),header=TRUE)
a<-table.element(a,'T-STAT',header=TRUE)
a<-table.element(a,'P-value',header=TRUE)
a<-table.row.end(a)
for (i in 1:par1) {
a<-table.row.start(a)
a<-table.element(a,i,header=TRUE)
a<-table.element(a,round(mypacf[i],6))
mytstat <- mypacf[i]*sqrtn
a<-table.element(a,round(mytstat,4))
a<-table.element(a,round(1-pt(abs(mytstat),lengthx),6))
a<-table.row.end(a)
}
a<-table.end(a)
table.save(a,file='mytable1.tab')