Free Statistics

of Irreproducible Research!

Author's title

paper: autocorrelation Investeringen seizoenaal gedifferentieerd (zonder se...

Author*The author of this computation has been verified*
R Software Modulerwasp_autocorrelation.wasp
Title produced by software(Partial) Autocorrelation Function
Date of computationWed, 17 Dec 2008 22:44:14 -0700
Cite this page as followsStatistical Computations at FreeStatistics.org, Office for Research Development and Education, URL https://freestatistics.org/blog/index.php?v=date/2008/Dec/18/t1229579173giwo0b87utnw9in.htm/, Retrieved Sun, 12 May 2024 02:14:51 +0000
Statistical Computations at FreeStatistics.org, Office for Research Development and Education, URL https://freestatistics.org/blog/index.php?pk=34608, Retrieved Sun, 12 May 2024 02:14:51 +0000
QR Codes:

Original text written by user:
IsPrivate?No (this computation is public)
User-defined keywords
Estimated Impact199
Family? (F = Feedback message, R = changed R code, M = changed R Module, P = changed Parameters, D = changed Data)
-       [(Partial) Autocorrelation Function] [paper: autocorrel...] [2008-12-18 05:44:14] [366411ff82333cf2a466cacd3525c11d] [Current]
Feedback Forum

Post a new message
Dataseries X:
101,3
91,5
152,6
86,6
86,6
98,5
86,7
89,1
111
92,6
85,1
116,1
98,3
97,7
177,9
94,2
83,8
109,5
102,3
102,5
116,4
85,3
88,2
104,7
99,4
113,8
166,6
89,2
93,2
115
97,2
112,5
121,8
100,2
93,8
113,6
110,7
127,6
185,9
105,9
108
125,2
106,2
123,3
145,2
114,3
108,4
120,9
126,3
141,3
208,2
131,6
119,8
122,5
137,6
141
154,1
127
106,1
129,9


Summary of computational transaction
Raw Inputview raw input (R code)
Raw Outputview raw output of R engine
Computing time3 seconds
R Server'Herman Ole Andreas Wold' @ 193.190.124.10:1001

\begin{tabular}{lllllllll}
\hline
Summary of computational transaction \tabularnewline
Raw Input & view raw input (R code)  \tabularnewline
Raw Output & view raw output of R engine  \tabularnewline
Computing time & 3 seconds \tabularnewline
R Server & 'Herman Ole Andreas Wold' @ 193.190.124.10:1001 \tabularnewline
\hline
\end{tabular}
%Source: https://freestatistics.org/blog/index.php?pk=34608&T=0

[TABLE]
[ROW][C]Summary of computational transaction[/C][/ROW]
[ROW][C]Raw Input[/C][C]view raw input (R code) [/C][/ROW]
[ROW][C]Raw Output[/C][C]view raw output of R engine [/C][/ROW]
[ROW][C]Computing time[/C][C]3 seconds[/C][/ROW]
[ROW][C]R Server[/C][C]'Herman Ole Andreas Wold' @ 193.190.124.10:1001[/C][/ROW]
[/TABLE]
Source: https://freestatistics.org/blog/index.php?pk=34608&T=0

Globally Unique Identifier (entire table): ba.freestatistics.org/blog/index.php?pk=34608&T=0

As an alternative you can also use a QR Code:  

The GUIDs for individual cells are displayed in the table below:

Summary of computational transaction
Raw Inputview raw input (R code)
Raw Outputview raw output of R engine
Computing time3 seconds
R Server'Herman Ole Andreas Wold' @ 193.190.124.10:1001


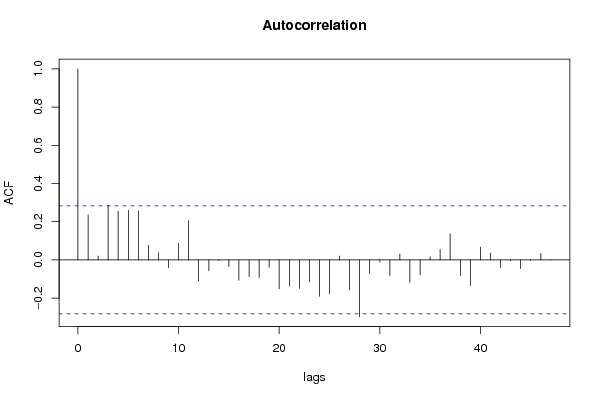
Autocorrelation Function
Time lag kACF(k)T-STATP-value
10.235871.63420.054384
20.0201130.13930.444879
30.2869381.9880.026268
40.2548941.7660.041881
50.2596631.7990.039154
60.2562761.77550.041075
70.0762310.52810.299916
80.0373570.25880.398442
9-0.041302-0.28620.387997
100.0866060.60.275656
110.2055891.42440.080405
12-0.110489-0.76550.223864
13-0.0572-0.39630.346821
14-0.004649-0.03220.487219
15-0.034676-0.24020.405584
16-0.107074-0.74180.230903
17-0.088077-0.61020.272298
18-0.091541-0.63420.264476
19-0.039201-0.27160.393549
20-0.151036-1.04640.150307
21-0.137213-0.95060.173275
22-0.148638-1.02980.154134
23-0.113998-0.78980.216763
24-0.190423-1.31930.096665
25-0.177639-1.23070.112213
260.0200290.13880.445109
27-0.158004-1.09470.139559
28-0.297069-2.05820.022513
29-0.071326-0.49420.311724
30-0.011236-0.07780.469137
31-0.081024-0.56140.288585
320.0304630.21110.41687
33-0.118257-0.81930.20833
34-0.077859-0.53940.296043
350.0165010.11430.454729
360.0556320.38540.350812
370.136840.94810.173925
38-0.080989-0.56110.288667
39-0.13412-0.92920.178715
400.066660.46180.323144
410.0357930.2480.402603
42-0.040326-0.27940.390574
43-0.005667-0.03930.484422
44-0.04505-0.31210.378153
45-0.002471-0.01710.493207
460.0341480.23660.406994
470.0009540.00660.497377
48NANANA
49NANANA
50NANANA
51NANANA
52NANANA
53NANANA
54NANANA
55NANANA
56NANANA
57NANANA
58NANANA
59NANANA
60NANANA

\begin{tabular}{lllllllll}
\hline
Autocorrelation Function \tabularnewline
Time lag k & ACF(k) & T-STAT & P-value \tabularnewline
1 & 0.23587 & 1.6342 & 0.054384 \tabularnewline
2 & 0.020113 & 0.1393 & 0.444879 \tabularnewline
3 & 0.286938 & 1.988 & 0.026268 \tabularnewline
4 & 0.254894 & 1.766 & 0.041881 \tabularnewline
5 & 0.259663 & 1.799 & 0.039154 \tabularnewline
6 & 0.256276 & 1.7755 & 0.041075 \tabularnewline
7 & 0.076231 & 0.5281 & 0.299916 \tabularnewline
8 & 0.037357 & 0.2588 & 0.398442 \tabularnewline
9 & -0.041302 & -0.2862 & 0.387997 \tabularnewline
10 & 0.086606 & 0.6 & 0.275656 \tabularnewline
11 & 0.205589 & 1.4244 & 0.080405 \tabularnewline
12 & -0.110489 & -0.7655 & 0.223864 \tabularnewline
13 & -0.0572 & -0.3963 & 0.346821 \tabularnewline
14 & -0.004649 & -0.0322 & 0.487219 \tabularnewline
15 & -0.034676 & -0.2402 & 0.405584 \tabularnewline
16 & -0.107074 & -0.7418 & 0.230903 \tabularnewline
17 & -0.088077 & -0.6102 & 0.272298 \tabularnewline
18 & -0.091541 & -0.6342 & 0.264476 \tabularnewline
19 & -0.039201 & -0.2716 & 0.393549 \tabularnewline
20 & -0.151036 & -1.0464 & 0.150307 \tabularnewline
21 & -0.137213 & -0.9506 & 0.173275 \tabularnewline
22 & -0.148638 & -1.0298 & 0.154134 \tabularnewline
23 & -0.113998 & -0.7898 & 0.216763 \tabularnewline
24 & -0.190423 & -1.3193 & 0.096665 \tabularnewline
25 & -0.177639 & -1.2307 & 0.112213 \tabularnewline
26 & 0.020029 & 0.1388 & 0.445109 \tabularnewline
27 & -0.158004 & -1.0947 & 0.139559 \tabularnewline
28 & -0.297069 & -2.0582 & 0.022513 \tabularnewline
29 & -0.071326 & -0.4942 & 0.311724 \tabularnewline
30 & -0.011236 & -0.0778 & 0.469137 \tabularnewline
31 & -0.081024 & -0.5614 & 0.288585 \tabularnewline
32 & 0.030463 & 0.2111 & 0.41687 \tabularnewline
33 & -0.118257 & -0.8193 & 0.20833 \tabularnewline
34 & -0.077859 & -0.5394 & 0.296043 \tabularnewline
35 & 0.016501 & 0.1143 & 0.454729 \tabularnewline
36 & 0.055632 & 0.3854 & 0.350812 \tabularnewline
37 & 0.13684 & 0.9481 & 0.173925 \tabularnewline
38 & -0.080989 & -0.5611 & 0.288667 \tabularnewline
39 & -0.13412 & -0.9292 & 0.178715 \tabularnewline
40 & 0.06666 & 0.4618 & 0.323144 \tabularnewline
41 & 0.035793 & 0.248 & 0.402603 \tabularnewline
42 & -0.040326 & -0.2794 & 0.390574 \tabularnewline
43 & -0.005667 & -0.0393 & 0.484422 \tabularnewline
44 & -0.04505 & -0.3121 & 0.378153 \tabularnewline
45 & -0.002471 & -0.0171 & 0.493207 \tabularnewline
46 & 0.034148 & 0.2366 & 0.406994 \tabularnewline
47 & 0.000954 & 0.0066 & 0.497377 \tabularnewline
48 & NA & NA & NA \tabularnewline
49 & NA & NA & NA \tabularnewline
50 & NA & NA & NA \tabularnewline
51 & NA & NA & NA \tabularnewline
52 & NA & NA & NA \tabularnewline
53 & NA & NA & NA \tabularnewline
54 & NA & NA & NA \tabularnewline
55 & NA & NA & NA \tabularnewline
56 & NA & NA & NA \tabularnewline
57 & NA & NA & NA \tabularnewline
58 & NA & NA & NA \tabularnewline
59 & NA & NA & NA \tabularnewline
60 & NA & NA & NA \tabularnewline
\hline
\end{tabular}
%Source: https://freestatistics.org/blog/index.php?pk=34608&T=1

[TABLE]
[ROW][C]Autocorrelation Function[/C][/ROW]
[ROW][C]Time lag k[/C][C]ACF(k)[/C][C]T-STAT[/C][C]P-value[/C][/ROW]
[ROW][C]1[/C][C]0.23587[/C][C]1.6342[/C][C]0.054384[/C][/ROW]
[ROW][C]2[/C][C]0.020113[/C][C]0.1393[/C][C]0.444879[/C][/ROW]
[ROW][C]3[/C][C]0.286938[/C][C]1.988[/C][C]0.026268[/C][/ROW]
[ROW][C]4[/C][C]0.254894[/C][C]1.766[/C][C]0.041881[/C][/ROW]
[ROW][C]5[/C][C]0.259663[/C][C]1.799[/C][C]0.039154[/C][/ROW]
[ROW][C]6[/C][C]0.256276[/C][C]1.7755[/C][C]0.041075[/C][/ROW]
[ROW][C]7[/C][C]0.076231[/C][C]0.5281[/C][C]0.299916[/C][/ROW]
[ROW][C]8[/C][C]0.037357[/C][C]0.2588[/C][C]0.398442[/C][/ROW]
[ROW][C]9[/C][C]-0.041302[/C][C]-0.2862[/C][C]0.387997[/C][/ROW]
[ROW][C]10[/C][C]0.086606[/C][C]0.6[/C][C]0.275656[/C][/ROW]
[ROW][C]11[/C][C]0.205589[/C][C]1.4244[/C][C]0.080405[/C][/ROW]
[ROW][C]12[/C][C]-0.110489[/C][C]-0.7655[/C][C]0.223864[/C][/ROW]
[ROW][C]13[/C][C]-0.0572[/C][C]-0.3963[/C][C]0.346821[/C][/ROW]
[ROW][C]14[/C][C]-0.004649[/C][C]-0.0322[/C][C]0.487219[/C][/ROW]
[ROW][C]15[/C][C]-0.034676[/C][C]-0.2402[/C][C]0.405584[/C][/ROW]
[ROW][C]16[/C][C]-0.107074[/C][C]-0.7418[/C][C]0.230903[/C][/ROW]
[ROW][C]17[/C][C]-0.088077[/C][C]-0.6102[/C][C]0.272298[/C][/ROW]
[ROW][C]18[/C][C]-0.091541[/C][C]-0.6342[/C][C]0.264476[/C][/ROW]
[ROW][C]19[/C][C]-0.039201[/C][C]-0.2716[/C][C]0.393549[/C][/ROW]
[ROW][C]20[/C][C]-0.151036[/C][C]-1.0464[/C][C]0.150307[/C][/ROW]
[ROW][C]21[/C][C]-0.137213[/C][C]-0.9506[/C][C]0.173275[/C][/ROW]
[ROW][C]22[/C][C]-0.148638[/C][C]-1.0298[/C][C]0.154134[/C][/ROW]
[ROW][C]23[/C][C]-0.113998[/C][C]-0.7898[/C][C]0.216763[/C][/ROW]
[ROW][C]24[/C][C]-0.190423[/C][C]-1.3193[/C][C]0.096665[/C][/ROW]
[ROW][C]25[/C][C]-0.177639[/C][C]-1.2307[/C][C]0.112213[/C][/ROW]
[ROW][C]26[/C][C]0.020029[/C][C]0.1388[/C][C]0.445109[/C][/ROW]
[ROW][C]27[/C][C]-0.158004[/C][C]-1.0947[/C][C]0.139559[/C][/ROW]
[ROW][C]28[/C][C]-0.297069[/C][C]-2.0582[/C][C]0.022513[/C][/ROW]
[ROW][C]29[/C][C]-0.071326[/C][C]-0.4942[/C][C]0.311724[/C][/ROW]
[ROW][C]30[/C][C]-0.011236[/C][C]-0.0778[/C][C]0.469137[/C][/ROW]
[ROW][C]31[/C][C]-0.081024[/C][C]-0.5614[/C][C]0.288585[/C][/ROW]
[ROW][C]32[/C][C]0.030463[/C][C]0.2111[/C][C]0.41687[/C][/ROW]
[ROW][C]33[/C][C]-0.118257[/C][C]-0.8193[/C][C]0.20833[/C][/ROW]
[ROW][C]34[/C][C]-0.077859[/C][C]-0.5394[/C][C]0.296043[/C][/ROW]
[ROW][C]35[/C][C]0.016501[/C][C]0.1143[/C][C]0.454729[/C][/ROW]
[ROW][C]36[/C][C]0.055632[/C][C]0.3854[/C][C]0.350812[/C][/ROW]
[ROW][C]37[/C][C]0.13684[/C][C]0.9481[/C][C]0.173925[/C][/ROW]
[ROW][C]38[/C][C]-0.080989[/C][C]-0.5611[/C][C]0.288667[/C][/ROW]
[ROW][C]39[/C][C]-0.13412[/C][C]-0.9292[/C][C]0.178715[/C][/ROW]
[ROW][C]40[/C][C]0.06666[/C][C]0.4618[/C][C]0.323144[/C][/ROW]
[ROW][C]41[/C][C]0.035793[/C][C]0.248[/C][C]0.402603[/C][/ROW]
[ROW][C]42[/C][C]-0.040326[/C][C]-0.2794[/C][C]0.390574[/C][/ROW]
[ROW][C]43[/C][C]-0.005667[/C][C]-0.0393[/C][C]0.484422[/C][/ROW]
[ROW][C]44[/C][C]-0.04505[/C][C]-0.3121[/C][C]0.378153[/C][/ROW]
[ROW][C]45[/C][C]-0.002471[/C][C]-0.0171[/C][C]0.493207[/C][/ROW]
[ROW][C]46[/C][C]0.034148[/C][C]0.2366[/C][C]0.406994[/C][/ROW]
[ROW][C]47[/C][C]0.000954[/C][C]0.0066[/C][C]0.497377[/C][/ROW]
[ROW][C]48[/C][C]NA[/C][C]NA[/C][C]NA[/C][/ROW]
[ROW][C]49[/C][C]NA[/C][C]NA[/C][C]NA[/C][/ROW]
[ROW][C]50[/C][C]NA[/C][C]NA[/C][C]NA[/C][/ROW]
[ROW][C]51[/C][C]NA[/C][C]NA[/C][C]NA[/C][/ROW]
[ROW][C]52[/C][C]NA[/C][C]NA[/C][C]NA[/C][/ROW]
[ROW][C]53[/C][C]NA[/C][C]NA[/C][C]NA[/C][/ROW]
[ROW][C]54[/C][C]NA[/C][C]NA[/C][C]NA[/C][/ROW]
[ROW][C]55[/C][C]NA[/C][C]NA[/C][C]NA[/C][/ROW]
[ROW][C]56[/C][C]NA[/C][C]NA[/C][C]NA[/C][/ROW]
[ROW][C]57[/C][C]NA[/C][C]NA[/C][C]NA[/C][/ROW]
[ROW][C]58[/C][C]NA[/C][C]NA[/C][C]NA[/C][/ROW]
[ROW][C]59[/C][C]NA[/C][C]NA[/C][C]NA[/C][/ROW]
[ROW][C]60[/C][C]NA[/C][C]NA[/C][C]NA[/C][/ROW]
[/TABLE]
Source: https://freestatistics.org/blog/index.php?pk=34608&T=1

Globally Unique Identifier (entire table): ba.freestatistics.org/blog/index.php?pk=34608&T=1

As an alternative you can also use a QR Code:  

The GUIDs for individual cells are displayed in the table below:

Autocorrelation Function
Time lag kACF(k)T-STATP-value
10.235871.63420.054384
20.0201130.13930.444879
30.2869381.9880.026268
40.2548941.7660.041881
50.2596631.7990.039154
60.2562761.77550.041075
70.0762310.52810.299916
80.0373570.25880.398442
9-0.041302-0.28620.387997
100.0866060.60.275656
110.2055891.42440.080405
12-0.110489-0.76550.223864
13-0.0572-0.39630.346821
14-0.004649-0.03220.487219
15-0.034676-0.24020.405584
16-0.107074-0.74180.230903
17-0.088077-0.61020.272298
18-0.091541-0.63420.264476
19-0.039201-0.27160.393549
20-0.151036-1.04640.150307
21-0.137213-0.95060.173275
22-0.148638-1.02980.154134
23-0.113998-0.78980.216763
24-0.190423-1.31930.096665
25-0.177639-1.23070.112213
260.0200290.13880.445109
27-0.158004-1.09470.139559
28-0.297069-2.05820.022513
29-0.071326-0.49420.311724
30-0.011236-0.07780.469137
31-0.081024-0.56140.288585
320.0304630.21110.41687
33-0.118257-0.81930.20833
34-0.077859-0.53940.296043
350.0165010.11430.454729
360.0556320.38540.350812
370.136840.94810.173925
38-0.080989-0.56110.288667
39-0.13412-0.92920.178715
400.066660.46180.323144
410.0357930.2480.402603
42-0.040326-0.27940.390574
43-0.005667-0.03930.484422
44-0.04505-0.31210.378153
45-0.002471-0.01710.493207
460.0341480.23660.406994
470.0009540.00660.497377
48NANANA
49NANANA
50NANANA
51NANANA
52NANANA
53NANANA
54NANANA
55NANANA
56NANANA
57NANANA
58NANANA
59NANANA
60NANANA


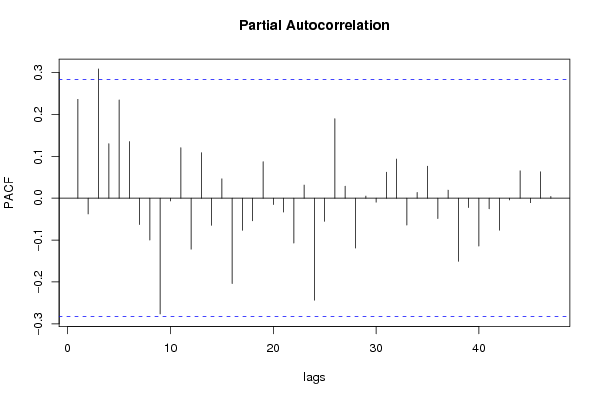
Partial Autocorrelation Function
Time lag kPACF(k)T-STATP-value
10.235871.63420.054384
2-0.037614-0.26060.397759
30.308462.13710.018858
40.1299160.90010.186285
50.2343511.62360.055502
60.1350920.93590.176993
7-0.06304-0.43680.332124
8-0.099917-0.69220.246059
9-0.276363-1.91470.030751
10-0.006617-0.04580.481812
110.1204760.83470.204016
12-0.12193-0.84480.201219
130.1084950.75170.227957
14-0.064977-0.45020.327307
150.046190.320.375174
16-0.204-1.41340.082002
17-0.076842-0.53240.298461
18-0.053976-0.3740.355042
190.0870830.60330.274565
20-0.015185-0.10520.458327
21-0.03308-0.22920.409848
22-0.107135-0.74230.230775
230.0312550.21650.414742
24-0.243549-1.68740.049012
25-0.055154-0.38210.35203
260.1896661.3140.097539
270.0284460.19710.4223
28-0.119245-0.82620.206401
290.0051160.03540.485937
30-0.009558-0.06620.47374
310.0620180.42970.334679
320.0932680.64620.260621
33-0.064162-0.44450.329329
340.0137730.09540.462188
350.076250.52830.299871
36-0.048792-0.3380.368404
370.019180.13290.44742
38-0.150696-1.04410.150846
39-0.022434-0.15540.438569
40-0.114246-0.79150.216268
41-0.025511-0.17670.430226
42-0.076575-0.53050.299095
43-0.00434-0.03010.488068
440.0651940.45170.326768
45-0.010736-0.07440.470508
460.0628790.43560.332525
470.0041460.02870.488602
48NANANA
49NANANA
50NANANA
51NANANA
52NANANA
53NANANA
54NANANA
55NANANA
56NANANA
57NANANA
58NANANA
59NANANA
60NANANA

\begin{tabular}{lllllllll}
\hline
Partial Autocorrelation Function \tabularnewline
Time lag k & PACF(k) & T-STAT & P-value \tabularnewline
1 & 0.23587 & 1.6342 & 0.054384 \tabularnewline
2 & -0.037614 & -0.2606 & 0.397759 \tabularnewline
3 & 0.30846 & 2.1371 & 0.018858 \tabularnewline
4 & 0.129916 & 0.9001 & 0.186285 \tabularnewline
5 & 0.234351 & 1.6236 & 0.055502 \tabularnewline
6 & 0.135092 & 0.9359 & 0.176993 \tabularnewline
7 & -0.06304 & -0.4368 & 0.332124 \tabularnewline
8 & -0.099917 & -0.6922 & 0.246059 \tabularnewline
9 & -0.276363 & -1.9147 & 0.030751 \tabularnewline
10 & -0.006617 & -0.0458 & 0.481812 \tabularnewline
11 & 0.120476 & 0.8347 & 0.204016 \tabularnewline
12 & -0.12193 & -0.8448 & 0.201219 \tabularnewline
13 & 0.108495 & 0.7517 & 0.227957 \tabularnewline
14 & -0.064977 & -0.4502 & 0.327307 \tabularnewline
15 & 0.04619 & 0.32 & 0.375174 \tabularnewline
16 & -0.204 & -1.4134 & 0.082002 \tabularnewline
17 & -0.076842 & -0.5324 & 0.298461 \tabularnewline
18 & -0.053976 & -0.374 & 0.355042 \tabularnewline
19 & 0.087083 & 0.6033 & 0.274565 \tabularnewline
20 & -0.015185 & -0.1052 & 0.458327 \tabularnewline
21 & -0.03308 & -0.2292 & 0.409848 \tabularnewline
22 & -0.107135 & -0.7423 & 0.230775 \tabularnewline
23 & 0.031255 & 0.2165 & 0.414742 \tabularnewline
24 & -0.243549 & -1.6874 & 0.049012 \tabularnewline
25 & -0.055154 & -0.3821 & 0.35203 \tabularnewline
26 & 0.189666 & 1.314 & 0.097539 \tabularnewline
27 & 0.028446 & 0.1971 & 0.4223 \tabularnewline
28 & -0.119245 & -0.8262 & 0.206401 \tabularnewline
29 & 0.005116 & 0.0354 & 0.485937 \tabularnewline
30 & -0.009558 & -0.0662 & 0.47374 \tabularnewline
31 & 0.062018 & 0.4297 & 0.334679 \tabularnewline
32 & 0.093268 & 0.6462 & 0.260621 \tabularnewline
33 & -0.064162 & -0.4445 & 0.329329 \tabularnewline
34 & 0.013773 & 0.0954 & 0.462188 \tabularnewline
35 & 0.07625 & 0.5283 & 0.299871 \tabularnewline
36 & -0.048792 & -0.338 & 0.368404 \tabularnewline
37 & 0.01918 & 0.1329 & 0.44742 \tabularnewline
38 & -0.150696 & -1.0441 & 0.150846 \tabularnewline
39 & -0.022434 & -0.1554 & 0.438569 \tabularnewline
40 & -0.114246 & -0.7915 & 0.216268 \tabularnewline
41 & -0.025511 & -0.1767 & 0.430226 \tabularnewline
42 & -0.076575 & -0.5305 & 0.299095 \tabularnewline
43 & -0.00434 & -0.0301 & 0.488068 \tabularnewline
44 & 0.065194 & 0.4517 & 0.326768 \tabularnewline
45 & -0.010736 & -0.0744 & 0.470508 \tabularnewline
46 & 0.062879 & 0.4356 & 0.332525 \tabularnewline
47 & 0.004146 & 0.0287 & 0.488602 \tabularnewline
48 & NA & NA & NA \tabularnewline
49 & NA & NA & NA \tabularnewline
50 & NA & NA & NA \tabularnewline
51 & NA & NA & NA \tabularnewline
52 & NA & NA & NA \tabularnewline
53 & NA & NA & NA \tabularnewline
54 & NA & NA & NA \tabularnewline
55 & NA & NA & NA \tabularnewline
56 & NA & NA & NA \tabularnewline
57 & NA & NA & NA \tabularnewline
58 & NA & NA & NA \tabularnewline
59 & NA & NA & NA \tabularnewline
60 & NA & NA & NA \tabularnewline
\hline
\end{tabular}
%Source: https://freestatistics.org/blog/index.php?pk=34608&T=2

[TABLE]
[ROW][C]Partial Autocorrelation Function[/C][/ROW]
[ROW][C]Time lag k[/C][C]PACF(k)[/C][C]T-STAT[/C][C]P-value[/C][/ROW]
[ROW][C]1[/C][C]0.23587[/C][C]1.6342[/C][C]0.054384[/C][/ROW]
[ROW][C]2[/C][C]-0.037614[/C][C]-0.2606[/C][C]0.397759[/C][/ROW]
[ROW][C]3[/C][C]0.30846[/C][C]2.1371[/C][C]0.018858[/C][/ROW]
[ROW][C]4[/C][C]0.129916[/C][C]0.9001[/C][C]0.186285[/C][/ROW]
[ROW][C]5[/C][C]0.234351[/C][C]1.6236[/C][C]0.055502[/C][/ROW]
[ROW][C]6[/C][C]0.135092[/C][C]0.9359[/C][C]0.176993[/C][/ROW]
[ROW][C]7[/C][C]-0.06304[/C][C]-0.4368[/C][C]0.332124[/C][/ROW]
[ROW][C]8[/C][C]-0.099917[/C][C]-0.6922[/C][C]0.246059[/C][/ROW]
[ROW][C]9[/C][C]-0.276363[/C][C]-1.9147[/C][C]0.030751[/C][/ROW]
[ROW][C]10[/C][C]-0.006617[/C][C]-0.0458[/C][C]0.481812[/C][/ROW]
[ROW][C]11[/C][C]0.120476[/C][C]0.8347[/C][C]0.204016[/C][/ROW]
[ROW][C]12[/C][C]-0.12193[/C][C]-0.8448[/C][C]0.201219[/C][/ROW]
[ROW][C]13[/C][C]0.108495[/C][C]0.7517[/C][C]0.227957[/C][/ROW]
[ROW][C]14[/C][C]-0.064977[/C][C]-0.4502[/C][C]0.327307[/C][/ROW]
[ROW][C]15[/C][C]0.04619[/C][C]0.32[/C][C]0.375174[/C][/ROW]
[ROW][C]16[/C][C]-0.204[/C][C]-1.4134[/C][C]0.082002[/C][/ROW]
[ROW][C]17[/C][C]-0.076842[/C][C]-0.5324[/C][C]0.298461[/C][/ROW]
[ROW][C]18[/C][C]-0.053976[/C][C]-0.374[/C][C]0.355042[/C][/ROW]
[ROW][C]19[/C][C]0.087083[/C][C]0.6033[/C][C]0.274565[/C][/ROW]
[ROW][C]20[/C][C]-0.015185[/C][C]-0.1052[/C][C]0.458327[/C][/ROW]
[ROW][C]21[/C][C]-0.03308[/C][C]-0.2292[/C][C]0.409848[/C][/ROW]
[ROW][C]22[/C][C]-0.107135[/C][C]-0.7423[/C][C]0.230775[/C][/ROW]
[ROW][C]23[/C][C]0.031255[/C][C]0.2165[/C][C]0.414742[/C][/ROW]
[ROW][C]24[/C][C]-0.243549[/C][C]-1.6874[/C][C]0.049012[/C][/ROW]
[ROW][C]25[/C][C]-0.055154[/C][C]-0.3821[/C][C]0.35203[/C][/ROW]
[ROW][C]26[/C][C]0.189666[/C][C]1.314[/C][C]0.097539[/C][/ROW]
[ROW][C]27[/C][C]0.028446[/C][C]0.1971[/C][C]0.4223[/C][/ROW]
[ROW][C]28[/C][C]-0.119245[/C][C]-0.8262[/C][C]0.206401[/C][/ROW]
[ROW][C]29[/C][C]0.005116[/C][C]0.0354[/C][C]0.485937[/C][/ROW]
[ROW][C]30[/C][C]-0.009558[/C][C]-0.0662[/C][C]0.47374[/C][/ROW]
[ROW][C]31[/C][C]0.062018[/C][C]0.4297[/C][C]0.334679[/C][/ROW]
[ROW][C]32[/C][C]0.093268[/C][C]0.6462[/C][C]0.260621[/C][/ROW]
[ROW][C]33[/C][C]-0.064162[/C][C]-0.4445[/C][C]0.329329[/C][/ROW]
[ROW][C]34[/C][C]0.013773[/C][C]0.0954[/C][C]0.462188[/C][/ROW]
[ROW][C]35[/C][C]0.07625[/C][C]0.5283[/C][C]0.299871[/C][/ROW]
[ROW][C]36[/C][C]-0.048792[/C][C]-0.338[/C][C]0.368404[/C][/ROW]
[ROW][C]37[/C][C]0.01918[/C][C]0.1329[/C][C]0.44742[/C][/ROW]
[ROW][C]38[/C][C]-0.150696[/C][C]-1.0441[/C][C]0.150846[/C][/ROW]
[ROW][C]39[/C][C]-0.022434[/C][C]-0.1554[/C][C]0.438569[/C][/ROW]
[ROW][C]40[/C][C]-0.114246[/C][C]-0.7915[/C][C]0.216268[/C][/ROW]
[ROW][C]41[/C][C]-0.025511[/C][C]-0.1767[/C][C]0.430226[/C][/ROW]
[ROW][C]42[/C][C]-0.076575[/C][C]-0.5305[/C][C]0.299095[/C][/ROW]
[ROW][C]43[/C][C]-0.00434[/C][C]-0.0301[/C][C]0.488068[/C][/ROW]
[ROW][C]44[/C][C]0.065194[/C][C]0.4517[/C][C]0.326768[/C][/ROW]
[ROW][C]45[/C][C]-0.010736[/C][C]-0.0744[/C][C]0.470508[/C][/ROW]
[ROW][C]46[/C][C]0.062879[/C][C]0.4356[/C][C]0.332525[/C][/ROW]
[ROW][C]47[/C][C]0.004146[/C][C]0.0287[/C][C]0.488602[/C][/ROW]
[ROW][C]48[/C][C]NA[/C][C]NA[/C][C]NA[/C][/ROW]
[ROW][C]49[/C][C]NA[/C][C]NA[/C][C]NA[/C][/ROW]
[ROW][C]50[/C][C]NA[/C][C]NA[/C][C]NA[/C][/ROW]
[ROW][C]51[/C][C]NA[/C][C]NA[/C][C]NA[/C][/ROW]
[ROW][C]52[/C][C]NA[/C][C]NA[/C][C]NA[/C][/ROW]
[ROW][C]53[/C][C]NA[/C][C]NA[/C][C]NA[/C][/ROW]
[ROW][C]54[/C][C]NA[/C][C]NA[/C][C]NA[/C][/ROW]
[ROW][C]55[/C][C]NA[/C][C]NA[/C][C]NA[/C][/ROW]
[ROW][C]56[/C][C]NA[/C][C]NA[/C][C]NA[/C][/ROW]
[ROW][C]57[/C][C]NA[/C][C]NA[/C][C]NA[/C][/ROW]
[ROW][C]58[/C][C]NA[/C][C]NA[/C][C]NA[/C][/ROW]
[ROW][C]59[/C][C]NA[/C][C]NA[/C][C]NA[/C][/ROW]
[ROW][C]60[/C][C]NA[/C][C]NA[/C][C]NA[/C][/ROW]
[/TABLE]
Source: https://freestatistics.org/blog/index.php?pk=34608&T=2

Globally Unique Identifier (entire table): ba.freestatistics.org/blog/index.php?pk=34608&T=2

As an alternative you can also use a QR Code:  

The GUIDs for individual cells are displayed in the table below:

Partial Autocorrelation Function
Time lag kPACF(k)T-STATP-value
10.235871.63420.054384
2-0.037614-0.26060.397759
30.308462.13710.018858
40.1299160.90010.186285
50.2343511.62360.055502
60.1350920.93590.176993
7-0.06304-0.43680.332124
8-0.099917-0.69220.246059
9-0.276363-1.91470.030751
10-0.006617-0.04580.481812
110.1204760.83470.204016
12-0.12193-0.84480.201219
130.1084950.75170.227957
14-0.064977-0.45020.327307
150.046190.320.375174
16-0.204-1.41340.082002
17-0.076842-0.53240.298461
18-0.053976-0.3740.355042
190.0870830.60330.274565
20-0.015185-0.10520.458327
21-0.03308-0.22920.409848
22-0.107135-0.74230.230775
230.0312550.21650.414742
24-0.243549-1.68740.049012
25-0.055154-0.38210.35203
260.1896661.3140.097539
270.0284460.19710.4223
28-0.119245-0.82620.206401
290.0051160.03540.485937
30-0.009558-0.06620.47374
310.0620180.42970.334679
320.0932680.64620.260621
33-0.064162-0.44450.329329
340.0137730.09540.462188
350.076250.52830.299871
36-0.048792-0.3380.368404
370.019180.13290.44742
38-0.150696-1.04410.150846
39-0.022434-0.15540.438569
40-0.114246-0.79150.216268
41-0.025511-0.17670.430226
42-0.076575-0.53050.299095
43-0.00434-0.03010.488068
440.0651940.45170.326768
45-0.010736-0.07440.470508
460.0628790.43560.332525
470.0041460.02870.488602
48NANANA
49NANANA
50NANANA
51NANANA
52NANANA
53NANANA
54NANANA
55NANANA
56NANANA
57NANANA
58NANANA
59NANANA
60NANANA


Parameters (Session):
par1 = 60 ; par2 = 1 ; par3 = 0 ; par4 = 1 ; par5 = 12 ;
Parameters (R input):
par1 = 60 ; par2 = 1 ; par3 = 0 ; par4 = 1 ; par5 = 12 ;
R code (references can be found in the software module):
if (par1 == 'Default') {
par1 = 10*log10(length(x))
} else {
par1 <- as.numeric(par1)
}
par2 <- as.numeric(par2)
par3 <- as.numeric(par3)
par4 <- as.numeric(par4)
par5 <- as.numeric(par5)
if (par2 == 0) {
x <- log(x)
} else {
x <- (x ^ par2 - 1) / par2
}
if (par3 > 0) x <- diff(x,lag=1,difference=par3)
if (par4 > 0) x <- diff(x,lag=par5,difference=par4)
bitmap(file='pic1.png')
racf <- acf(x,par1,main='Autocorrelation',xlab='lags',ylab='ACF')
dev.off()
bitmap(file='pic2.png')
rpacf <- pacf(x,par1,main='Partial Autocorrelation',xlab='lags',ylab='PACF')
dev.off()
(myacf <- c(racf$acf))
(mypacf <- c(rpacf$acf))
lengthx <- length(x)
sqrtn <- sqrt(lengthx)
load(file='createtable')
a<-table.start()
a<-table.row.start(a)
a<-table.element(a,'Autocorrelation Function',4,TRUE)
a<-table.row.end(a)
a<-table.row.start(a)
a<-table.element(a,'Time lag k',header=TRUE)
a<-table.element(a,hyperlink('basics.htm','ACF(k)','click here for more information about the Autocorrelation Function'),header=TRUE)
a<-table.element(a,'T-STAT',header=TRUE)
a<-table.element(a,'P-value',header=TRUE)
a<-table.row.end(a)
for (i in 2:(par1+1)) {
a<-table.row.start(a)
a<-table.element(a,i-1,header=TRUE)
a<-table.element(a,round(myacf[i],6))
mytstat <- myacf[i]*sqrtn
a<-table.element(a,round(mytstat,4))
a<-table.element(a,round(1-pt(abs(mytstat),lengthx),6))
a<-table.row.end(a)
}
a<-table.end(a)
table.save(a,file='mytable.tab')
a<-table.start()
a<-table.row.start(a)
a<-table.element(a,'Partial Autocorrelation Function',4,TRUE)
a<-table.row.end(a)
a<-table.row.start(a)
a<-table.element(a,'Time lag k',header=TRUE)
a<-table.element(a,hyperlink('basics.htm','PACF(k)','click here for more information about the Partial Autocorrelation Function'),header=TRUE)
a<-table.element(a,'T-STAT',header=TRUE)
a<-table.element(a,'P-value',header=TRUE)
a<-table.row.end(a)
for (i in 1:par1) {
a<-table.row.start(a)
a<-table.element(a,i,header=TRUE)
a<-table.element(a,round(mypacf[i],6))
mytstat <- mypacf[i]*sqrtn
a<-table.element(a,round(mytstat,4))
a<-table.element(a,round(1-pt(abs(mytstat),lengthx),6))
a<-table.row.end(a)
}
a<-table.end(a)
table.save(a,file='mytable1.tab')