Free Statistics

of Irreproducible Research!

Author's title

Author*The author of this computation has been verified*
R Software Modulerwasp_autocorrelation.wasp
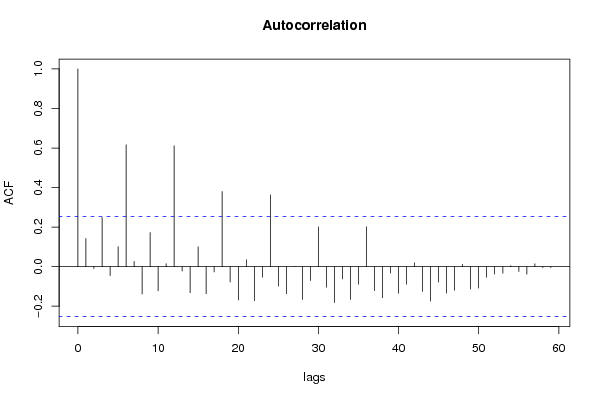
Title produced by software(Partial) Autocorrelation Function
Date of computationWed, 17 Dec 2008 22:39:55 -0700
Cite this page as followsStatistical Computations at FreeStatistics.org, Office for Research Development and Education, URL https://freestatistics.org/blog/index.php?v=date/2008/Dec/18/t12295789194ymw3yq8aa050bt.htm/, Retrieved Sat, 11 May 2024 05:24:33 +0000
Statistical Computations at FreeStatistics.org, Office for Research Development and Education, URL https://freestatistics.org/blog/index.php?pk=34607, Retrieved Sat, 11 May 2024 05:24:33 +0000
QR Codes:

Original text written by user:
IsPrivate?No (this computation is public)
User-defined keywords
Estimated Impact208
Family? (F = Feedback message, R = changed R code, M = changed R Module, P = changed Parameters, D = changed Data)
-       [(Partial) Autocorrelation Function] [paper: autocorrel...] [2008-12-18 05:39:55] [366411ff82333cf2a466cacd3525c11d] [Current]
Feedback Forum

Post a new message
Dataseries X:
101,3
91,5
152,6
86,6
86,6
98,5
86,7
89,1
111
92,6
85,1
116,1
98,3
97,7
177,9
94,2
83,8
109,5
102,3
102,5
162,7
85,3
88,2
104,7
99,4
113,8
166,6
89,2
93,2
115
97,2
112,5
121,8
100,2
93,8
113,6
110,7
127,6
185,9
105,9
108
125,2
106,2
123,3
145,2
114,3
108,4
120,9
126,3
141,3
208,2
131,6
119,8
122,5
137,6
141
154,1
127
106,1
129,9


Summary of computational transaction
Raw Inputview raw input (R code)
Raw Outputview raw output of R engine
Computing time1 seconds
R Server'Gwilym Jenkins' @ 72.249.127.135

\begin{tabular}{lllllllll}
\hline
Summary of computational transaction \tabularnewline
Raw Input & view raw input (R code)  \tabularnewline
Raw Output & view raw output of R engine  \tabularnewline
Computing time & 1 seconds \tabularnewline
R Server & 'Gwilym Jenkins' @ 72.249.127.135 \tabularnewline
\hline
\end{tabular}
%Source: https://freestatistics.org/blog/index.php?pk=34607&T=0

[TABLE]
[ROW][C]Summary of computational transaction[/C][/ROW]
[ROW][C]Raw Input[/C][C]view raw input (R code) [/C][/ROW]
[ROW][C]Raw Output[/C][C]view raw output of R engine [/C][/ROW]
[ROW][C]Computing time[/C][C]1 seconds[/C][/ROW]
[ROW][C]R Server[/C][C]'Gwilym Jenkins' @ 72.249.127.135[/C][/ROW]
[/TABLE]
Source: https://freestatistics.org/blog/index.php?pk=34607&T=0

Globally Unique Identifier (entire table): ba.freestatistics.org/blog/index.php?pk=34607&T=0

As an alternative you can also use a QR Code:  

The GUIDs for individual cells are displayed in the table below:

Summary of computational transaction
Raw Inputview raw input (R code)
Raw Outputview raw output of R engine
Computing time1 seconds
R Server'Gwilym Jenkins' @ 72.249.127.135


Autocorrelation Function
Time lag kACF(k)T-STATP-value
10.1420741.10050.137755
2-0.008901-0.06890.472631
30.2479581.92070.029764
4-0.04547-0.35220.362957
50.1010450.78270.218444
60.6160564.77196e-06
70.0264910.20520.419057
8-0.13798-1.06880.144724
90.172531.33640.09323
10-0.122451-0.94850.17334
110.0147880.11450.454594
120.6114224.73617e-06
13-0.022696-0.17580.430522
14-0.13194-1.0220.155441
150.1004320.77790.21983
16-0.136734-1.05910.14689
17-0.026694-0.20680.418445
180.3797452.94150.002318
19-0.077142-0.59750.276197
20-0.168334-1.30390.098623
210.0354270.27440.392353
22-0.172272-1.33440.093556
23-0.053373-0.41340.340385
240.3628522.81060.003334
25-0.098242-0.7610.224824
26-0.136929-1.06070.14655
270.0014390.01110.495572
28-0.165771-1.28410.10203
29-0.07061-0.54690.293223
300.2008591.55580.062502
31-0.103817-0.80420.212239
32-0.18153-1.40610.082422
33-0.062377-0.48320.315367
34-0.166058-1.28630.101644
35-0.089531-0.69350.245335
360.2017161.56250.061717
37-0.121665-0.94240.17488
38-0.157896-1.22310.113045
39-0.032567-0.25230.400849
40-0.135021-1.04590.149909
41-0.089726-0.6950.244865
420.0194450.15060.44039
43-0.12548-0.9720.167486
44-0.174131-1.34880.091233
45-0.078201-0.60570.273484
46-0.133569-1.03460.152499
47-0.119485-0.92550.179199
480.01160.08990.464352
49-0.113303-0.87760.191819
50-0.108478-0.84030.202047
51-0.053758-0.41640.339299
52-0.0373-0.28890.386818
53-0.033159-0.25680.399087
540.0046180.03580.485793
55-0.024197-0.18740.425979
56-0.038149-0.29550.384315
570.0141530.10960.456536
58-0.004826-0.03740.485153
59-0.004886-0.03780.484967
60NANANA

\begin{tabular}{lllllllll}
\hline
Autocorrelation Function \tabularnewline
Time lag k & ACF(k) & T-STAT & P-value \tabularnewline
1 & 0.142074 & 1.1005 & 0.137755 \tabularnewline
2 & -0.008901 & -0.0689 & 0.472631 \tabularnewline
3 & 0.247958 & 1.9207 & 0.029764 \tabularnewline
4 & -0.04547 & -0.3522 & 0.362957 \tabularnewline
5 & 0.101045 & 0.7827 & 0.218444 \tabularnewline
6 & 0.616056 & 4.7719 & 6e-06 \tabularnewline
7 & 0.026491 & 0.2052 & 0.419057 \tabularnewline
8 & -0.13798 & -1.0688 & 0.144724 \tabularnewline
9 & 0.17253 & 1.3364 & 0.09323 \tabularnewline
10 & -0.122451 & -0.9485 & 0.17334 \tabularnewline
11 & 0.014788 & 0.1145 & 0.454594 \tabularnewline
12 & 0.611422 & 4.7361 & 7e-06 \tabularnewline
13 & -0.022696 & -0.1758 & 0.430522 \tabularnewline
14 & -0.13194 & -1.022 & 0.155441 \tabularnewline
15 & 0.100432 & 0.7779 & 0.21983 \tabularnewline
16 & -0.136734 & -1.0591 & 0.14689 \tabularnewline
17 & -0.026694 & -0.2068 & 0.418445 \tabularnewline
18 & 0.379745 & 2.9415 & 0.002318 \tabularnewline
19 & -0.077142 & -0.5975 & 0.276197 \tabularnewline
20 & -0.168334 & -1.3039 & 0.098623 \tabularnewline
21 & 0.035427 & 0.2744 & 0.392353 \tabularnewline
22 & -0.172272 & -1.3344 & 0.093556 \tabularnewline
23 & -0.053373 & -0.4134 & 0.340385 \tabularnewline
24 & 0.362852 & 2.8106 & 0.003334 \tabularnewline
25 & -0.098242 & -0.761 & 0.224824 \tabularnewline
26 & -0.136929 & -1.0607 & 0.14655 \tabularnewline
27 & 0.001439 & 0.0111 & 0.495572 \tabularnewline
28 & -0.165771 & -1.2841 & 0.10203 \tabularnewline
29 & -0.07061 & -0.5469 & 0.293223 \tabularnewline
30 & 0.200859 & 1.5558 & 0.062502 \tabularnewline
31 & -0.103817 & -0.8042 & 0.212239 \tabularnewline
32 & -0.18153 & -1.4061 & 0.082422 \tabularnewline
33 & -0.062377 & -0.4832 & 0.315367 \tabularnewline
34 & -0.166058 & -1.2863 & 0.101644 \tabularnewline
35 & -0.089531 & -0.6935 & 0.245335 \tabularnewline
36 & 0.201716 & 1.5625 & 0.061717 \tabularnewline
37 & -0.121665 & -0.9424 & 0.17488 \tabularnewline
38 & -0.157896 & -1.2231 & 0.113045 \tabularnewline
39 & -0.032567 & -0.2523 & 0.400849 \tabularnewline
40 & -0.135021 & -1.0459 & 0.149909 \tabularnewline
41 & -0.089726 & -0.695 & 0.244865 \tabularnewline
42 & 0.019445 & 0.1506 & 0.44039 \tabularnewline
43 & -0.12548 & -0.972 & 0.167486 \tabularnewline
44 & -0.174131 & -1.3488 & 0.091233 \tabularnewline
45 & -0.078201 & -0.6057 & 0.273484 \tabularnewline
46 & -0.133569 & -1.0346 & 0.152499 \tabularnewline
47 & -0.119485 & -0.9255 & 0.179199 \tabularnewline
48 & 0.0116 & 0.0899 & 0.464352 \tabularnewline
49 & -0.113303 & -0.8776 & 0.191819 \tabularnewline
50 & -0.108478 & -0.8403 & 0.202047 \tabularnewline
51 & -0.053758 & -0.4164 & 0.339299 \tabularnewline
52 & -0.0373 & -0.2889 & 0.386818 \tabularnewline
53 & -0.033159 & -0.2568 & 0.399087 \tabularnewline
54 & 0.004618 & 0.0358 & 0.485793 \tabularnewline
55 & -0.024197 & -0.1874 & 0.425979 \tabularnewline
56 & -0.038149 & -0.2955 & 0.384315 \tabularnewline
57 & 0.014153 & 0.1096 & 0.456536 \tabularnewline
58 & -0.004826 & -0.0374 & 0.485153 \tabularnewline
59 & -0.004886 & -0.0378 & 0.484967 \tabularnewline
60 & NA & NA & NA \tabularnewline
\hline
\end{tabular}
%Source: https://freestatistics.org/blog/index.php?pk=34607&T=1

[TABLE]
[ROW][C]Autocorrelation Function[/C][/ROW]
[ROW][C]Time lag k[/C][C]ACF(k)[/C][C]T-STAT[/C][C]P-value[/C][/ROW]
[ROW][C]1[/C][C]0.142074[/C][C]1.1005[/C][C]0.137755[/C][/ROW]
[ROW][C]2[/C][C]-0.008901[/C][C]-0.0689[/C][C]0.472631[/C][/ROW]
[ROW][C]3[/C][C]0.247958[/C][C]1.9207[/C][C]0.029764[/C][/ROW]
[ROW][C]4[/C][C]-0.04547[/C][C]-0.3522[/C][C]0.362957[/C][/ROW]
[ROW][C]5[/C][C]0.101045[/C][C]0.7827[/C][C]0.218444[/C][/ROW]
[ROW][C]6[/C][C]0.616056[/C][C]4.7719[/C][C]6e-06[/C][/ROW]
[ROW][C]7[/C][C]0.026491[/C][C]0.2052[/C][C]0.419057[/C][/ROW]
[ROW][C]8[/C][C]-0.13798[/C][C]-1.0688[/C][C]0.144724[/C][/ROW]
[ROW][C]9[/C][C]0.17253[/C][C]1.3364[/C][C]0.09323[/C][/ROW]
[ROW][C]10[/C][C]-0.122451[/C][C]-0.9485[/C][C]0.17334[/C][/ROW]
[ROW][C]11[/C][C]0.014788[/C][C]0.1145[/C][C]0.454594[/C][/ROW]
[ROW][C]12[/C][C]0.611422[/C][C]4.7361[/C][C]7e-06[/C][/ROW]
[ROW][C]13[/C][C]-0.022696[/C][C]-0.1758[/C][C]0.430522[/C][/ROW]
[ROW][C]14[/C][C]-0.13194[/C][C]-1.022[/C][C]0.155441[/C][/ROW]
[ROW][C]15[/C][C]0.100432[/C][C]0.7779[/C][C]0.21983[/C][/ROW]
[ROW][C]16[/C][C]-0.136734[/C][C]-1.0591[/C][C]0.14689[/C][/ROW]
[ROW][C]17[/C][C]-0.026694[/C][C]-0.2068[/C][C]0.418445[/C][/ROW]
[ROW][C]18[/C][C]0.379745[/C][C]2.9415[/C][C]0.002318[/C][/ROW]
[ROW][C]19[/C][C]-0.077142[/C][C]-0.5975[/C][C]0.276197[/C][/ROW]
[ROW][C]20[/C][C]-0.168334[/C][C]-1.3039[/C][C]0.098623[/C][/ROW]
[ROW][C]21[/C][C]0.035427[/C][C]0.2744[/C][C]0.392353[/C][/ROW]
[ROW][C]22[/C][C]-0.172272[/C][C]-1.3344[/C][C]0.093556[/C][/ROW]
[ROW][C]23[/C][C]-0.053373[/C][C]-0.4134[/C][C]0.340385[/C][/ROW]
[ROW][C]24[/C][C]0.362852[/C][C]2.8106[/C][C]0.003334[/C][/ROW]
[ROW][C]25[/C][C]-0.098242[/C][C]-0.761[/C][C]0.224824[/C][/ROW]
[ROW][C]26[/C][C]-0.136929[/C][C]-1.0607[/C][C]0.14655[/C][/ROW]
[ROW][C]27[/C][C]0.001439[/C][C]0.0111[/C][C]0.495572[/C][/ROW]
[ROW][C]28[/C][C]-0.165771[/C][C]-1.2841[/C][C]0.10203[/C][/ROW]
[ROW][C]29[/C][C]-0.07061[/C][C]-0.5469[/C][C]0.293223[/C][/ROW]
[ROW][C]30[/C][C]0.200859[/C][C]1.5558[/C][C]0.062502[/C][/ROW]
[ROW][C]31[/C][C]-0.103817[/C][C]-0.8042[/C][C]0.212239[/C][/ROW]
[ROW][C]32[/C][C]-0.18153[/C][C]-1.4061[/C][C]0.082422[/C][/ROW]
[ROW][C]33[/C][C]-0.062377[/C][C]-0.4832[/C][C]0.315367[/C][/ROW]
[ROW][C]34[/C][C]-0.166058[/C][C]-1.2863[/C][C]0.101644[/C][/ROW]
[ROW][C]35[/C][C]-0.089531[/C][C]-0.6935[/C][C]0.245335[/C][/ROW]
[ROW][C]36[/C][C]0.201716[/C][C]1.5625[/C][C]0.061717[/C][/ROW]
[ROW][C]37[/C][C]-0.121665[/C][C]-0.9424[/C][C]0.17488[/C][/ROW]
[ROW][C]38[/C][C]-0.157896[/C][C]-1.2231[/C][C]0.113045[/C][/ROW]
[ROW][C]39[/C][C]-0.032567[/C][C]-0.2523[/C][C]0.400849[/C][/ROW]
[ROW][C]40[/C][C]-0.135021[/C][C]-1.0459[/C][C]0.149909[/C][/ROW]
[ROW][C]41[/C][C]-0.089726[/C][C]-0.695[/C][C]0.244865[/C][/ROW]
[ROW][C]42[/C][C]0.019445[/C][C]0.1506[/C][C]0.44039[/C][/ROW]
[ROW][C]43[/C][C]-0.12548[/C][C]-0.972[/C][C]0.167486[/C][/ROW]
[ROW][C]44[/C][C]-0.174131[/C][C]-1.3488[/C][C]0.091233[/C][/ROW]
[ROW][C]45[/C][C]-0.078201[/C][C]-0.6057[/C][C]0.273484[/C][/ROW]
[ROW][C]46[/C][C]-0.133569[/C][C]-1.0346[/C][C]0.152499[/C][/ROW]
[ROW][C]47[/C][C]-0.119485[/C][C]-0.9255[/C][C]0.179199[/C][/ROW]
[ROW][C]48[/C][C]0.0116[/C][C]0.0899[/C][C]0.464352[/C][/ROW]
[ROW][C]49[/C][C]-0.113303[/C][C]-0.8776[/C][C]0.191819[/C][/ROW]
[ROW][C]50[/C][C]-0.108478[/C][C]-0.8403[/C][C]0.202047[/C][/ROW]
[ROW][C]51[/C][C]-0.053758[/C][C]-0.4164[/C][C]0.339299[/C][/ROW]
[ROW][C]52[/C][C]-0.0373[/C][C]-0.2889[/C][C]0.386818[/C][/ROW]
[ROW][C]53[/C][C]-0.033159[/C][C]-0.2568[/C][C]0.399087[/C][/ROW]
[ROW][C]54[/C][C]0.004618[/C][C]0.0358[/C][C]0.485793[/C][/ROW]
[ROW][C]55[/C][C]-0.024197[/C][C]-0.1874[/C][C]0.425979[/C][/ROW]
[ROW][C]56[/C][C]-0.038149[/C][C]-0.2955[/C][C]0.384315[/C][/ROW]
[ROW][C]57[/C][C]0.014153[/C][C]0.1096[/C][C]0.456536[/C][/ROW]
[ROW][C]58[/C][C]-0.004826[/C][C]-0.0374[/C][C]0.485153[/C][/ROW]
[ROW][C]59[/C][C]-0.004886[/C][C]-0.0378[/C][C]0.484967[/C][/ROW]
[ROW][C]60[/C][C]NA[/C][C]NA[/C][C]NA[/C][/ROW]
[/TABLE]
Source: https://freestatistics.org/blog/index.php?pk=34607&T=1

Globally Unique Identifier (entire table): ba.freestatistics.org/blog/index.php?pk=34607&T=1

As an alternative you can also use a QR Code:  

The GUIDs for individual cells are displayed in the table below:

Autocorrelation Function
Time lag kACF(k)T-STATP-value
10.1420741.10050.137755
2-0.008901-0.06890.472631
30.2479581.92070.029764
4-0.04547-0.35220.362957
50.1010450.78270.218444
60.6160564.77196e-06
70.0264910.20520.419057
8-0.13798-1.06880.144724
90.172531.33640.09323
10-0.122451-0.94850.17334
110.0147880.11450.454594
120.6114224.73617e-06
13-0.022696-0.17580.430522
14-0.13194-1.0220.155441
150.1004320.77790.21983
16-0.136734-1.05910.14689
17-0.026694-0.20680.418445
180.3797452.94150.002318
19-0.077142-0.59750.276197
20-0.168334-1.30390.098623
210.0354270.27440.392353
22-0.172272-1.33440.093556
23-0.053373-0.41340.340385
240.3628522.81060.003334
25-0.098242-0.7610.224824
26-0.136929-1.06070.14655
270.0014390.01110.495572
28-0.165771-1.28410.10203
29-0.07061-0.54690.293223
300.2008591.55580.062502
31-0.103817-0.80420.212239
32-0.18153-1.40610.082422
33-0.062377-0.48320.315367
34-0.166058-1.28630.101644
35-0.089531-0.69350.245335
360.2017161.56250.061717
37-0.121665-0.94240.17488
38-0.157896-1.22310.113045
39-0.032567-0.25230.400849
40-0.135021-1.04590.149909
41-0.089726-0.6950.244865
420.0194450.15060.44039
43-0.12548-0.9720.167486
44-0.174131-1.34880.091233
45-0.078201-0.60570.273484
46-0.133569-1.03460.152499
47-0.119485-0.92550.179199
480.01160.08990.464352
49-0.113303-0.87760.191819
50-0.108478-0.84030.202047
51-0.053758-0.41640.339299
52-0.0373-0.28890.386818
53-0.033159-0.25680.399087
540.0046180.03580.485793
55-0.024197-0.18740.425979
56-0.038149-0.29550.384315
570.0141530.10960.456536
58-0.004826-0.03740.485153
59-0.004886-0.03780.484967
60NANANA


Partial Autocorrelation Function
Time lag kPACF(k)T-STATP-value
10.1420741.10050.137755
2-0.029685-0.22990.40946
30.2589282.00560.024705
4-0.132526-1.02650.154378
50.1670551.2940.100312
60.5635684.36542.5e-05
7-0.155293-1.20290.116871
8-0.219418-1.69960.047192
90.031370.2430.404421
10-0.077324-0.5990.27573
11-0.01574-0.12190.451684
120.4313063.34090.00072
13-0.116004-0.89860.186239
14-0.048852-0.37840.353233
15-0.137256-1.06320.14598
16-0.003832-0.02970.48821
17-0.080634-0.62460.267304
18-0.149469-1.15780.12577
190.0639710.49550.311023
200.1132790.87750.19187
21-0.123405-0.95590.171482
220.0342990.26570.395699
230.0352230.27280.392957
240.0093310.07230.471311
25-0.089256-0.69140.245998
260.0350510.27150.393468
27-0.017318-0.13410.446869
28-0.050839-0.39380.347565
29-0.067315-0.52140.301997
30-0.037832-0.2930.385249
310.0439170.34020.367454
32-0.111884-0.86660.194794
33-0.04354-0.33730.368549
340.1085610.84090.201868
35-0.059497-0.46090.323281
360.0033630.02610.489651
37-0.031543-0.24430.403904
38-0.038597-0.2990.382998
390.069280.53660.296751
40-0.069918-0.54160.295056
41-0.029147-0.22580.411072
42-0.226589-1.75520.042169
43-0.006005-0.04650.481528
440.062950.48760.313803
45-0.008758-0.06780.473071
46-0.028797-0.22310.412123
470.0143010.11080.456084
48-0.100952-0.7820.218653
490.0155180.12020.452362
500.0109310.08470.466401
51-0.02318-0.17960.429054
520.0874120.67710.250475
530.092540.71680.238135
540.1044480.80910.210841
55-0.012404-0.09610.461888
56-0.005338-0.04130.483578
570.0749110.58030.281957
58-0.096932-0.75080.227845
59-0.036321-0.28130.389709
60NANANA

\begin{tabular}{lllllllll}
\hline
Partial Autocorrelation Function \tabularnewline
Time lag k & PACF(k) & T-STAT & P-value \tabularnewline
1 & 0.142074 & 1.1005 & 0.137755 \tabularnewline
2 & -0.029685 & -0.2299 & 0.40946 \tabularnewline
3 & 0.258928 & 2.0056 & 0.024705 \tabularnewline
4 & -0.132526 & -1.0265 & 0.154378 \tabularnewline
5 & 0.167055 & 1.294 & 0.100312 \tabularnewline
6 & 0.563568 & 4.3654 & 2.5e-05 \tabularnewline
7 & -0.155293 & -1.2029 & 0.116871 \tabularnewline
8 & -0.219418 & -1.6996 & 0.047192 \tabularnewline
9 & 0.03137 & 0.243 & 0.404421 \tabularnewline
10 & -0.077324 & -0.599 & 0.27573 \tabularnewline
11 & -0.01574 & -0.1219 & 0.451684 \tabularnewline
12 & 0.431306 & 3.3409 & 0.00072 \tabularnewline
13 & -0.116004 & -0.8986 & 0.186239 \tabularnewline
14 & -0.048852 & -0.3784 & 0.353233 \tabularnewline
15 & -0.137256 & -1.0632 & 0.14598 \tabularnewline
16 & -0.003832 & -0.0297 & 0.48821 \tabularnewline
17 & -0.080634 & -0.6246 & 0.267304 \tabularnewline
18 & -0.149469 & -1.1578 & 0.12577 \tabularnewline
19 & 0.063971 & 0.4955 & 0.311023 \tabularnewline
20 & 0.113279 & 0.8775 & 0.19187 \tabularnewline
21 & -0.123405 & -0.9559 & 0.171482 \tabularnewline
22 & 0.034299 & 0.2657 & 0.395699 \tabularnewline
23 & 0.035223 & 0.2728 & 0.392957 \tabularnewline
24 & 0.009331 & 0.0723 & 0.471311 \tabularnewline
25 & -0.089256 & -0.6914 & 0.245998 \tabularnewline
26 & 0.035051 & 0.2715 & 0.393468 \tabularnewline
27 & -0.017318 & -0.1341 & 0.446869 \tabularnewline
28 & -0.050839 & -0.3938 & 0.347565 \tabularnewline
29 & -0.067315 & -0.5214 & 0.301997 \tabularnewline
30 & -0.037832 & -0.293 & 0.385249 \tabularnewline
31 & 0.043917 & 0.3402 & 0.367454 \tabularnewline
32 & -0.111884 & -0.8666 & 0.194794 \tabularnewline
33 & -0.04354 & -0.3373 & 0.368549 \tabularnewline
34 & 0.108561 & 0.8409 & 0.201868 \tabularnewline
35 & -0.059497 & -0.4609 & 0.323281 \tabularnewline
36 & 0.003363 & 0.0261 & 0.489651 \tabularnewline
37 & -0.031543 & -0.2443 & 0.403904 \tabularnewline
38 & -0.038597 & -0.299 & 0.382998 \tabularnewline
39 & 0.06928 & 0.5366 & 0.296751 \tabularnewline
40 & -0.069918 & -0.5416 & 0.295056 \tabularnewline
41 & -0.029147 & -0.2258 & 0.411072 \tabularnewline
42 & -0.226589 & -1.7552 & 0.042169 \tabularnewline
43 & -0.006005 & -0.0465 & 0.481528 \tabularnewline
44 & 0.06295 & 0.4876 & 0.313803 \tabularnewline
45 & -0.008758 & -0.0678 & 0.473071 \tabularnewline
46 & -0.028797 & -0.2231 & 0.412123 \tabularnewline
47 & 0.014301 & 0.1108 & 0.456084 \tabularnewline
48 & -0.100952 & -0.782 & 0.218653 \tabularnewline
49 & 0.015518 & 0.1202 & 0.452362 \tabularnewline
50 & 0.010931 & 0.0847 & 0.466401 \tabularnewline
51 & -0.02318 & -0.1796 & 0.429054 \tabularnewline
52 & 0.087412 & 0.6771 & 0.250475 \tabularnewline
53 & 0.09254 & 0.7168 & 0.238135 \tabularnewline
54 & 0.104448 & 0.8091 & 0.210841 \tabularnewline
55 & -0.012404 & -0.0961 & 0.461888 \tabularnewline
56 & -0.005338 & -0.0413 & 0.483578 \tabularnewline
57 & 0.074911 & 0.5803 & 0.281957 \tabularnewline
58 & -0.096932 & -0.7508 & 0.227845 \tabularnewline
59 & -0.036321 & -0.2813 & 0.389709 \tabularnewline
60 & NA & NA & NA \tabularnewline
\hline
\end{tabular}
%Source: https://freestatistics.org/blog/index.php?pk=34607&T=2

[TABLE]
[ROW][C]Partial Autocorrelation Function[/C][/ROW]
[ROW][C]Time lag k[/C][C]PACF(k)[/C][C]T-STAT[/C][C]P-value[/C][/ROW]
[ROW][C]1[/C][C]0.142074[/C][C]1.1005[/C][C]0.137755[/C][/ROW]
[ROW][C]2[/C][C]-0.029685[/C][C]-0.2299[/C][C]0.40946[/C][/ROW]
[ROW][C]3[/C][C]0.258928[/C][C]2.0056[/C][C]0.024705[/C][/ROW]
[ROW][C]4[/C][C]-0.132526[/C][C]-1.0265[/C][C]0.154378[/C][/ROW]
[ROW][C]5[/C][C]0.167055[/C][C]1.294[/C][C]0.100312[/C][/ROW]
[ROW][C]6[/C][C]0.563568[/C][C]4.3654[/C][C]2.5e-05[/C][/ROW]
[ROW][C]7[/C][C]-0.155293[/C][C]-1.2029[/C][C]0.116871[/C][/ROW]
[ROW][C]8[/C][C]-0.219418[/C][C]-1.6996[/C][C]0.047192[/C][/ROW]
[ROW][C]9[/C][C]0.03137[/C][C]0.243[/C][C]0.404421[/C][/ROW]
[ROW][C]10[/C][C]-0.077324[/C][C]-0.599[/C][C]0.27573[/C][/ROW]
[ROW][C]11[/C][C]-0.01574[/C][C]-0.1219[/C][C]0.451684[/C][/ROW]
[ROW][C]12[/C][C]0.431306[/C][C]3.3409[/C][C]0.00072[/C][/ROW]
[ROW][C]13[/C][C]-0.116004[/C][C]-0.8986[/C][C]0.186239[/C][/ROW]
[ROW][C]14[/C][C]-0.048852[/C][C]-0.3784[/C][C]0.353233[/C][/ROW]
[ROW][C]15[/C][C]-0.137256[/C][C]-1.0632[/C][C]0.14598[/C][/ROW]
[ROW][C]16[/C][C]-0.003832[/C][C]-0.0297[/C][C]0.48821[/C][/ROW]
[ROW][C]17[/C][C]-0.080634[/C][C]-0.6246[/C][C]0.267304[/C][/ROW]
[ROW][C]18[/C][C]-0.149469[/C][C]-1.1578[/C][C]0.12577[/C][/ROW]
[ROW][C]19[/C][C]0.063971[/C][C]0.4955[/C][C]0.311023[/C][/ROW]
[ROW][C]20[/C][C]0.113279[/C][C]0.8775[/C][C]0.19187[/C][/ROW]
[ROW][C]21[/C][C]-0.123405[/C][C]-0.9559[/C][C]0.171482[/C][/ROW]
[ROW][C]22[/C][C]0.034299[/C][C]0.2657[/C][C]0.395699[/C][/ROW]
[ROW][C]23[/C][C]0.035223[/C][C]0.2728[/C][C]0.392957[/C][/ROW]
[ROW][C]24[/C][C]0.009331[/C][C]0.0723[/C][C]0.471311[/C][/ROW]
[ROW][C]25[/C][C]-0.089256[/C][C]-0.6914[/C][C]0.245998[/C][/ROW]
[ROW][C]26[/C][C]0.035051[/C][C]0.2715[/C][C]0.393468[/C][/ROW]
[ROW][C]27[/C][C]-0.017318[/C][C]-0.1341[/C][C]0.446869[/C][/ROW]
[ROW][C]28[/C][C]-0.050839[/C][C]-0.3938[/C][C]0.347565[/C][/ROW]
[ROW][C]29[/C][C]-0.067315[/C][C]-0.5214[/C][C]0.301997[/C][/ROW]
[ROW][C]30[/C][C]-0.037832[/C][C]-0.293[/C][C]0.385249[/C][/ROW]
[ROW][C]31[/C][C]0.043917[/C][C]0.3402[/C][C]0.367454[/C][/ROW]
[ROW][C]32[/C][C]-0.111884[/C][C]-0.8666[/C][C]0.194794[/C][/ROW]
[ROW][C]33[/C][C]-0.04354[/C][C]-0.3373[/C][C]0.368549[/C][/ROW]
[ROW][C]34[/C][C]0.108561[/C][C]0.8409[/C][C]0.201868[/C][/ROW]
[ROW][C]35[/C][C]-0.059497[/C][C]-0.4609[/C][C]0.323281[/C][/ROW]
[ROW][C]36[/C][C]0.003363[/C][C]0.0261[/C][C]0.489651[/C][/ROW]
[ROW][C]37[/C][C]-0.031543[/C][C]-0.2443[/C][C]0.403904[/C][/ROW]
[ROW][C]38[/C][C]-0.038597[/C][C]-0.299[/C][C]0.382998[/C][/ROW]
[ROW][C]39[/C][C]0.06928[/C][C]0.5366[/C][C]0.296751[/C][/ROW]
[ROW][C]40[/C][C]-0.069918[/C][C]-0.5416[/C][C]0.295056[/C][/ROW]
[ROW][C]41[/C][C]-0.029147[/C][C]-0.2258[/C][C]0.411072[/C][/ROW]
[ROW][C]42[/C][C]-0.226589[/C][C]-1.7552[/C][C]0.042169[/C][/ROW]
[ROW][C]43[/C][C]-0.006005[/C][C]-0.0465[/C][C]0.481528[/C][/ROW]
[ROW][C]44[/C][C]0.06295[/C][C]0.4876[/C][C]0.313803[/C][/ROW]
[ROW][C]45[/C][C]-0.008758[/C][C]-0.0678[/C][C]0.473071[/C][/ROW]
[ROW][C]46[/C][C]-0.028797[/C][C]-0.2231[/C][C]0.412123[/C][/ROW]
[ROW][C]47[/C][C]0.014301[/C][C]0.1108[/C][C]0.456084[/C][/ROW]
[ROW][C]48[/C][C]-0.100952[/C][C]-0.782[/C][C]0.218653[/C][/ROW]
[ROW][C]49[/C][C]0.015518[/C][C]0.1202[/C][C]0.452362[/C][/ROW]
[ROW][C]50[/C][C]0.010931[/C][C]0.0847[/C][C]0.466401[/C][/ROW]
[ROW][C]51[/C][C]-0.02318[/C][C]-0.1796[/C][C]0.429054[/C][/ROW]
[ROW][C]52[/C][C]0.087412[/C][C]0.6771[/C][C]0.250475[/C][/ROW]
[ROW][C]53[/C][C]0.09254[/C][C]0.7168[/C][C]0.238135[/C][/ROW]
[ROW][C]54[/C][C]0.104448[/C][C]0.8091[/C][C]0.210841[/C][/ROW]
[ROW][C]55[/C][C]-0.012404[/C][C]-0.0961[/C][C]0.461888[/C][/ROW]
[ROW][C]56[/C][C]-0.005338[/C][C]-0.0413[/C][C]0.483578[/C][/ROW]
[ROW][C]57[/C][C]0.074911[/C][C]0.5803[/C][C]0.281957[/C][/ROW]
[ROW][C]58[/C][C]-0.096932[/C][C]-0.7508[/C][C]0.227845[/C][/ROW]
[ROW][C]59[/C][C]-0.036321[/C][C]-0.2813[/C][C]0.389709[/C][/ROW]
[ROW][C]60[/C][C]NA[/C][C]NA[/C][C]NA[/C][/ROW]
[/TABLE]
Source: https://freestatistics.org/blog/index.php?pk=34607&T=2

Globally Unique Identifier (entire table): ba.freestatistics.org/blog/index.php?pk=34607&T=2

As an alternative you can also use a QR Code:  

The GUIDs for individual cells are displayed in the table below:

Partial Autocorrelation Function
Time lag kPACF(k)T-STATP-value
10.1420741.10050.137755
2-0.029685-0.22990.40946
30.2589282.00560.024705
4-0.132526-1.02650.154378
50.1670551.2940.100312
60.5635684.36542.5e-05
7-0.155293-1.20290.116871
8-0.219418-1.69960.047192
90.031370.2430.404421
10-0.077324-0.5990.27573
11-0.01574-0.12190.451684
120.4313063.34090.00072
13-0.116004-0.89860.186239
14-0.048852-0.37840.353233
15-0.137256-1.06320.14598
16-0.003832-0.02970.48821
17-0.080634-0.62460.267304
18-0.149469-1.15780.12577
190.0639710.49550.311023
200.1132790.87750.19187
21-0.123405-0.95590.171482
220.0342990.26570.395699
230.0352230.27280.392957
240.0093310.07230.471311
25-0.089256-0.69140.245998
260.0350510.27150.393468
27-0.017318-0.13410.446869
28-0.050839-0.39380.347565
29-0.067315-0.52140.301997
30-0.037832-0.2930.385249
310.0439170.34020.367454
32-0.111884-0.86660.194794
33-0.04354-0.33730.368549
340.1085610.84090.201868
35-0.059497-0.46090.323281
360.0033630.02610.489651
37-0.031543-0.24430.403904
38-0.038597-0.2990.382998
390.069280.53660.296751
40-0.069918-0.54160.295056
41-0.029147-0.22580.411072
42-0.226589-1.75520.042169
43-0.006005-0.04650.481528
440.062950.48760.313803
45-0.008758-0.06780.473071
46-0.028797-0.22310.412123
470.0143010.11080.456084
48-0.100952-0.7820.218653
490.0155180.12020.452362
500.0109310.08470.466401
51-0.02318-0.17960.429054
520.0874120.67710.250475
530.092540.71680.238135
540.1044480.80910.210841
55-0.012404-0.09610.461888
56-0.005338-0.04130.483578
570.0749110.58030.281957
58-0.096932-0.75080.227845
59-0.036321-0.28130.389709
60NANANA


Parameters (Session):
par1 = 60 ; par2 = 1 ; par3 = 0 ; par4 = 0 ; par5 = 12 ;
Parameters (R input):
par1 = 60 ; par2 = 1 ; par3 = 0 ; par4 = 0 ; par5 = 12 ;
R code (references can be found in the software module):
if (par1 == 'Default') {
par1 = 10*log10(length(x))
} else {
par1 <- as.numeric(par1)
}
par2 <- as.numeric(par2)
par3 <- as.numeric(par3)
par4 <- as.numeric(par4)
par5 <- as.numeric(par5)
if (par2 == 0) {
x <- log(x)
} else {
x <- (x ^ par2 - 1) / par2
}
if (par3 > 0) x <- diff(x,lag=1,difference=par3)
if (par4 > 0) x <- diff(x,lag=par5,difference=par4)
bitmap(file='pic1.png')
racf <- acf(x,par1,main='Autocorrelation',xlab='lags',ylab='ACF')
dev.off()
bitmap(file='pic2.png')
rpacf <- pacf(x,par1,main='Partial Autocorrelation',xlab='lags',ylab='PACF')
dev.off()
(myacf <- c(racf$acf))
(mypacf <- c(rpacf$acf))
lengthx <- length(x)
sqrtn <- sqrt(lengthx)
load(file='createtable')
a<-table.start()
a<-table.row.start(a)
a<-table.element(a,'Autocorrelation Function',4,TRUE)
a<-table.row.end(a)
a<-table.row.start(a)
a<-table.element(a,'Time lag k',header=TRUE)
a<-table.element(a,hyperlink('basics.htm','ACF(k)','click here for more information about the Autocorrelation Function'),header=TRUE)
a<-table.element(a,'T-STAT',header=TRUE)
a<-table.element(a,'P-value',header=TRUE)
a<-table.row.end(a)
for (i in 2:(par1+1)) {
a<-table.row.start(a)
a<-table.element(a,i-1,header=TRUE)
a<-table.element(a,round(myacf[i],6))
mytstat <- myacf[i]*sqrtn
a<-table.element(a,round(mytstat,4))
a<-table.element(a,round(1-pt(abs(mytstat),lengthx),6))
a<-table.row.end(a)
}
a<-table.end(a)
table.save(a,file='mytable.tab')
a<-table.start()
a<-table.row.start(a)
a<-table.element(a,'Partial Autocorrelation Function',4,TRUE)
a<-table.row.end(a)
a<-table.row.start(a)
a<-table.element(a,'Time lag k',header=TRUE)
a<-table.element(a,hyperlink('basics.htm','PACF(k)','click here for more information about the Partial Autocorrelation Function'),header=TRUE)
a<-table.element(a,'T-STAT',header=TRUE)
a<-table.element(a,'P-value',header=TRUE)
a<-table.row.end(a)
for (i in 1:par1) {
a<-table.row.start(a)
a<-table.element(a,i,header=TRUE)
a<-table.element(a,round(mypacf[i],6))
mytstat <- mypacf[i]*sqrtn
a<-table.element(a,round(mytstat,4))
a<-table.element(a,round(1-pt(abs(mytstat),lengthx),6))
a<-table.row.end(a)
}
a<-table.end(a)
table.save(a,file='mytable1.tab')