Free Statistics

of Irreproducible Research!

Author's title

Author*The author of this computation has been verified*
R Software Modulerwasp_autocorrelation.wasp
Title produced by software(Partial) Autocorrelation Function
Date of computationTue, 16 Dec 2008 15:57:31 -0700
Cite this page as followsStatistical Computations at FreeStatistics.org, Office for Research Development and Education, URL https://freestatistics.org/blog/index.php?v=date/2008/Dec/16/t1229468312dvsixouxaddodht.htm/, Retrieved Wed, 15 May 2024 16:18:06 +0000
Statistical Computations at FreeStatistics.org, Office for Research Development and Education, URL https://freestatistics.org/blog/index.php?pk=34238, Retrieved Wed, 15 May 2024 16:18:06 +0000
QR Codes:

Original text written by user:
IsPrivate?No (this computation is public)
User-defined keywords
Estimated Impact224
Family? (F = Feedback message, R = changed R code, M = changed R Module, P = changed Parameters, D = changed Data)
F     [Univariate Data Series] [Airline data] [2007-10-18 09:58:47] [42daae401fd3def69a25014f2252b4c2]
F RMPD  [Standard Deviation-Mean Plot] [vraag 5] [2008-11-29 13:37:39] [c45c87b96bbf32ffc2144fc37d767b2e]
- RMPD    [(Partial) Autocorrelation Function] [ACF] [2008-12-12 14:03:24] [c45c87b96bbf32ffc2144fc37d767b2e]
-    D        [(Partial) Autocorrelation Function] [acf] [2008-12-16 22:57:31] [3dc594a6c62226e1e98766c4d385bfaa] [Current]
Feedback Forum

Post a new message
Dataseries X:
524
552
532
511
492
492
493
481
462
457
442
439
488
521
501
485
464
460
467
460
448
443
436
431
484
510
513
503
471
471
476
475
470
461
455
456
517
525
523
519
509
512
519
517
510
509
501
507
569
580
578
565
547
555
562
561
555
544
537
543
594
611
613
611
594
595
591
589
584
573
567
569
621
629
628
612
595
597
593
590
580
574
573
573
620
626
620
588
566
557
561
549
532
526
511
499
555
565
542
527
510
514
517
508
493
490
469
478


Summary of computational transaction
Raw Inputview raw input (R code)
Raw Outputview raw output of R engine
Computing time1 seconds
R Server'Gwilym Jenkins' @ 72.249.127.135

\begin{tabular}{lllllllll}
\hline
Summary of computational transaction \tabularnewline
Raw Input & view raw input (R code)  \tabularnewline
Raw Output & view raw output of R engine  \tabularnewline
Computing time & 1 seconds \tabularnewline
R Server & 'Gwilym Jenkins' @ 72.249.127.135 \tabularnewline
\hline
\end{tabular}
%Source: https://freestatistics.org/blog/index.php?pk=34238&T=0

[TABLE]
[ROW][C]Summary of computational transaction[/C][/ROW]
[ROW][C]Raw Input[/C][C]view raw input (R code) [/C][/ROW]
[ROW][C]Raw Output[/C][C]view raw output of R engine [/C][/ROW]
[ROW][C]Computing time[/C][C]1 seconds[/C][/ROW]
[ROW][C]R Server[/C][C]'Gwilym Jenkins' @ 72.249.127.135[/C][/ROW]
[/TABLE]
Source: https://freestatistics.org/blog/index.php?pk=34238&T=0

Globally Unique Identifier (entire table): ba.freestatistics.org/blog/index.php?pk=34238&T=0

As an alternative you can also use a QR Code:  

The GUIDs for individual cells are displayed in the table below:

Summary of computational transaction
Raw Inputview raw input (R code)
Raw Outputview raw output of R engine
Computing time1 seconds
R Server'Gwilym Jenkins' @ 72.249.127.135


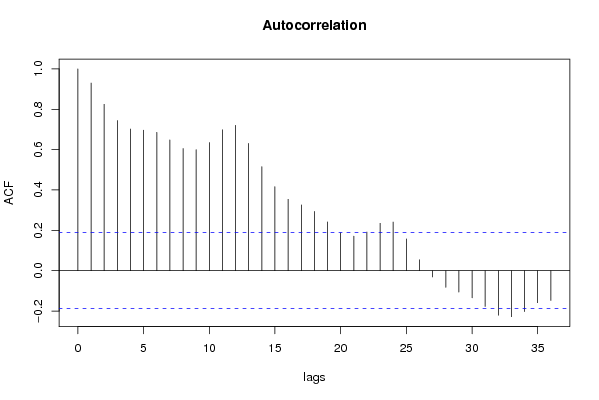
Autocorrelation Function
Time lag kACF(k)T-STATP-value
10.9300599.66550
20.8247128.57070
30.7441847.73380
40.7019637.2950
50.6966517.23980
60.6856027.1250
70.648076.73490
80.6052636.29010
90.5998116.23340
100.6350236.59940
110.6980757.25460
120.7202987.48560
130.6304786.55210
140.5155355.35760
150.4166574.331.7e-05
160.3538293.67710.000185
170.3261423.38940.000489
180.2938693.0540.001422
190.2419422.51430.0067
200.1878681.95240.02674
210.1709821.77690.0392
220.191681.9920.024448
230.2347022.43910.008177
240.2412112.50670.006837
250.1573961.63570.052406
260.0541950.56320.28723
27-0.031096-0.32320.373598
28-0.082244-0.85470.197304
29-0.105857-1.10010.136868
30-0.134269-1.39540.082884
31-0.177487-1.84450.033926
32-0.220631-2.29290.011896
33-0.227854-2.36790.009833
34-0.202795-2.10750.018694
35-0.158584-1.64810.051124
36-0.147741-1.53540.063809

\begin{tabular}{lllllllll}
\hline
Autocorrelation Function \tabularnewline
Time lag k & ACF(k) & T-STAT & P-value \tabularnewline
1 & 0.930059 & 9.6655 & 0 \tabularnewline
2 & 0.824712 & 8.5707 & 0 \tabularnewline
3 & 0.744184 & 7.7338 & 0 \tabularnewline
4 & 0.701963 & 7.295 & 0 \tabularnewline
5 & 0.696651 & 7.2398 & 0 \tabularnewline
6 & 0.685602 & 7.125 & 0 \tabularnewline
7 & 0.64807 & 6.7349 & 0 \tabularnewline
8 & 0.605263 & 6.2901 & 0 \tabularnewline
9 & 0.599811 & 6.2334 & 0 \tabularnewline
10 & 0.635023 & 6.5994 & 0 \tabularnewline
11 & 0.698075 & 7.2546 & 0 \tabularnewline
12 & 0.720298 & 7.4856 & 0 \tabularnewline
13 & 0.630478 & 6.5521 & 0 \tabularnewline
14 & 0.515535 & 5.3576 & 0 \tabularnewline
15 & 0.416657 & 4.33 & 1.7e-05 \tabularnewline
16 & 0.353829 & 3.6771 & 0.000185 \tabularnewline
17 & 0.326142 & 3.3894 & 0.000489 \tabularnewline
18 & 0.293869 & 3.054 & 0.001422 \tabularnewline
19 & 0.241942 & 2.5143 & 0.0067 \tabularnewline
20 & 0.187868 & 1.9524 & 0.02674 \tabularnewline
21 & 0.170982 & 1.7769 & 0.0392 \tabularnewline
22 & 0.19168 & 1.992 & 0.024448 \tabularnewline
23 & 0.234702 & 2.4391 & 0.008177 \tabularnewline
24 & 0.241211 & 2.5067 & 0.006837 \tabularnewline
25 & 0.157396 & 1.6357 & 0.052406 \tabularnewline
26 & 0.054195 & 0.5632 & 0.28723 \tabularnewline
27 & -0.031096 & -0.3232 & 0.373598 \tabularnewline
28 & -0.082244 & -0.8547 & 0.197304 \tabularnewline
29 & -0.105857 & -1.1001 & 0.136868 \tabularnewline
30 & -0.134269 & -1.3954 & 0.082884 \tabularnewline
31 & -0.177487 & -1.8445 & 0.033926 \tabularnewline
32 & -0.220631 & -2.2929 & 0.011896 \tabularnewline
33 & -0.227854 & -2.3679 & 0.009833 \tabularnewline
34 & -0.202795 & -2.1075 & 0.018694 \tabularnewline
35 & -0.158584 & -1.6481 & 0.051124 \tabularnewline
36 & -0.147741 & -1.5354 & 0.063809 \tabularnewline
\hline
\end{tabular}
%Source: https://freestatistics.org/blog/index.php?pk=34238&T=1

[TABLE]
[ROW][C]Autocorrelation Function[/C][/ROW]
[ROW][C]Time lag k[/C][C]ACF(k)[/C][C]T-STAT[/C][C]P-value[/C][/ROW]
[ROW][C]1[/C][C]0.930059[/C][C]9.6655[/C][C]0[/C][/ROW]
[ROW][C]2[/C][C]0.824712[/C][C]8.5707[/C][C]0[/C][/ROW]
[ROW][C]3[/C][C]0.744184[/C][C]7.7338[/C][C]0[/C][/ROW]
[ROW][C]4[/C][C]0.701963[/C][C]7.295[/C][C]0[/C][/ROW]
[ROW][C]5[/C][C]0.696651[/C][C]7.2398[/C][C]0[/C][/ROW]
[ROW][C]6[/C][C]0.685602[/C][C]7.125[/C][C]0[/C][/ROW]
[ROW][C]7[/C][C]0.64807[/C][C]6.7349[/C][C]0[/C][/ROW]
[ROW][C]8[/C][C]0.605263[/C][C]6.2901[/C][C]0[/C][/ROW]
[ROW][C]9[/C][C]0.599811[/C][C]6.2334[/C][C]0[/C][/ROW]
[ROW][C]10[/C][C]0.635023[/C][C]6.5994[/C][C]0[/C][/ROW]
[ROW][C]11[/C][C]0.698075[/C][C]7.2546[/C][C]0[/C][/ROW]
[ROW][C]12[/C][C]0.720298[/C][C]7.4856[/C][C]0[/C][/ROW]
[ROW][C]13[/C][C]0.630478[/C][C]6.5521[/C][C]0[/C][/ROW]
[ROW][C]14[/C][C]0.515535[/C][C]5.3576[/C][C]0[/C][/ROW]
[ROW][C]15[/C][C]0.416657[/C][C]4.33[/C][C]1.7e-05[/C][/ROW]
[ROW][C]16[/C][C]0.353829[/C][C]3.6771[/C][C]0.000185[/C][/ROW]
[ROW][C]17[/C][C]0.326142[/C][C]3.3894[/C][C]0.000489[/C][/ROW]
[ROW][C]18[/C][C]0.293869[/C][C]3.054[/C][C]0.001422[/C][/ROW]
[ROW][C]19[/C][C]0.241942[/C][C]2.5143[/C][C]0.0067[/C][/ROW]
[ROW][C]20[/C][C]0.187868[/C][C]1.9524[/C][C]0.02674[/C][/ROW]
[ROW][C]21[/C][C]0.170982[/C][C]1.7769[/C][C]0.0392[/C][/ROW]
[ROW][C]22[/C][C]0.19168[/C][C]1.992[/C][C]0.024448[/C][/ROW]
[ROW][C]23[/C][C]0.234702[/C][C]2.4391[/C][C]0.008177[/C][/ROW]
[ROW][C]24[/C][C]0.241211[/C][C]2.5067[/C][C]0.006837[/C][/ROW]
[ROW][C]25[/C][C]0.157396[/C][C]1.6357[/C][C]0.052406[/C][/ROW]
[ROW][C]26[/C][C]0.054195[/C][C]0.5632[/C][C]0.28723[/C][/ROW]
[ROW][C]27[/C][C]-0.031096[/C][C]-0.3232[/C][C]0.373598[/C][/ROW]
[ROW][C]28[/C][C]-0.082244[/C][C]-0.8547[/C][C]0.197304[/C][/ROW]
[ROW][C]29[/C][C]-0.105857[/C][C]-1.1001[/C][C]0.136868[/C][/ROW]
[ROW][C]30[/C][C]-0.134269[/C][C]-1.3954[/C][C]0.082884[/C][/ROW]
[ROW][C]31[/C][C]-0.177487[/C][C]-1.8445[/C][C]0.033926[/C][/ROW]
[ROW][C]32[/C][C]-0.220631[/C][C]-2.2929[/C][C]0.011896[/C][/ROW]
[ROW][C]33[/C][C]-0.227854[/C][C]-2.3679[/C][C]0.009833[/C][/ROW]
[ROW][C]34[/C][C]-0.202795[/C][C]-2.1075[/C][C]0.018694[/C][/ROW]
[ROW][C]35[/C][C]-0.158584[/C][C]-1.6481[/C][C]0.051124[/C][/ROW]
[ROW][C]36[/C][C]-0.147741[/C][C]-1.5354[/C][C]0.063809[/C][/ROW]
[/TABLE]
Source: https://freestatistics.org/blog/index.php?pk=34238&T=1

Globally Unique Identifier (entire table): ba.freestatistics.org/blog/index.php?pk=34238&T=1

As an alternative you can also use a QR Code:  

The GUIDs for individual cells are displayed in the table below:

Autocorrelation Function
Time lag kACF(k)T-STATP-value
10.9300599.66550
20.8247128.57070
30.7441847.73380
40.7019637.2950
50.6966517.23980
60.6856027.1250
70.648076.73490
80.6052636.29010
90.5998116.23340
100.6350236.59940
110.6980757.25460
120.7202987.48560
130.6304786.55210
140.5155355.35760
150.4166574.331.7e-05
160.3538293.67710.000185
170.3261423.38940.000489
180.2938693.0540.001422
190.2419422.51430.0067
200.1878681.95240.02674
210.1709821.77690.0392
220.191681.9920.024448
230.2347022.43910.008177
240.2412112.50670.006837
250.1573961.63570.052406
260.0541950.56320.28723
27-0.031096-0.32320.373598
28-0.082244-0.85470.197304
29-0.105857-1.10010.136868
30-0.134269-1.39540.082884
31-0.177487-1.84450.033926
32-0.220631-2.29290.011896
33-0.227854-2.36790.009833
34-0.202795-2.10750.018694
35-0.158584-1.64810.051124
36-0.147741-1.53540.063809


Partial Autocorrelation Function
Time lag kPACF(k)T-STATP-value
10.9300599.66550
2-0.298515-3.10230.001226
30.2099772.18220.015633
40.1412681.46810.072492
50.1908751.98360.024917
6-0.106636-1.10820.135121
7-0.058118-0.6040.273562
80.0788730.81970.207104
90.2893063.00660.001643
100.1518731.57830.05871
110.2343882.43580.008247
12-0.255704-2.65740.004535
13-0.698149-7.25540
140.0844540.87770.191036
15-0.166792-1.73340.042943
16-0.026987-0.28050.38983
17-0.046667-0.4850.314338
180.0169480.17610.430261
190.099351.03250.152078
20-0.007854-0.08160.46755
210.0275690.28650.387521
22-0.101848-1.05840.14611
23-0.098875-1.02750.153232
240.1010071.04970.1481
25-0.127886-1.3290.093319
260.0141140.14670.44183
270.150671.56580.060159
28-0.024817-0.25790.398483
29-0.032282-0.33550.368956
30-0.039694-0.41250.340391
31-0.0041-0.04260.483048
32-0.045094-0.46860.320138
33-0.049954-0.51910.302364
34-0.021468-0.22310.411938
350.0108610.11290.455173
360.01610.16730.433717

\begin{tabular}{lllllllll}
\hline
Partial Autocorrelation Function \tabularnewline
Time lag k & PACF(k) & T-STAT & P-value \tabularnewline
1 & 0.930059 & 9.6655 & 0 \tabularnewline
2 & -0.298515 & -3.1023 & 0.001226 \tabularnewline
3 & 0.209977 & 2.1822 & 0.015633 \tabularnewline
4 & 0.141268 & 1.4681 & 0.072492 \tabularnewline
5 & 0.190875 & 1.9836 & 0.024917 \tabularnewline
6 & -0.106636 & -1.1082 & 0.135121 \tabularnewline
7 & -0.058118 & -0.604 & 0.273562 \tabularnewline
8 & 0.078873 & 0.8197 & 0.207104 \tabularnewline
9 & 0.289306 & 3.0066 & 0.001643 \tabularnewline
10 & 0.151873 & 1.5783 & 0.05871 \tabularnewline
11 & 0.234388 & 2.4358 & 0.008247 \tabularnewline
12 & -0.255704 & -2.6574 & 0.004535 \tabularnewline
13 & -0.698149 & -7.2554 & 0 \tabularnewline
14 & 0.084454 & 0.8777 & 0.191036 \tabularnewline
15 & -0.166792 & -1.7334 & 0.042943 \tabularnewline
16 & -0.026987 & -0.2805 & 0.38983 \tabularnewline
17 & -0.046667 & -0.485 & 0.314338 \tabularnewline
18 & 0.016948 & 0.1761 & 0.430261 \tabularnewline
19 & 0.09935 & 1.0325 & 0.152078 \tabularnewline
20 & -0.007854 & -0.0816 & 0.46755 \tabularnewline
21 & 0.027569 & 0.2865 & 0.387521 \tabularnewline
22 & -0.101848 & -1.0584 & 0.14611 \tabularnewline
23 & -0.098875 & -1.0275 & 0.153232 \tabularnewline
24 & 0.101007 & 1.0497 & 0.1481 \tabularnewline
25 & -0.127886 & -1.329 & 0.093319 \tabularnewline
26 & 0.014114 & 0.1467 & 0.44183 \tabularnewline
27 & 0.15067 & 1.5658 & 0.060159 \tabularnewline
28 & -0.024817 & -0.2579 & 0.398483 \tabularnewline
29 & -0.032282 & -0.3355 & 0.368956 \tabularnewline
30 & -0.039694 & -0.4125 & 0.340391 \tabularnewline
31 & -0.0041 & -0.0426 & 0.483048 \tabularnewline
32 & -0.045094 & -0.4686 & 0.320138 \tabularnewline
33 & -0.049954 & -0.5191 & 0.302364 \tabularnewline
34 & -0.021468 & -0.2231 & 0.411938 \tabularnewline
35 & 0.010861 & 0.1129 & 0.455173 \tabularnewline
36 & 0.0161 & 0.1673 & 0.433717 \tabularnewline
\hline
\end{tabular}
%Source: https://freestatistics.org/blog/index.php?pk=34238&T=2

[TABLE]
[ROW][C]Partial Autocorrelation Function[/C][/ROW]
[ROW][C]Time lag k[/C][C]PACF(k)[/C][C]T-STAT[/C][C]P-value[/C][/ROW]
[ROW][C]1[/C][C]0.930059[/C][C]9.6655[/C][C]0[/C][/ROW]
[ROW][C]2[/C][C]-0.298515[/C][C]-3.1023[/C][C]0.001226[/C][/ROW]
[ROW][C]3[/C][C]0.209977[/C][C]2.1822[/C][C]0.015633[/C][/ROW]
[ROW][C]4[/C][C]0.141268[/C][C]1.4681[/C][C]0.072492[/C][/ROW]
[ROW][C]5[/C][C]0.190875[/C][C]1.9836[/C][C]0.024917[/C][/ROW]
[ROW][C]6[/C][C]-0.106636[/C][C]-1.1082[/C][C]0.135121[/C][/ROW]
[ROW][C]7[/C][C]-0.058118[/C][C]-0.604[/C][C]0.273562[/C][/ROW]
[ROW][C]8[/C][C]0.078873[/C][C]0.8197[/C][C]0.207104[/C][/ROW]
[ROW][C]9[/C][C]0.289306[/C][C]3.0066[/C][C]0.001643[/C][/ROW]
[ROW][C]10[/C][C]0.151873[/C][C]1.5783[/C][C]0.05871[/C][/ROW]
[ROW][C]11[/C][C]0.234388[/C][C]2.4358[/C][C]0.008247[/C][/ROW]
[ROW][C]12[/C][C]-0.255704[/C][C]-2.6574[/C][C]0.004535[/C][/ROW]
[ROW][C]13[/C][C]-0.698149[/C][C]-7.2554[/C][C]0[/C][/ROW]
[ROW][C]14[/C][C]0.084454[/C][C]0.8777[/C][C]0.191036[/C][/ROW]
[ROW][C]15[/C][C]-0.166792[/C][C]-1.7334[/C][C]0.042943[/C][/ROW]
[ROW][C]16[/C][C]-0.026987[/C][C]-0.2805[/C][C]0.38983[/C][/ROW]
[ROW][C]17[/C][C]-0.046667[/C][C]-0.485[/C][C]0.314338[/C][/ROW]
[ROW][C]18[/C][C]0.016948[/C][C]0.1761[/C][C]0.430261[/C][/ROW]
[ROW][C]19[/C][C]0.09935[/C][C]1.0325[/C][C]0.152078[/C][/ROW]
[ROW][C]20[/C][C]-0.007854[/C][C]-0.0816[/C][C]0.46755[/C][/ROW]
[ROW][C]21[/C][C]0.027569[/C][C]0.2865[/C][C]0.387521[/C][/ROW]
[ROW][C]22[/C][C]-0.101848[/C][C]-1.0584[/C][C]0.14611[/C][/ROW]
[ROW][C]23[/C][C]-0.098875[/C][C]-1.0275[/C][C]0.153232[/C][/ROW]
[ROW][C]24[/C][C]0.101007[/C][C]1.0497[/C][C]0.1481[/C][/ROW]
[ROW][C]25[/C][C]-0.127886[/C][C]-1.329[/C][C]0.093319[/C][/ROW]
[ROW][C]26[/C][C]0.014114[/C][C]0.1467[/C][C]0.44183[/C][/ROW]
[ROW][C]27[/C][C]0.15067[/C][C]1.5658[/C][C]0.060159[/C][/ROW]
[ROW][C]28[/C][C]-0.024817[/C][C]-0.2579[/C][C]0.398483[/C][/ROW]
[ROW][C]29[/C][C]-0.032282[/C][C]-0.3355[/C][C]0.368956[/C][/ROW]
[ROW][C]30[/C][C]-0.039694[/C][C]-0.4125[/C][C]0.340391[/C][/ROW]
[ROW][C]31[/C][C]-0.0041[/C][C]-0.0426[/C][C]0.483048[/C][/ROW]
[ROW][C]32[/C][C]-0.045094[/C][C]-0.4686[/C][C]0.320138[/C][/ROW]
[ROW][C]33[/C][C]-0.049954[/C][C]-0.5191[/C][C]0.302364[/C][/ROW]
[ROW][C]34[/C][C]-0.021468[/C][C]-0.2231[/C][C]0.411938[/C][/ROW]
[ROW][C]35[/C][C]0.010861[/C][C]0.1129[/C][C]0.455173[/C][/ROW]
[ROW][C]36[/C][C]0.0161[/C][C]0.1673[/C][C]0.433717[/C][/ROW]
[/TABLE]
Source: https://freestatistics.org/blog/index.php?pk=34238&T=2

Globally Unique Identifier (entire table): ba.freestatistics.org/blog/index.php?pk=34238&T=2

As an alternative you can also use a QR Code:  

The GUIDs for individual cells are displayed in the table below:

Partial Autocorrelation Function
Time lag kPACF(k)T-STATP-value
10.9300599.66550
2-0.298515-3.10230.001226
30.2099772.18220.015633
40.1412681.46810.072492
50.1908751.98360.024917
6-0.106636-1.10820.135121
7-0.058118-0.6040.273562
80.0788730.81970.207104
90.2893063.00660.001643
100.1518731.57830.05871
110.2343882.43580.008247
12-0.255704-2.65740.004535
13-0.698149-7.25540
140.0844540.87770.191036
15-0.166792-1.73340.042943
16-0.026987-0.28050.38983
17-0.046667-0.4850.314338
180.0169480.17610.430261
190.099351.03250.152078
20-0.007854-0.08160.46755
210.0275690.28650.387521
22-0.101848-1.05840.14611
23-0.098875-1.02750.153232
240.1010071.04970.1481
25-0.127886-1.3290.093319
260.0141140.14670.44183
270.150671.56580.060159
28-0.024817-0.25790.398483
29-0.032282-0.33550.368956
30-0.039694-0.41250.340391
31-0.0041-0.04260.483048
32-0.045094-0.46860.320138
33-0.049954-0.51910.302364
34-0.021468-0.22310.411938
350.0108610.11290.455173
360.01610.16730.433717


Parameters (Session):
par1 = 36 ; par2 = 1.0 ; par3 = 0 ; par4 = 0 ; par5 = 12 ;
Parameters (R input):
par1 = 36 ; par2 = 1.0 ; par3 = 0 ; par4 = 0 ; par5 = 12 ;
R code (references can be found in the software module):
if (par1 == 'Default') {
par1 = 10*log10(length(x))
} else {
par1 <- as.numeric(par1)
}
par2 <- as.numeric(par2)
par3 <- as.numeric(par3)
par4 <- as.numeric(par4)
par5 <- as.numeric(par5)
if (par2 == 0) {
x <- log(x)
} else {
x <- (x ^ par2 - 1) / par2
}
if (par3 > 0) x <- diff(x,lag=1,difference=par3)
if (par4 > 0) x <- diff(x,lag=par5,difference=par4)
bitmap(file='pic1.png')
racf <- acf(x,par1,main='Autocorrelation',xlab='lags',ylab='ACF')
dev.off()
bitmap(file='pic2.png')
rpacf <- pacf(x,par1,main='Partial Autocorrelation',xlab='lags',ylab='PACF')
dev.off()
(myacf <- c(racf$acf))
(mypacf <- c(rpacf$acf))
lengthx <- length(x)
sqrtn <- sqrt(lengthx)
load(file='createtable')
a<-table.start()
a<-table.row.start(a)
a<-table.element(a,'Autocorrelation Function',4,TRUE)
a<-table.row.end(a)
a<-table.row.start(a)
a<-table.element(a,'Time lag k',header=TRUE)
a<-table.element(a,hyperlink('basics.htm','ACF(k)','click here for more information about the Autocorrelation Function'),header=TRUE)
a<-table.element(a,'T-STAT',header=TRUE)
a<-table.element(a,'P-value',header=TRUE)
a<-table.row.end(a)
for (i in 2:(par1+1)) {
a<-table.row.start(a)
a<-table.element(a,i-1,header=TRUE)
a<-table.element(a,round(myacf[i],6))
mytstat <- myacf[i]*sqrtn
a<-table.element(a,round(mytstat,4))
a<-table.element(a,round(1-pt(abs(mytstat),lengthx),6))
a<-table.row.end(a)
}
a<-table.end(a)
table.save(a,file='mytable.tab')
a<-table.start()
a<-table.row.start(a)
a<-table.element(a,'Partial Autocorrelation Function',4,TRUE)
a<-table.row.end(a)
a<-table.row.start(a)
a<-table.element(a,'Time lag k',header=TRUE)
a<-table.element(a,hyperlink('basics.htm','PACF(k)','click here for more information about the Partial Autocorrelation Function'),header=TRUE)
a<-table.element(a,'T-STAT',header=TRUE)
a<-table.element(a,'P-value',header=TRUE)
a<-table.row.end(a)
for (i in 1:par1) {
a<-table.row.start(a)
a<-table.element(a,i,header=TRUE)
a<-table.element(a,round(mypacf[i],6))
mytstat <- mypacf[i]*sqrtn
a<-table.element(a,round(mytstat,4))
a<-table.element(a,round(1-pt(abs(mytstat),lengthx),6))
a<-table.row.end(a)
}
a<-table.end(a)
table.save(a,file='mytable1.tab')