Free Statistics

of Irreproducible Research!

Author's title

Author*Unverified author*
R Software Modulerwasp_arimaforecasting.wasp
Title produced by softwareARIMA Forecasting
Date of computationTue, 16 Dec 2008 15:48:01 -0700
Cite this page as followsStatistical Computations at FreeStatistics.org, Office for Research Development and Education, URL https://freestatistics.org/blog/index.php?v=date/2008/Dec/16/t1229468106u5f3unnffjp7e5a.htm/, Retrieved Thu, 16 May 2024 02:18:53 +0000
Statistical Computations at FreeStatistics.org, Office for Research Development and Education, URL https://freestatistics.org/blog/index.php?pk=34236, Retrieved Thu, 16 May 2024 02:18:53 +0000
QR Codes:

Original text written by user:
IsPrivate?No (this computation is public)
User-defined keywords
Estimated Impact188
Family? (F = Feedback message, R = changed R code, M = changed R Module, P = changed Parameters, D = changed Data)
F     [ARIMA Forecasting] [hfdst 21 arima fo...] [2008-12-15 08:32:33] [11edab5c4db3615abbf782b1c6e7cacf]
-   PD  [ARIMA Forecasting] [Gilliam Schoorel] [2008-12-15 20:58:10] [74be16979710d4c4e7c6647856088456]
-   PD    [ARIMA Forecasting] [Gilliam Schoorel ...] [2008-12-16 11:51:33] [74be16979710d4c4e7c6647856088456]
F             [ARIMA Forecasting] [] [2008-12-16 22:48:01] [d41d8cd98f00b204e9800998ecf8427e] [Current]
Feedback Forum
2008-12-18 12:26:17 [Loïque Verhasselt] [reply
Step 1: De student geeft overal de juiste output maar nergens een interpretatie of conclusie. Het was hier de bedoeling om de explosiviteit van de voorspelling te controleren. We zien duidelijk geen explosief gedrag wat duidt op 'brave' ARMA processen. De AR processen zijn stabiel en de MA invertibel.
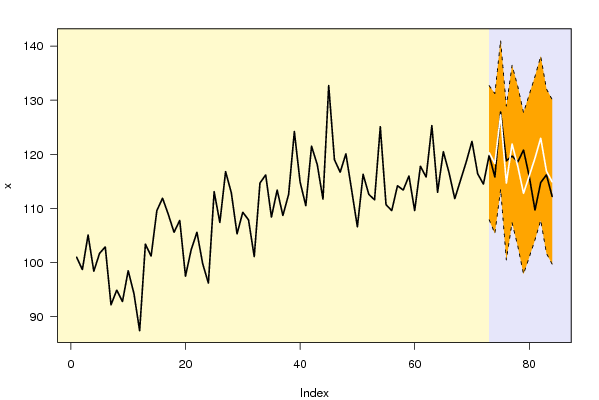
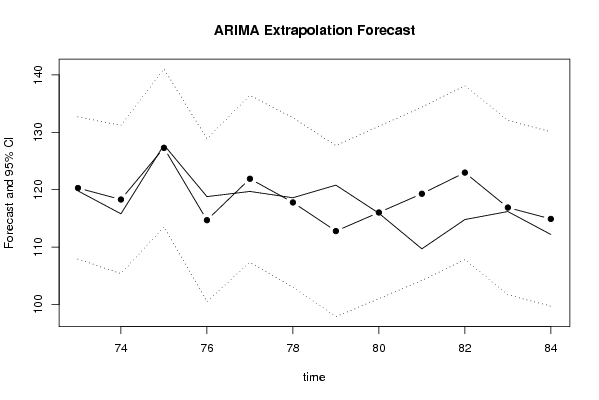
Step2: opnieuw alleen de output. We zien duidelijk dat de voorspelde waarde pieken bevat die de seizoenaliteit weerspiegelen van de werkelijke tijdreeks. In het gedeelte van de voorspelde waarde zien we een licht dalende trend. De werkelijke waarden stijgen eerst maar vertonen hierna ook een daldende trend. Dit zou eventueel kunnen wijzen op een business cyclus of economische trend. Chemische productie is duidelijk een industrieproduct dat zeker onder invloed is van de economische activiteit.
Step3: Weer alleen de tabel. De eerste tabel (SE) beschrijft de standaard fouten van de voorspelde waarde die stijgen over de maanden heen. Dit is normaal want hoe verder in de tijd voorspellen hoe meer risico's en hoe meer onzekerheid. De voorspellingsfout blijft als hoogste rond de 6 procent wat zeer goed is. De 2de kolom geeft de werkelijke fouten weer (PE). De rest van de kolommen is niet nodig in deze workshop. Het is de bedoeling dat de voorspelde waarden steeds groter zijn dan de PE in absolute waarde. Dit zien we ook in de tabel en dit komt overeen met de niet significante verschillen tussen de voorspelde waarde en de werkelijke waarden te zien aan de p value van de nulhypothese in de eerste tabel van de output.
Step4: Geen antwoord te vinden. Het was hier de bedoeling om de waarschijnlijkheden van de eerste tabel van de output te verklaren en aan te duiden met een voorbeeld uit de tijdreeks. Hier geef ik de algemene uitleg van de kansen.F[t] = forecast die wordt berekend volgens historiek, de meest waarschijnlijke waarde, gebaseerd op het verleden.
95%LB = 95% betrouwbaarheidsinterval lower bound = BI ondergrens
95%UB = 95% betrouwbaarheidsinterval upper bound = BI bovengrens
= 95% kans dat de volgende waarde gelegen is tussen de onder en bovengrens.We spreken hier wel van een ceteris paribus veronderstelling die wil zeggen dat dit alles wordt voorspeld onder gelijkblijvende omstandigheden.
p-value (H0: Y[t] = F[t]) = dit is de p –waarde van een bepaalde toets, namelijk de H0.De nulhypothese is hier dat onder ceteris paribus omstandigheden de voorspelde waarde gelijk is aan de werkelijke waarde. We gaan er dus van uit dat deze beide niet significant mogen verschillen van elkaar ! P -waarde moet GROTER zijn dan de vooropgestelde alpha -fout van 5%. De p-waarde moet groter zijn dan 0,05 (hoe groter, hoe beter zelfs), want dan is er geen significant verschil tussen de werkelijke waarden en de voorspelde waarden wat betekent dat de voorspelling goed zijn. P(F[t]>Y[t-1]) = dit is de waarschijnlijkheid/kans dat de voorspelde waarde groter is dan de vorige werkelijke waarde. Waarschijnlijkheid dat er een stijging is ten opzichte van vorige maand. Hier is dit 0,55. Dus de kans dat de voorspelde waarde groter is dan de werkelijke waarde een maand voordien is hier 0,55. Dus er is een kans op een stijging van 55 %
P(F[t]>Y[t-s]) = dit is de kans dat de voorspelde waarde groter is dan S aantal keer vorige werkelijke maand. De kans dat in deze maanden de waarde die ik ga krijgen groter is dan vorig jaar dezelfde maand. Waarschijnlijkheid dat er een stijging is ten opzichte van dezelfde maand in het vorige jaar (want s=12)
P(F[t]>Y[48]) = de kans dat de voorspelde waarde groter is dan de laatst gekende werkelijke waarde.
Step5: Opnieuw alleen maar een output van de eerste tabel. We zien duidelijk dat de voorspelde en de werkelijke waarde binnen het betrouwbaarheidsinterval liggen en dat de voorspelde waarde goed aansluit bij de werkelijke waarden. Dit konden we ook al vaststellen aan de hoge p-waarden van de nulhypothese. Geen significante verschillen tussen voorspelde en werkelijke waarde!
2008-12-23 17:07:04 [Glenn Maras] [reply
Step 1: Correcte berekening maar er is bij geen enkele vraag uitleg gegeven.

Step 2:De voorspellingen lopen in het begin samen maar vanaf de 4de maand niet meer. Er is niet echt een duidelijke trend merkbaar

Step 3:De standaardfout is nooit hoger dan 6%. Dat wijst op goede voorspellingen. Ook de reele fout is nooit echt groot. Er kan dus gezegd worden dat de voorspellingen vrij correct gebeuren.

Step 4:De waarden liggen steeds binnen het betrouwbaarheidsinterval van 95%. Dat is dus goed. We kunnen ook zeggen dat de p-waarde wel hoog is wat bij de forecast eigenlijk altijd hoger dan 5% moiet zijn dus dat is goed.

Step 5: Dit model kan wel gebruikt worden om betrouwbare voorspellingen te doen.

Post a new message
Dataseries X:
101.0
98.7
105.1
98.4
101.7
102.9
92.2
94.9
92.8
98.5
94.3
87.4
103.4
101.2
109.6
111.9
108.9
105.6
107.8
97.5
102.4
105.6
99.8
96.2
113.1
107.4
116.8
112.9
105.3
109.3
107.9
101.1
114.7
116.2
108.4
113.4
108.7
112.6
124.2
114.9
110.5
121.5
118.1
111.7
132.7
119.0
116.7
120.1
113.4
106.6
116.3
112.6
111.6
125.1
110.7
109.6
114.2
113.4
116.0
109.6
117.8
115.8
125.3
113.0
120.5
116.6
111.8
115.2
118.6
122.4
116.4
114.5
119.8
115.8
127.8
118.8
119.7
118.6
120.8
115.9
109.7
114.8
116.2
112.2


Summary of computational transaction
Raw Inputview raw input (R code)
Raw Outputview raw output of R engine
Computing time2 seconds
R Server'Sir Ronald Aylmer Fisher' @ 193.190.124.24

\begin{tabular}{lllllllll}
\hline
Summary of computational transaction \tabularnewline
Raw Input & view raw input (R code)  \tabularnewline
Raw Output & view raw output of R engine  \tabularnewline
Computing time & 2 seconds \tabularnewline
R Server & 'Sir Ronald Aylmer Fisher' @ 193.190.124.24 \tabularnewline
\hline
\end{tabular}
%Source: https://freestatistics.org/blog/index.php?pk=34236&T=0

[TABLE]
[ROW][C]Summary of computational transaction[/C][/ROW]
[ROW][C]Raw Input[/C][C]view raw input (R code) [/C][/ROW]
[ROW][C]Raw Output[/C][C]view raw output of R engine [/C][/ROW]
[ROW][C]Computing time[/C][C]2 seconds[/C][/ROW]
[ROW][C]R Server[/C][C]'Sir Ronald Aylmer Fisher' @ 193.190.124.24[/C][/ROW]
[/TABLE]
Source: https://freestatistics.org/blog/index.php?pk=34236&T=0

Globally Unique Identifier (entire table): ba.freestatistics.org/blog/index.php?pk=34236&T=0

As an alternative you can also use a QR Code:  

The GUIDs for individual cells are displayed in the table below:

Summary of computational transaction
Raw Inputview raw input (R code)
Raw Outputview raw output of R engine
Computing time2 seconds
R Server'Sir Ronald Aylmer Fisher' @ 193.190.124.24


Univariate ARIMA Extrapolation Forecast
timeY[t]F[t]95% LB95% UBp-value(H0: Y[t] = F[t])P(F[t]>Y[t-1])P(F[t]>Y[t-s])P(F[t]>Y[72])
60109.6-------
61117.8-------
62115.8-------
63125.3-------
64113-------
65120.5-------
66116.6-------
67111.8-------
68115.2-------
69118.6-------
70122.4-------
71116.4-------
72114.5-------
73119.8120.298107.9051132.69090.46860.82040.65360.8204
74115.8118.2936105.3766131.21070.35260.40960.64740.7176
75127.8127.2902113.5342141.04620.4710.94920.61160.9658
76118.8114.6927100.4868128.89860.28550.03530.59230.5106
77119.7121.9124107.3772136.44760.38270.66260.57550.8412
78118.6117.7852103.0277132.54280.45690.39960.56250.6687
79120.8112.792997.8802127.70560.14630.22270.55190.4112
80115.9116.0322101.0117131.05270.49310.26690.54320.5792
81109.7119.2974104.2016134.39320.10640.67040.53610.7333
82114.8122.9845107.836138.13290.14480.95720.53010.8638
83116.2116.8898101.7045132.07510.46450.60630.52520.6211
84112.2114.910599.6994130.12160.36340.4340.52110.5211

\begin{tabular}{lllllllll}
\hline
Univariate ARIMA Extrapolation Forecast \tabularnewline
time & Y[t] & F[t] & 95% LB & 95% UB & p-value(H0: Y[t] = F[t]) & P(F[t]>Y[t-1]) & P(F[t]>Y[t-s]) & P(F[t]>Y[72]) \tabularnewline
60 & 109.6 & - & - & - & - & - & - & - \tabularnewline
61 & 117.8 & - & - & - & - & - & - & - \tabularnewline
62 & 115.8 & - & - & - & - & - & - & - \tabularnewline
63 & 125.3 & - & - & - & - & - & - & - \tabularnewline
64 & 113 & - & - & - & - & - & - & - \tabularnewline
65 & 120.5 & - & - & - & - & - & - & - \tabularnewline
66 & 116.6 & - & - & - & - & - & - & - \tabularnewline
67 & 111.8 & - & - & - & - & - & - & - \tabularnewline
68 & 115.2 & - & - & - & - & - & - & - \tabularnewline
69 & 118.6 & - & - & - & - & - & - & - \tabularnewline
70 & 122.4 & - & - & - & - & - & - & - \tabularnewline
71 & 116.4 & - & - & - & - & - & - & - \tabularnewline
72 & 114.5 & - & - & - & - & - & - & - \tabularnewline
73 & 119.8 & 120.298 & 107.9051 & 132.6909 & 0.4686 & 0.8204 & 0.6536 & 0.8204 \tabularnewline
74 & 115.8 & 118.2936 & 105.3766 & 131.2107 & 0.3526 & 0.4096 & 0.6474 & 0.7176 \tabularnewline
75 & 127.8 & 127.2902 & 113.5342 & 141.0462 & 0.471 & 0.9492 & 0.6116 & 0.9658 \tabularnewline
76 & 118.8 & 114.6927 & 100.4868 & 128.8986 & 0.2855 & 0.0353 & 0.5923 & 0.5106 \tabularnewline
77 & 119.7 & 121.9124 & 107.3772 & 136.4476 & 0.3827 & 0.6626 & 0.5755 & 0.8412 \tabularnewline
78 & 118.6 & 117.7852 & 103.0277 & 132.5428 & 0.4569 & 0.3996 & 0.5625 & 0.6687 \tabularnewline
79 & 120.8 & 112.7929 & 97.8802 & 127.7056 & 0.1463 & 0.2227 & 0.5519 & 0.4112 \tabularnewline
80 & 115.9 & 116.0322 & 101.0117 & 131.0527 & 0.4931 & 0.2669 & 0.5432 & 0.5792 \tabularnewline
81 & 109.7 & 119.2974 & 104.2016 & 134.3932 & 0.1064 & 0.6704 & 0.5361 & 0.7333 \tabularnewline
82 & 114.8 & 122.9845 & 107.836 & 138.1329 & 0.1448 & 0.9572 & 0.5301 & 0.8638 \tabularnewline
83 & 116.2 & 116.8898 & 101.7045 & 132.0751 & 0.4645 & 0.6063 & 0.5252 & 0.6211 \tabularnewline
84 & 112.2 & 114.9105 & 99.6994 & 130.1216 & 0.3634 & 0.434 & 0.5211 & 0.5211 \tabularnewline
\hline
\end{tabular}
%Source: https://freestatistics.org/blog/index.php?pk=34236&T=1

[TABLE]
[ROW][C]Univariate ARIMA Extrapolation Forecast[/C][/ROW]
[ROW][C]time[/C][C]Y[t][/C][C]F[t][/C][C]95% LB[/C][C]95% UB[/C][C]p-value(H0: Y[t] = F[t])[/C][C]P(F[t]>Y[t-1])[/C][C]P(F[t]>Y[t-s])[/C][C]P(F[t]>Y[72])[/C][/ROW]
[ROW][C]60[/C][C]109.6[/C][C]-[/C][C]-[/C][C]-[/C][C]-[/C][C]-[/C][C]-[/C][C]-[/C][/ROW]
[ROW][C]61[/C][C]117.8[/C][C]-[/C][C]-[/C][C]-[/C][C]-[/C][C]-[/C][C]-[/C][C]-[/C][/ROW]
[ROW][C]62[/C][C]115.8[/C][C]-[/C][C]-[/C][C]-[/C][C]-[/C][C]-[/C][C]-[/C][C]-[/C][/ROW]
[ROW][C]63[/C][C]125.3[/C][C]-[/C][C]-[/C][C]-[/C][C]-[/C][C]-[/C][C]-[/C][C]-[/C][/ROW]
[ROW][C]64[/C][C]113[/C][C]-[/C][C]-[/C][C]-[/C][C]-[/C][C]-[/C][C]-[/C][C]-[/C][/ROW]
[ROW][C]65[/C][C]120.5[/C][C]-[/C][C]-[/C][C]-[/C][C]-[/C][C]-[/C][C]-[/C][C]-[/C][/ROW]
[ROW][C]66[/C][C]116.6[/C][C]-[/C][C]-[/C][C]-[/C][C]-[/C][C]-[/C][C]-[/C][C]-[/C][/ROW]
[ROW][C]67[/C][C]111.8[/C][C]-[/C][C]-[/C][C]-[/C][C]-[/C][C]-[/C][C]-[/C][C]-[/C][/ROW]
[ROW][C]68[/C][C]115.2[/C][C]-[/C][C]-[/C][C]-[/C][C]-[/C][C]-[/C][C]-[/C][C]-[/C][/ROW]
[ROW][C]69[/C][C]118.6[/C][C]-[/C][C]-[/C][C]-[/C][C]-[/C][C]-[/C][C]-[/C][C]-[/C][/ROW]
[ROW][C]70[/C][C]122.4[/C][C]-[/C][C]-[/C][C]-[/C][C]-[/C][C]-[/C][C]-[/C][C]-[/C][/ROW]
[ROW][C]71[/C][C]116.4[/C][C]-[/C][C]-[/C][C]-[/C][C]-[/C][C]-[/C][C]-[/C][C]-[/C][/ROW]
[ROW][C]72[/C][C]114.5[/C][C]-[/C][C]-[/C][C]-[/C][C]-[/C][C]-[/C][C]-[/C][C]-[/C][/ROW]
[ROW][C]73[/C][C]119.8[/C][C]120.298[/C][C]107.9051[/C][C]132.6909[/C][C]0.4686[/C][C]0.8204[/C][C]0.6536[/C][C]0.8204[/C][/ROW]
[ROW][C]74[/C][C]115.8[/C][C]118.2936[/C][C]105.3766[/C][C]131.2107[/C][C]0.3526[/C][C]0.4096[/C][C]0.6474[/C][C]0.7176[/C][/ROW]
[ROW][C]75[/C][C]127.8[/C][C]127.2902[/C][C]113.5342[/C][C]141.0462[/C][C]0.471[/C][C]0.9492[/C][C]0.6116[/C][C]0.9658[/C][/ROW]
[ROW][C]76[/C][C]118.8[/C][C]114.6927[/C][C]100.4868[/C][C]128.8986[/C][C]0.2855[/C][C]0.0353[/C][C]0.5923[/C][C]0.5106[/C][/ROW]
[ROW][C]77[/C][C]119.7[/C][C]121.9124[/C][C]107.3772[/C][C]136.4476[/C][C]0.3827[/C][C]0.6626[/C][C]0.5755[/C][C]0.8412[/C][/ROW]
[ROW][C]78[/C][C]118.6[/C][C]117.7852[/C][C]103.0277[/C][C]132.5428[/C][C]0.4569[/C][C]0.3996[/C][C]0.5625[/C][C]0.6687[/C][/ROW]
[ROW][C]79[/C][C]120.8[/C][C]112.7929[/C][C]97.8802[/C][C]127.7056[/C][C]0.1463[/C][C]0.2227[/C][C]0.5519[/C][C]0.4112[/C][/ROW]
[ROW][C]80[/C][C]115.9[/C][C]116.0322[/C][C]101.0117[/C][C]131.0527[/C][C]0.4931[/C][C]0.2669[/C][C]0.5432[/C][C]0.5792[/C][/ROW]
[ROW][C]81[/C][C]109.7[/C][C]119.2974[/C][C]104.2016[/C][C]134.3932[/C][C]0.1064[/C][C]0.6704[/C][C]0.5361[/C][C]0.7333[/C][/ROW]
[ROW][C]82[/C][C]114.8[/C][C]122.9845[/C][C]107.836[/C][C]138.1329[/C][C]0.1448[/C][C]0.9572[/C][C]0.5301[/C][C]0.8638[/C][/ROW]
[ROW][C]83[/C][C]116.2[/C][C]116.8898[/C][C]101.7045[/C][C]132.0751[/C][C]0.4645[/C][C]0.6063[/C][C]0.5252[/C][C]0.6211[/C][/ROW]
[ROW][C]84[/C][C]112.2[/C][C]114.9105[/C][C]99.6994[/C][C]130.1216[/C][C]0.3634[/C][C]0.434[/C][C]0.5211[/C][C]0.5211[/C][/ROW]
[/TABLE]
Source: https://freestatistics.org/blog/index.php?pk=34236&T=1

Globally Unique Identifier (entire table): ba.freestatistics.org/blog/index.php?pk=34236&T=1

As an alternative you can also use a QR Code:  

The GUIDs for individual cells are displayed in the table below:

Univariate ARIMA Extrapolation Forecast
timeY[t]F[t]95% LB95% UBp-value(H0: Y[t] = F[t])P(F[t]>Y[t-1])P(F[t]>Y[t-s])P(F[t]>Y[72])
60109.6-------
61117.8-------
62115.8-------
63125.3-------
64113-------
65120.5-------
66116.6-------
67111.8-------
68115.2-------
69118.6-------
70122.4-------
71116.4-------
72114.5-------
73119.8120.298107.9051132.69090.46860.82040.65360.8204
74115.8118.2936105.3766131.21070.35260.40960.64740.7176
75127.8127.2902113.5342141.04620.4710.94920.61160.9658
76118.8114.6927100.4868128.89860.28550.03530.59230.5106
77119.7121.9124107.3772136.44760.38270.66260.57550.8412
78118.6117.7852103.0277132.54280.45690.39960.56250.6687
79120.8112.792997.8802127.70560.14630.22270.55190.4112
80115.9116.0322101.0117131.05270.49310.26690.54320.5792
81109.7119.2974104.2016134.39320.10640.67040.53610.7333
82114.8122.9845107.836138.13290.14480.95720.53010.8638
83116.2116.8898101.7045132.07510.46450.60630.52520.6211
84112.2114.910599.6994130.12160.36340.4340.52110.5211


Univariate ARIMA Extrapolation Forecast Performance
time% S.E.PEMAPESq.EMSERMSE
730.0526-0.00413e-040.2480.02070.1438
740.0557-0.02110.00186.21830.51820.7199
750.05510.0043e-040.25990.02170.1472
760.06320.03580.00316.871.40581.1857
770.0608-0.01810.00154.89470.40790.6387
780.06390.00696e-040.66390.05530.2352
790.06750.0710.005964.1145.34282.3115
800.066-0.00111e-040.01750.00150.0382
810.0646-0.08040.006792.10997.67582.7705
820.0628-0.06650.005566.98535.58212.3626
830.0663-0.00595e-040.47580.03970.1991
840.0675-0.02360.0027.34670.61220.7824

\begin{tabular}{lllllllll}
\hline
Univariate ARIMA Extrapolation Forecast Performance \tabularnewline
time & % S.E. & PE & MAPE & Sq.E & MSE & RMSE \tabularnewline
73 & 0.0526 & -0.0041 & 3e-04 & 0.248 & 0.0207 & 0.1438 \tabularnewline
74 & 0.0557 & -0.0211 & 0.0018 & 6.2183 & 0.5182 & 0.7199 \tabularnewline
75 & 0.0551 & 0.004 & 3e-04 & 0.2599 & 0.0217 & 0.1472 \tabularnewline
76 & 0.0632 & 0.0358 & 0.003 & 16.87 & 1.4058 & 1.1857 \tabularnewline
77 & 0.0608 & -0.0181 & 0.0015 & 4.8947 & 0.4079 & 0.6387 \tabularnewline
78 & 0.0639 & 0.0069 & 6e-04 & 0.6639 & 0.0553 & 0.2352 \tabularnewline
79 & 0.0675 & 0.071 & 0.0059 & 64.114 & 5.3428 & 2.3115 \tabularnewline
80 & 0.066 & -0.0011 & 1e-04 & 0.0175 & 0.0015 & 0.0382 \tabularnewline
81 & 0.0646 & -0.0804 & 0.0067 & 92.1099 & 7.6758 & 2.7705 \tabularnewline
82 & 0.0628 & -0.0665 & 0.0055 & 66.9853 & 5.5821 & 2.3626 \tabularnewline
83 & 0.0663 & -0.0059 & 5e-04 & 0.4758 & 0.0397 & 0.1991 \tabularnewline
84 & 0.0675 & -0.0236 & 0.002 & 7.3467 & 0.6122 & 0.7824 \tabularnewline
\hline
\end{tabular}
%Source: https://freestatistics.org/blog/index.php?pk=34236&T=2

[TABLE]
[ROW][C]Univariate ARIMA Extrapolation Forecast Performance[/C][/ROW]
[ROW][C]time[/C][C]% S.E.[/C][C]PE[/C][C]MAPE[/C][C]Sq.E[/C][C]MSE[/C][C]RMSE[/C][/ROW]
[ROW][C]73[/C][C]0.0526[/C][C]-0.0041[/C][C]3e-04[/C][C]0.248[/C][C]0.0207[/C][C]0.1438[/C][/ROW]
[ROW][C]74[/C][C]0.0557[/C][C]-0.0211[/C][C]0.0018[/C][C]6.2183[/C][C]0.5182[/C][C]0.7199[/C][/ROW]
[ROW][C]75[/C][C]0.0551[/C][C]0.004[/C][C]3e-04[/C][C]0.2599[/C][C]0.0217[/C][C]0.1472[/C][/ROW]
[ROW][C]76[/C][C]0.0632[/C][C]0.0358[/C][C]0.003[/C][C]16.87[/C][C]1.4058[/C][C]1.1857[/C][/ROW]
[ROW][C]77[/C][C]0.0608[/C][C]-0.0181[/C][C]0.0015[/C][C]4.8947[/C][C]0.4079[/C][C]0.6387[/C][/ROW]
[ROW][C]78[/C][C]0.0639[/C][C]0.0069[/C][C]6e-04[/C][C]0.6639[/C][C]0.0553[/C][C]0.2352[/C][/ROW]
[ROW][C]79[/C][C]0.0675[/C][C]0.071[/C][C]0.0059[/C][C]64.114[/C][C]5.3428[/C][C]2.3115[/C][/ROW]
[ROW][C]80[/C][C]0.066[/C][C]-0.0011[/C][C]1e-04[/C][C]0.0175[/C][C]0.0015[/C][C]0.0382[/C][/ROW]
[ROW][C]81[/C][C]0.0646[/C][C]-0.0804[/C][C]0.0067[/C][C]92.1099[/C][C]7.6758[/C][C]2.7705[/C][/ROW]
[ROW][C]82[/C][C]0.0628[/C][C]-0.0665[/C][C]0.0055[/C][C]66.9853[/C][C]5.5821[/C][C]2.3626[/C][/ROW]
[ROW][C]83[/C][C]0.0663[/C][C]-0.0059[/C][C]5e-04[/C][C]0.4758[/C][C]0.0397[/C][C]0.1991[/C][/ROW]
[ROW][C]84[/C][C]0.0675[/C][C]-0.0236[/C][C]0.002[/C][C]7.3467[/C][C]0.6122[/C][C]0.7824[/C][/ROW]
[/TABLE]
Source: https://freestatistics.org/blog/index.php?pk=34236&T=2

Globally Unique Identifier (entire table): ba.freestatistics.org/blog/index.php?pk=34236&T=2

As an alternative you can also use a QR Code:  

The GUIDs for individual cells are displayed in the table below:

Univariate ARIMA Extrapolation Forecast Performance
time% S.E.PEMAPESq.EMSERMSE
730.0526-0.00413e-040.2480.02070.1438
740.0557-0.02110.00186.21830.51820.7199
750.05510.0043e-040.25990.02170.1472
760.06320.03580.00316.871.40581.1857
770.0608-0.01810.00154.89470.40790.6387
780.06390.00696e-040.66390.05530.2352
790.06750.0710.005964.1145.34282.3115
800.066-0.00111e-040.01750.00150.0382
810.0646-0.08040.006792.10997.67582.7705
820.0628-0.06650.005566.98535.58212.3626
830.0663-0.00595e-040.47580.03970.1991
840.0675-0.02360.0027.34670.61220.7824


Parameters (Session):
par1 = 12 ; par2 = 1 ; par3 = 0 ; par4 = 1 ; par5 = 12 ; par6 = 2 ; par7 = 1 ; par8 = 0 ; par9 = 0 ; par10 = FALSE ;
Parameters (R input):
par1 = 12 ; par2 = 1 ; par3 = 0 ; par4 = 1 ; par5 = 12 ; par6 = 2 ; par7 = 1 ; par8 = 0 ; par9 = 0 ; par10 = FALSE ;
R code (references can be found in the software module):
par1 <- as.numeric(par1) #cut off periods
par2 <- as.numeric(par2) #lambda
par3 <- as.numeric(par3) #degree of non-seasonal differencing
par4 <- as.numeric(par4) #degree of seasonal differencing
par5 <- as.numeric(par5) #seasonal period
par6 <- as.numeric(par6) #p
par7 <- as.numeric(par7) #q
par8 <- as.numeric(par8) #P
par9 <- as.numeric(par9) #Q
if (par10 == 'TRUE') par10 <- TRUE
if (par10 == 'FALSE') par10 <- FALSE
if (par2 == 0) x <- log(x)
if (par2 != 0) x <- x^par2
lx <- length(x)
first <- lx - 2*par1
nx <- lx - par1
nx1 <- nx + 1
fx <- lx - nx
if (fx < 1) {
fx <- par5
nx1 <- lx + fx - 1
first <- lx - 2*fx
}
first <- 1
if (fx < 3) fx <- round(lx/10,0)
(arima.out <- arima(x[1:nx], order=c(par6,par3,par7), seasonal=list(order=c(par8,par4,par9), period=par5), include.mean=par10, method='ML'))
(forecast <- predict(arima.out,fx))
(lb <- forecast$pred - 1.96 * forecast$se)
(ub <- forecast$pred + 1.96 * forecast$se)
if (par2 == 0) {
x <- exp(x)
forecast$pred <- exp(forecast$pred)
lb <- exp(lb)
ub <- exp(ub)
}
if (par2 != 0) {
x <- x^(1/par2)
forecast$pred <- forecast$pred^(1/par2)
lb <- lb^(1/par2)
ub <- ub^(1/par2)
}
if (par2 < 0) {
olb <- lb
lb <- ub
ub <- olb
}
(actandfor <- c(x[1:nx], forecast$pred))
(perc.se <- (ub-forecast$pred)/1.96/forecast$pred)
bitmap(file='test1.png')
opar <- par(mar=c(4,4,2,2),las=1)
ylim <- c( min(x[first:nx],lb), max(x[first:nx],ub))
plot(x,ylim=ylim,type='n',xlim=c(first,lx))
usr <- par('usr')
rect(usr[1],usr[3],nx+1,usr[4],border=NA,col='lemonchiffon')
rect(nx1,usr[3],usr[2],usr[4],border=NA,col='lavender')
abline(h= (-3:3)*2 , col ='gray', lty =3)
polygon( c(nx1:lx,lx:nx1), c(lb,rev(ub)), col = 'orange', lty=2,border=NA)
lines(nx1:lx, lb , lty=2)
lines(nx1:lx, ub , lty=2)
lines(x, lwd=2)
lines(nx1:lx, forecast$pred , lwd=2 , col ='white')
box()
par(opar)
dev.off()
prob.dec <- array(NA, dim=fx)
prob.sdec <- array(NA, dim=fx)
prob.ldec <- array(NA, dim=fx)
prob.pval <- array(NA, dim=fx)
perf.pe <- array(0, dim=fx)
perf.mape <- array(0, dim=fx)
perf.se <- array(0, dim=fx)
perf.mse <- array(0, dim=fx)
perf.rmse <- array(0, dim=fx)
for (i in 1:fx) {
locSD <- (ub[i] - forecast$pred[i]) / 1.96
perf.pe[i] = (x[nx+i] - forecast$pred[i]) / forecast$pred[i]
perf.mape[i] = perf.mape[i] + abs(perf.pe[i])
perf.se[i] = (x[nx+i] - forecast$pred[i])^2
perf.mse[i] = perf.mse[i] + perf.se[i]
prob.dec[i] = pnorm((x[nx+i-1] - forecast$pred[i]) / locSD)
prob.sdec[i] = pnorm((x[nx+i-par5] - forecast$pred[i]) / locSD)
prob.ldec[i] = pnorm((x[nx] - forecast$pred[i]) / locSD)
prob.pval[i] = pnorm(abs(x[nx+i] - forecast$pred[i]) / locSD)
}
perf.mape = perf.mape / fx
perf.mse = perf.mse / fx
perf.rmse = sqrt(perf.mse)
bitmap(file='test2.png')
plot(forecast$pred, pch=19, type='b',main='ARIMA Extrapolation Forecast', ylab='Forecast and 95% CI', xlab='time',ylim=c(min(lb),max(ub)))
dum <- forecast$pred
dum[1:12] <- x[(nx+1):lx]
lines(dum, lty=1)
lines(ub,lty=3)
lines(lb,lty=3)
dev.off()
load(file='createtable')
a<-table.start()
a<-table.row.start(a)
a<-table.element(a,'Univariate ARIMA Extrapolation Forecast',9,TRUE)
a<-table.row.end(a)
a<-table.row.start(a)
a<-table.element(a,'time',1,header=TRUE)
a<-table.element(a,'Y[t]',1,header=TRUE)
a<-table.element(a,'F[t]',1,header=TRUE)
a<-table.element(a,'95% LB',1,header=TRUE)
a<-table.element(a,'95% UB',1,header=TRUE)
a<-table.element(a,'p-value
(H0: Y[t] = F[t])',1,header=TRUE)
a<-table.element(a,'P(F[t]>Y[t-1])',1,header=TRUE)
a<-table.element(a,'P(F[t]>Y[t-s])',1,header=TRUE)
mylab <- paste('P(F[t]>Y[',nx,sep='')
mylab <- paste(mylab,'])',sep='')
a<-table.element(a,mylab,1,header=TRUE)
a<-table.row.end(a)
for (i in (nx-par5):nx) {
a<-table.row.start(a)
a<-table.element(a,i,header=TRUE)
a<-table.element(a,x[i])
a<-table.element(a,'-')
a<-table.row.end(a)
}
for (i in 1:fx) {
a<-table.row.start(a)
a<-table.element(a,nx+i,header=TRUE)
a<-table.element(a,round(x[nx+i],4))
a<-table.element(a,round(forecast$pred[i],4))
a<-table.element(a,round(lb[i],4))
a<-table.element(a,round(ub[i],4))
a<-table.element(a,round((1-prob.pval[i]),4))
a<-table.element(a,round((1-prob.dec[i]),4))
a<-table.element(a,round((1-prob.sdec[i]),4))
a<-table.element(a,round((1-prob.ldec[i]),4))
a<-table.row.end(a)
}
a<-table.end(a)
table.save(a,file='mytable.tab')
a<-table.start()
a<-table.row.start(a)
a<-table.element(a,'Univariate ARIMA Extrapolation Forecast Performance',7,TRUE)
a<-table.row.end(a)
a<-table.row.start(a)
a<-table.element(a,'time',1,header=TRUE)
a<-table.element(a,'% S.E.',1,header=TRUE)
a<-table.element(a,'PE',1,header=TRUE)
a<-table.element(a,'MAPE',1,header=TRUE)
a<-table.element(a,'Sq.E',1,header=TRUE)
a<-table.element(a,'MSE',1,header=TRUE)
a<-table.element(a,'RMSE',1,header=TRUE)
a<-table.row.end(a)
for (i in 1:fx) {
a<-table.row.start(a)
a<-table.element(a,nx+i,header=TRUE)
a<-table.element(a,round(perc.se[i],4))
a<-table.element(a,round(perf.pe[i],4))
a<-table.element(a,round(perf.mape[i],4))
a<-table.element(a,round(perf.se[i],4))
a<-table.element(a,round(perf.mse[i],4))
a<-table.element(a,round(perf.rmse[i],4))
a<-table.row.end(a)
}
a<-table.end(a)
table.save(a,file='mytable1.tab')