Free Statistics

of Irreproducible Research!

Author's title

Author*The author of this computation has been verified*
R Software Modulerwasp_smp.wasp
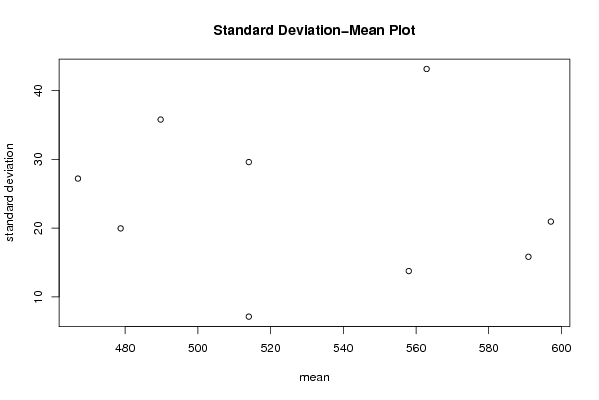
Title produced by softwareStandard Deviation-Mean Plot
Date of computationTue, 16 Dec 2008 15:50:10 -0700
Cite this page as followsStatistical Computations at FreeStatistics.org, Office for Research Development and Education, URL https://freestatistics.org/blog/index.php?v=date/2008/Dec/16/t1229468009lx8zswquinecttr.htm/, Retrieved Wed, 15 May 2024 00:29:25 +0000
Statistical Computations at FreeStatistics.org, Office for Research Development and Education, URL https://freestatistics.org/blog/index.php?pk=34235, Retrieved Wed, 15 May 2024 00:29:25 +0000
QR Codes:

Original text written by user:
IsPrivate?No (this computation is public)
User-defined keywords
Estimated Impact195
Family? (F = Feedback message, R = changed R code, M = changed R Module, P = changed Parameters, D = changed Data)
F     [Univariate Data Series] [Airline data] [2007-10-18 09:58:47] [42daae401fd3def69a25014f2252b4c2]
F RMPD  [Standard Deviation-Mean Plot] [vraag 5] [2008-11-29 13:37:39] [c45c87b96bbf32ffc2144fc37d767b2e]
-    D    [Standard Deviation-Mean Plot] [SDMP] [2008-12-12 13:39:34] [c45c87b96bbf32ffc2144fc37d767b2e]
-    D        [Standard Deviation-Mean Plot] [SDMP] [2008-12-16 22:50:10] [3dc594a6c62226e1e98766c4d385bfaa] [Current]
Feedback Forum

Post a new message
Dataseries X:
524
552
532
511
492
492
493
481
462
457
442
439
488
521
501
485
464
460
467
460
448
443
436
431
484
510
513
503
471
471
476
475
470
461
455
456
517
525
523
519
509
512
519
517
510
509
501
507
569
580
578
565
547
555
562
561
555
544
537
543
594
611
613
611
594
595
591
589
584
573
567
569
621
629
628
612
595
597
593
590
580
574
573
573
620
626
620
588
566
557
561
549
532
526
511
499
555
565
542
527
510
514
517
508
493
490
469
478


Summary of computational transaction
Raw Inputview raw input (R code)
Raw Outputview raw output of R engine
Computing time1 seconds
R Server'Gwilym Jenkins' @ 72.249.127.135

\begin{tabular}{lllllllll}
\hline
Summary of computational transaction \tabularnewline
Raw Input & view raw input (R code)  \tabularnewline
Raw Output & view raw output of R engine  \tabularnewline
Computing time & 1 seconds \tabularnewline
R Server & 'Gwilym Jenkins' @ 72.249.127.135 \tabularnewline
\hline
\end{tabular}
%Source: https://freestatistics.org/blog/index.php?pk=34235&T=0

[TABLE]
[ROW][C]Summary of computational transaction[/C][/ROW]
[ROW][C]Raw Input[/C][C]view raw input (R code) [/C][/ROW]
[ROW][C]Raw Output[/C][C]view raw output of R engine [/C][/ROW]
[ROW][C]Computing time[/C][C]1 seconds[/C][/ROW]
[ROW][C]R Server[/C][C]'Gwilym Jenkins' @ 72.249.127.135[/C][/ROW]
[/TABLE]
Source: https://freestatistics.org/blog/index.php?pk=34235&T=0

Globally Unique Identifier (entire table): ba.freestatistics.org/blog/index.php?pk=34235&T=0

As an alternative you can also use a QR Code:  

The GUIDs for individual cells are displayed in the table below:

Summary of computational transaction
Raw Inputview raw input (R code)
Raw Outputview raw output of R engine
Computing time1 seconds
R Server'Gwilym Jenkins' @ 72.249.127.135


Standard Deviation-Mean Plot
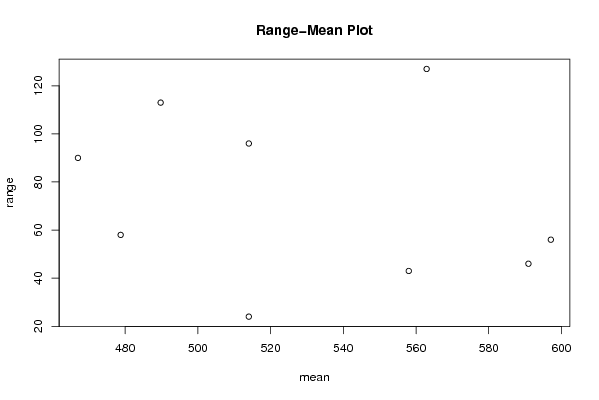
SectionMeanStandard DeviationRange
1489.7535.777405261879113
246727.199598927524390
3478.7519.95506315335958
45147.122308103927624
555813.751033019046643
6590.91666666666715.825516411699546
7597.08333333333320.943466472358156
8562.91666666666743.1350065246174127
951429.594225480964796

\begin{tabular}{lllllllll}
\hline
Standard Deviation-Mean Plot \tabularnewline
Section & Mean & Standard Deviation & Range \tabularnewline
1 & 489.75 & 35.777405261879 & 113 \tabularnewline
2 & 467 & 27.1995989275243 & 90 \tabularnewline
3 & 478.75 & 19.955063153359 & 58 \tabularnewline
4 & 514 & 7.1223081039276 & 24 \tabularnewline
5 & 558 & 13.7510330190466 & 43 \tabularnewline
6 & 590.916666666667 & 15.8255164116995 & 46 \tabularnewline
7 & 597.083333333333 & 20.9434664723581 & 56 \tabularnewline
8 & 562.916666666667 & 43.1350065246174 & 127 \tabularnewline
9 & 514 & 29.5942254809647 & 96 \tabularnewline
\hline
\end{tabular}
%Source: https://freestatistics.org/blog/index.php?pk=34235&T=1

[TABLE]
[ROW][C]Standard Deviation-Mean Plot[/C][/ROW]
[ROW][C]Section[/C][C]Mean[/C][C]Standard Deviation[/C][C]Range[/C][/ROW]
[ROW][C]1[/C][C]489.75[/C][C]35.777405261879[/C][C]113[/C][/ROW]
[ROW][C]2[/C][C]467[/C][C]27.1995989275243[/C][C]90[/C][/ROW]
[ROW][C]3[/C][C]478.75[/C][C]19.955063153359[/C][C]58[/C][/ROW]
[ROW][C]4[/C][C]514[/C][C]7.1223081039276[/C][C]24[/C][/ROW]
[ROW][C]5[/C][C]558[/C][C]13.7510330190466[/C][C]43[/C][/ROW]
[ROW][C]6[/C][C]590.916666666667[/C][C]15.8255164116995[/C][C]46[/C][/ROW]
[ROW][C]7[/C][C]597.083333333333[/C][C]20.9434664723581[/C][C]56[/C][/ROW]
[ROW][C]8[/C][C]562.916666666667[/C][C]43.1350065246174[/C][C]127[/C][/ROW]
[ROW][C]9[/C][C]514[/C][C]29.5942254809647[/C][C]96[/C][/ROW]
[/TABLE]
Source: https://freestatistics.org/blog/index.php?pk=34235&T=1

Globally Unique Identifier (entire table): ba.freestatistics.org/blog/index.php?pk=34235&T=1

As an alternative you can also use a QR Code:  

The GUIDs for individual cells are displayed in the table below:

Standard Deviation-Mean Plot
SectionMeanStandard DeviationRange
1489.7535.777405261879113
246727.199598927524390
3478.7519.95506315335958
45147.122308103927624
555813.751033019046643
6590.91666666666715.825516411699546
7597.08333333333320.943466472358156
8562.91666666666743.1350065246174127
951429.594225480964796


Regression: S.E.(k) = alpha + beta * Mean(k)
alpha41.9489397107215
beta-0.0344137667585152
S.D.0.0874077519676402
T-STAT-0.393715271058060
p-value0.705508720135903

\begin{tabular}{lllllllll}
\hline
Regression: S.E.(k) = alpha + beta * Mean(k) \tabularnewline
alpha & 41.9489397107215 \tabularnewline
beta & -0.0344137667585152 \tabularnewline
S.D. & 0.0874077519676402 \tabularnewline
T-STAT & -0.393715271058060 \tabularnewline
p-value & 0.705508720135903 \tabularnewline
\hline
\end{tabular}
%Source: https://freestatistics.org/blog/index.php?pk=34235&T=2

[TABLE]
[ROW][C]Regression: S.E.(k) = alpha + beta * Mean(k)[/C][/ROW]
[ROW][C]alpha[/C][C]41.9489397107215[/C][/ROW]
[ROW][C]beta[/C][C]-0.0344137667585152[/C][/ROW]
[ROW][C]S.D.[/C][C]0.0874077519676402[/C][/ROW]
[ROW][C]T-STAT[/C][C]-0.393715271058060[/C][/ROW]
[ROW][C]p-value[/C][C]0.705508720135903[/C][/ROW]
[/TABLE]
Source: https://freestatistics.org/blog/index.php?pk=34235&T=2

Globally Unique Identifier (entire table): ba.freestatistics.org/blog/index.php?pk=34235&T=2

As an alternative you can also use a QR Code:  

The GUIDs for individual cells are displayed in the table below:

Regression: S.E.(k) = alpha + beta * Mean(k)
alpha41.9489397107215
beta-0.0344137667585152
S.D.0.0874077519676402
T-STAT-0.393715271058060
p-value0.705508720135903


Regression: ln S.E.(k) = alpha + beta * ln Mean(k)
alpha8.35472243281065
beta-0.846735238000515
S.D.2.25287725602128
T-STAT-0.375846147737273
p-value0.718162478239541
Lambda1.84673523800052

\begin{tabular}{lllllllll}
\hline
Regression: ln S.E.(k) = alpha + beta * ln Mean(k) \tabularnewline
alpha & 8.35472243281065 \tabularnewline
beta & -0.846735238000515 \tabularnewline
S.D. & 2.25287725602128 \tabularnewline
T-STAT & -0.375846147737273 \tabularnewline
p-value & 0.718162478239541 \tabularnewline
Lambda & 1.84673523800052 \tabularnewline
\hline
\end{tabular}
%Source: https://freestatistics.org/blog/index.php?pk=34235&T=3

[TABLE]
[ROW][C]Regression: ln S.E.(k) = alpha + beta * ln Mean(k)[/C][/ROW]
[ROW][C]alpha[/C][C]8.35472243281065[/C][/ROW]
[ROW][C]beta[/C][C]-0.846735238000515[/C][/ROW]
[ROW][C]S.D.[/C][C]2.25287725602128[/C][/ROW]
[ROW][C]T-STAT[/C][C]-0.375846147737273[/C][/ROW]
[ROW][C]p-value[/C][C]0.718162478239541[/C][/ROW]
[ROW][C]Lambda[/C][C]1.84673523800052[/C][/ROW]
[/TABLE]
Source: https://freestatistics.org/blog/index.php?pk=34235&T=3

Globally Unique Identifier (entire table): ba.freestatistics.org/blog/index.php?pk=34235&T=3

As an alternative you can also use a QR Code:  

The GUIDs for individual cells are displayed in the table below:

Regression: ln S.E.(k) = alpha + beta * ln Mean(k)
alpha8.35472243281065
beta-0.846735238000515
S.D.2.25287725602128
T-STAT-0.375846147737273
p-value0.718162478239541
Lambda1.84673523800052


Parameters (Session):
par1 = 12 ;
Parameters (R input):
par1 = 12 ;
R code (references can be found in the software module):
par1 <- as.numeric(par1)
(n <- length(x))
(np <- floor(n / par1))
arr <- array(NA,dim=c(par1,np))
j <- 0
k <- 1
for (i in 1:(np*par1))
{
j = j + 1
arr[j,k] <- x[i]
if (j == par1) {
j = 0
k=k+1
}
}
arr
arr.mean <- array(NA,dim=np)
arr.sd <- array(NA,dim=np)
arr.range <- array(NA,dim=np)
for (j in 1:np)
{
arr.mean[j] <- mean(arr[,j],na.rm=TRUE)
arr.sd[j] <- sd(arr[,j],na.rm=TRUE)
arr.range[j] <- max(arr[,j],na.rm=TRUE) - min(arr[,j],na.rm=TRUE)
}
arr.mean
arr.sd
arr.range
(lm1 <- lm(arr.sd~arr.mean))
(lnlm1 <- lm(log(arr.sd)~log(arr.mean)))
(lm2 <- lm(arr.range~arr.mean))
bitmap(file='test1.png')
plot(arr.mean,arr.sd,main='Standard Deviation-Mean Plot',xlab='mean',ylab='standard deviation')
dev.off()
bitmap(file='test2.png')
plot(arr.mean,arr.range,main='Range-Mean Plot',xlab='mean',ylab='range')
dev.off()
load(file='createtable')
a<-table.start()
a<-table.row.start(a)
a<-table.element(a,'Standard Deviation-Mean Plot',4,TRUE)
a<-table.row.end(a)
a<-table.row.start(a)
a<-table.element(a,'Section',header=TRUE)
a<-table.element(a,'Mean',header=TRUE)
a<-table.element(a,'Standard Deviation',header=TRUE)
a<-table.element(a,'Range',header=TRUE)
a<-table.row.end(a)
for (j in 1:np) {
a<-table.row.start(a)
a<-table.element(a,j,header=TRUE)
a<-table.element(a,arr.mean[j])
a<-table.element(a,arr.sd[j] )
a<-table.element(a,arr.range[j] )
a<-table.row.end(a)
}
a<-table.end(a)
table.save(a,file='mytable.tab')
a<-table.start()
a<-table.row.start(a)
a<-table.element(a,'Regression: S.E.(k) = alpha + beta * Mean(k)',2,TRUE)
a<-table.row.end(a)
a<-table.row.start(a)
a<-table.element(a,'alpha',header=TRUE)
a<-table.element(a,lm1$coefficients[[1]])
a<-table.row.end(a)
a<-table.row.start(a)
a<-table.element(a,'beta',header=TRUE)
a<-table.element(a,lm1$coefficients[[2]])
a<-table.row.end(a)
a<-table.row.start(a)
a<-table.element(a,'S.D.',header=TRUE)
a<-table.element(a,summary(lm1)$coefficients[2,2])
a<-table.row.end(a)
a<-table.row.start(a)
a<-table.element(a,'T-STAT',header=TRUE)
a<-table.element(a,summary(lm1)$coefficients[2,3])
a<-table.row.end(a)
a<-table.row.start(a)
a<-table.element(a,'p-value',header=TRUE)
a<-table.element(a,summary(lm1)$coefficients[2,4])
a<-table.row.end(a)
a<-table.end(a)
table.save(a,file='mytable1.tab')
a<-table.start()
a<-table.row.start(a)
a<-table.element(a,'Regression: ln S.E.(k) = alpha + beta * ln Mean(k)',2,TRUE)
a<-table.row.end(a)
a<-table.row.start(a)
a<-table.element(a,'alpha',header=TRUE)
a<-table.element(a,lnlm1$coefficients[[1]])
a<-table.row.end(a)
a<-table.row.start(a)
a<-table.element(a,'beta',header=TRUE)
a<-table.element(a,lnlm1$coefficients[[2]])
a<-table.row.end(a)
a<-table.row.start(a)
a<-table.element(a,'S.D.',header=TRUE)
a<-table.element(a,summary(lnlm1)$coefficients[2,2])
a<-table.row.end(a)
a<-table.row.start(a)
a<-table.element(a,'T-STAT',header=TRUE)
a<-table.element(a,summary(lnlm1)$coefficients[2,3])
a<-table.row.end(a)
a<-table.row.start(a)
a<-table.element(a,'p-value',header=TRUE)
a<-table.element(a,summary(lnlm1)$coefficients[2,4])
a<-table.row.end(a)
a<-table.row.start(a)
a<-table.element(a,'Lambda',header=TRUE)
a<-table.element(a,1-lnlm1$coefficients[[2]])
a<-table.row.end(a)
a<-table.end(a)
table.save(a,file='mytable2.tab')