Free Statistics

of Irreproducible Research!

Author's title

(Partial) Autocorrelation Function voor differentiatie - Investeringsgoeder...

Author*Unverified author*
R Software Modulerwasp_autocorrelation.wasp
Title produced by software(Partial) Autocorrelation Function
Date of computationTue, 16 Dec 2008 15:39:37 -0700
Cite this page as followsStatistical Computations at FreeStatistics.org, Office for Research Development and Education, URL https://freestatistics.org/blog/index.php?v=date/2008/Dec/16/t1229467262l2hlia0ilu445kz.htm/, Retrieved Wed, 15 May 2024 00:40:10 +0000
Statistical Computations at FreeStatistics.org, Office for Research Development and Education, URL https://freestatistics.org/blog/index.php?pk=34233, Retrieved Wed, 15 May 2024 00:40:10 +0000
QR Codes:

Original text written by user:
IsPrivate?No (this computation is public)
User-defined keywords
Estimated Impact180
Family? (F = Feedback message, R = changed R code, M = changed R Module, P = changed Parameters, D = changed Data)
-       [(Partial) Autocorrelation Function] [(Partial) Autocor...] [2008-12-16 22:39:37] [d41d8cd98f00b204e9800998ecf8427e] [Current]
- RMPD    [Univariate Data Series] [Univariate Data S...] [2008-12-16 23:20:43] [74be16979710d4c4e7c6647856088456]
- RMPD    [Spectral Analysis] [Spectrale Analyse...] [2008-12-16 23:27:03] [74be16979710d4c4e7c6647856088456]
Feedback Forum

Post a new message
Dataseries X:
101,2
100,5
98
106,6
90,1
96,9
125,9
112
100
123,9
79,8
83,4
113,6
112,9
104
109,9
99
106,3
128,9
111,1
102,9
130
87
87,5
117,6
103,4
110,8
112,6
102,5
112,4
135,6
105,1
127,7
137
91
90,5
122,4
123,3
124,3
120
118,1
119
142,7
123,6
129,6
151,6
110,4
99,2
130,5
136,2
129,7
128
121,6
135,8
143,8
147,5
136,2
156,6
123,3
100,4


Summary of computational transaction
Raw Inputview raw input (R code)
Raw Outputview raw output of R engine
Computing time2 seconds
R Server'Sir Ronald Aylmer Fisher' @ 193.190.124.24

\begin{tabular}{lllllllll}
\hline
Summary of computational transaction \tabularnewline
Raw Input & view raw input (R code)  \tabularnewline
Raw Output & view raw output of R engine  \tabularnewline
Computing time & 2 seconds \tabularnewline
R Server & 'Sir Ronald Aylmer Fisher' @ 193.190.124.24 \tabularnewline
\hline
\end{tabular}
%Source: https://freestatistics.org/blog/index.php?pk=34233&T=0

[TABLE]
[ROW][C]Summary of computational transaction[/C][/ROW]
[ROW][C]Raw Input[/C][C]view raw input (R code) [/C][/ROW]
[ROW][C]Raw Output[/C][C]view raw output of R engine [/C][/ROW]
[ROW][C]Computing time[/C][C]2 seconds[/C][/ROW]
[ROW][C]R Server[/C][C]'Sir Ronald Aylmer Fisher' @ 193.190.124.24[/C][/ROW]
[/TABLE]
Source: https://freestatistics.org/blog/index.php?pk=34233&T=0

Globally Unique Identifier (entire table): ba.freestatistics.org/blog/index.php?pk=34233&T=0

As an alternative you can also use a QR Code:  

The GUIDs for individual cells are displayed in the table below:

Summary of computational transaction
Raw Inputview raw input (R code)
Raw Outputview raw output of R engine
Computing time2 seconds
R Server'Sir Ronald Aylmer Fisher' @ 193.190.124.24


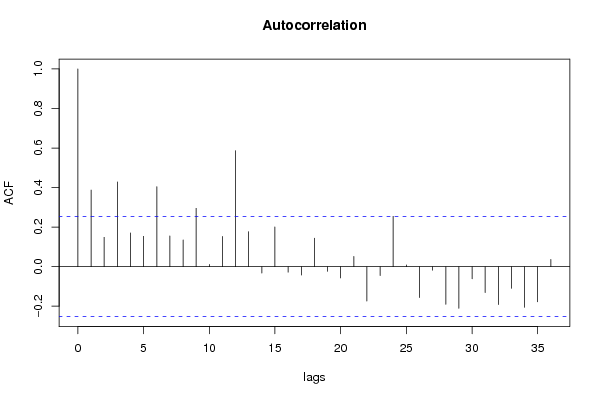
Autocorrelation Function
Time lag kACF(k)T-STATP-value
10.3870812.99830.001973
20.1480621.14690.127991
30.4285423.31950.000769
40.1701981.31830.096199
50.1530731.18570.120209
60.4043653.13220.001341
70.155231.20240.116966
80.1344771.04170.150875
90.2947662.28330.012986
100.0111330.08620.465783
110.1529281.18460.120428
120.5858854.53821.4e-05
130.1763151.36570.088561
14-0.032147-0.2490.402103
150.2005571.55350.062781
16-0.028045-0.21720.414381
17-0.042718-0.33090.370938
180.1433461.11040.135638
19-0.02309-0.17890.429327
20-0.056875-0.44060.33056
210.0512670.39710.346346
22-0.174034-1.34810.091353
23-0.045351-0.35130.363301
240.2544851.97120.026657
250.0085120.06590.473825
26-0.156773-1.21440.114684
27-0.017946-0.1390.444954
28-0.190782-1.47780.072347
29-0.210519-1.63070.054099
30-0.061753-0.47830.317075
31-0.130898-1.01390.157343
32-0.191611-1.48420.071493
33-0.109034-0.84460.200851
34-0.205828-1.59430.058057
35-0.177653-1.37610.086954
360.0364930.28270.389201

\begin{tabular}{lllllllll}
\hline
Autocorrelation Function \tabularnewline
Time lag k & ACF(k) & T-STAT & P-value \tabularnewline
1 & 0.387081 & 2.9983 & 0.001973 \tabularnewline
2 & 0.148062 & 1.1469 & 0.127991 \tabularnewline
3 & 0.428542 & 3.3195 & 0.000769 \tabularnewline
4 & 0.170198 & 1.3183 & 0.096199 \tabularnewline
5 & 0.153073 & 1.1857 & 0.120209 \tabularnewline
6 & 0.404365 & 3.1322 & 0.001341 \tabularnewline
7 & 0.15523 & 1.2024 & 0.116966 \tabularnewline
8 & 0.134477 & 1.0417 & 0.150875 \tabularnewline
9 & 0.294766 & 2.2833 & 0.012986 \tabularnewline
10 & 0.011133 & 0.0862 & 0.465783 \tabularnewline
11 & 0.152928 & 1.1846 & 0.120428 \tabularnewline
12 & 0.585885 & 4.5382 & 1.4e-05 \tabularnewline
13 & 0.176315 & 1.3657 & 0.088561 \tabularnewline
14 & -0.032147 & -0.249 & 0.402103 \tabularnewline
15 & 0.200557 & 1.5535 & 0.062781 \tabularnewline
16 & -0.028045 & -0.2172 & 0.414381 \tabularnewline
17 & -0.042718 & -0.3309 & 0.370938 \tabularnewline
18 & 0.143346 & 1.1104 & 0.135638 \tabularnewline
19 & -0.02309 & -0.1789 & 0.429327 \tabularnewline
20 & -0.056875 & -0.4406 & 0.33056 \tabularnewline
21 & 0.051267 & 0.3971 & 0.346346 \tabularnewline
22 & -0.174034 & -1.3481 & 0.091353 \tabularnewline
23 & -0.045351 & -0.3513 & 0.363301 \tabularnewline
24 & 0.254485 & 1.9712 & 0.026657 \tabularnewline
25 & 0.008512 & 0.0659 & 0.473825 \tabularnewline
26 & -0.156773 & -1.2144 & 0.114684 \tabularnewline
27 & -0.017946 & -0.139 & 0.444954 \tabularnewline
28 & -0.190782 & -1.4778 & 0.072347 \tabularnewline
29 & -0.210519 & -1.6307 & 0.054099 \tabularnewline
30 & -0.061753 & -0.4783 & 0.317075 \tabularnewline
31 & -0.130898 & -1.0139 & 0.157343 \tabularnewline
32 & -0.191611 & -1.4842 & 0.071493 \tabularnewline
33 & -0.109034 & -0.8446 & 0.200851 \tabularnewline
34 & -0.205828 & -1.5943 & 0.058057 \tabularnewline
35 & -0.177653 & -1.3761 & 0.086954 \tabularnewline
36 & 0.036493 & 0.2827 & 0.389201 \tabularnewline
\hline
\end{tabular}
%Source: https://freestatistics.org/blog/index.php?pk=34233&T=1

[TABLE]
[ROW][C]Autocorrelation Function[/C][/ROW]
[ROW][C]Time lag k[/C][C]ACF(k)[/C][C]T-STAT[/C][C]P-value[/C][/ROW]
[ROW][C]1[/C][C]0.387081[/C][C]2.9983[/C][C]0.001973[/C][/ROW]
[ROW][C]2[/C][C]0.148062[/C][C]1.1469[/C][C]0.127991[/C][/ROW]
[ROW][C]3[/C][C]0.428542[/C][C]3.3195[/C][C]0.000769[/C][/ROW]
[ROW][C]4[/C][C]0.170198[/C][C]1.3183[/C][C]0.096199[/C][/ROW]
[ROW][C]5[/C][C]0.153073[/C][C]1.1857[/C][C]0.120209[/C][/ROW]
[ROW][C]6[/C][C]0.404365[/C][C]3.1322[/C][C]0.001341[/C][/ROW]
[ROW][C]7[/C][C]0.15523[/C][C]1.2024[/C][C]0.116966[/C][/ROW]
[ROW][C]8[/C][C]0.134477[/C][C]1.0417[/C][C]0.150875[/C][/ROW]
[ROW][C]9[/C][C]0.294766[/C][C]2.2833[/C][C]0.012986[/C][/ROW]
[ROW][C]10[/C][C]0.011133[/C][C]0.0862[/C][C]0.465783[/C][/ROW]
[ROW][C]11[/C][C]0.152928[/C][C]1.1846[/C][C]0.120428[/C][/ROW]
[ROW][C]12[/C][C]0.585885[/C][C]4.5382[/C][C]1.4e-05[/C][/ROW]
[ROW][C]13[/C][C]0.176315[/C][C]1.3657[/C][C]0.088561[/C][/ROW]
[ROW][C]14[/C][C]-0.032147[/C][C]-0.249[/C][C]0.402103[/C][/ROW]
[ROW][C]15[/C][C]0.200557[/C][C]1.5535[/C][C]0.062781[/C][/ROW]
[ROW][C]16[/C][C]-0.028045[/C][C]-0.2172[/C][C]0.414381[/C][/ROW]
[ROW][C]17[/C][C]-0.042718[/C][C]-0.3309[/C][C]0.370938[/C][/ROW]
[ROW][C]18[/C][C]0.143346[/C][C]1.1104[/C][C]0.135638[/C][/ROW]
[ROW][C]19[/C][C]-0.02309[/C][C]-0.1789[/C][C]0.429327[/C][/ROW]
[ROW][C]20[/C][C]-0.056875[/C][C]-0.4406[/C][C]0.33056[/C][/ROW]
[ROW][C]21[/C][C]0.051267[/C][C]0.3971[/C][C]0.346346[/C][/ROW]
[ROW][C]22[/C][C]-0.174034[/C][C]-1.3481[/C][C]0.091353[/C][/ROW]
[ROW][C]23[/C][C]-0.045351[/C][C]-0.3513[/C][C]0.363301[/C][/ROW]
[ROW][C]24[/C][C]0.254485[/C][C]1.9712[/C][C]0.026657[/C][/ROW]
[ROW][C]25[/C][C]0.008512[/C][C]0.0659[/C][C]0.473825[/C][/ROW]
[ROW][C]26[/C][C]-0.156773[/C][C]-1.2144[/C][C]0.114684[/C][/ROW]
[ROW][C]27[/C][C]-0.017946[/C][C]-0.139[/C][C]0.444954[/C][/ROW]
[ROW][C]28[/C][C]-0.190782[/C][C]-1.4778[/C][C]0.072347[/C][/ROW]
[ROW][C]29[/C][C]-0.210519[/C][C]-1.6307[/C][C]0.054099[/C][/ROW]
[ROW][C]30[/C][C]-0.061753[/C][C]-0.4783[/C][C]0.317075[/C][/ROW]
[ROW][C]31[/C][C]-0.130898[/C][C]-1.0139[/C][C]0.157343[/C][/ROW]
[ROW][C]32[/C][C]-0.191611[/C][C]-1.4842[/C][C]0.071493[/C][/ROW]
[ROW][C]33[/C][C]-0.109034[/C][C]-0.8446[/C][C]0.200851[/C][/ROW]
[ROW][C]34[/C][C]-0.205828[/C][C]-1.5943[/C][C]0.058057[/C][/ROW]
[ROW][C]35[/C][C]-0.177653[/C][C]-1.3761[/C][C]0.086954[/C][/ROW]
[ROW][C]36[/C][C]0.036493[/C][C]0.2827[/C][C]0.389201[/C][/ROW]
[/TABLE]
Source: https://freestatistics.org/blog/index.php?pk=34233&T=1

Globally Unique Identifier (entire table): ba.freestatistics.org/blog/index.php?pk=34233&T=1

As an alternative you can also use a QR Code:  

The GUIDs for individual cells are displayed in the table below:

Autocorrelation Function
Time lag kACF(k)T-STATP-value
10.3870812.99830.001973
20.1480621.14690.127991
30.4285423.31950.000769
40.1701981.31830.096199
50.1530731.18570.120209
60.4043653.13220.001341
70.155231.20240.116966
80.1344771.04170.150875
90.2947662.28330.012986
100.0111330.08620.465783
110.1529281.18460.120428
120.5858854.53821.4e-05
130.1763151.36570.088561
14-0.032147-0.2490.402103
150.2005571.55350.062781
16-0.028045-0.21720.414381
17-0.042718-0.33090.370938
180.1433461.11040.135638
19-0.02309-0.17890.429327
20-0.056875-0.44060.33056
210.0512670.39710.346346
22-0.174034-1.34810.091353
23-0.045351-0.35130.363301
240.2544851.97120.026657
250.0085120.06590.473825
26-0.156773-1.21440.114684
27-0.017946-0.1390.444954
28-0.190782-1.47780.072347
29-0.210519-1.63070.054099
30-0.061753-0.47830.317075
31-0.130898-1.01390.157343
32-0.191611-1.48420.071493
33-0.109034-0.84460.200851
34-0.205828-1.59430.058057
35-0.177653-1.37610.086954
360.0364930.28270.389201


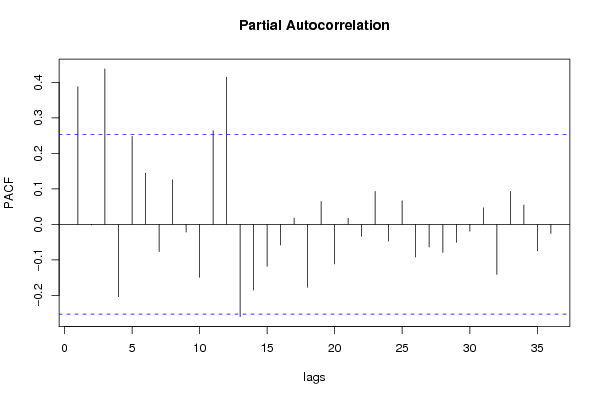
Partial Autocorrelation Function
Time lag kPACF(k)T-STATP-value
10.3870812.99830.001973
2-0.002081-0.01610.493597
30.4374633.38860.000623
4-0.204111-1.5810.059564
50.2471411.91430.030174
60.1439891.11530.134577
7-0.076491-0.59250.277872
80.1252760.97040.167876
9-0.021579-0.16710.433908
10-0.149362-1.1570.125939
110.2634842.04090.022832
120.4141583.20810.001073
13-0.259973-2.01370.024264
14-0.185045-1.43340.078474
15-0.118362-0.91680.181451
16-0.05804-0.44960.327319
170.0174920.13550.446339
18-0.17714-1.37210.087568
190.0640230.49590.310881
20-0.111401-0.86290.195813
210.0170770.13230.447604
22-0.033623-0.26040.397706
230.0925940.71720.238007
24-0.047118-0.3650.358206
250.0661310.51220.30518
26-0.09211-0.71350.239158
27-0.063833-0.49450.311397
28-0.079486-0.61570.270212
29-0.05067-0.39250.348043
30-0.019313-0.14960.440791
310.0463270.35880.360485
32-0.141098-1.09290.139394
330.0922320.71440.238866
340.0541080.41910.338314
35-0.074745-0.5790.282387
36-0.025601-0.19830.421739

\begin{tabular}{lllllllll}
\hline
Partial Autocorrelation Function \tabularnewline
Time lag k & PACF(k) & T-STAT & P-value \tabularnewline
1 & 0.387081 & 2.9983 & 0.001973 \tabularnewline
2 & -0.002081 & -0.0161 & 0.493597 \tabularnewline
3 & 0.437463 & 3.3886 & 0.000623 \tabularnewline
4 & -0.204111 & -1.581 & 0.059564 \tabularnewline
5 & 0.247141 & 1.9143 & 0.030174 \tabularnewline
6 & 0.143989 & 1.1153 & 0.134577 \tabularnewline
7 & -0.076491 & -0.5925 & 0.277872 \tabularnewline
8 & 0.125276 & 0.9704 & 0.167876 \tabularnewline
9 & -0.021579 & -0.1671 & 0.433908 \tabularnewline
10 & -0.149362 & -1.157 & 0.125939 \tabularnewline
11 & 0.263484 & 2.0409 & 0.022832 \tabularnewline
12 & 0.414158 & 3.2081 & 0.001073 \tabularnewline
13 & -0.259973 & -2.0137 & 0.024264 \tabularnewline
14 & -0.185045 & -1.4334 & 0.078474 \tabularnewline
15 & -0.118362 & -0.9168 & 0.181451 \tabularnewline
16 & -0.05804 & -0.4496 & 0.327319 \tabularnewline
17 & 0.017492 & 0.1355 & 0.446339 \tabularnewline
18 & -0.17714 & -1.3721 & 0.087568 \tabularnewline
19 & 0.064023 & 0.4959 & 0.310881 \tabularnewline
20 & -0.111401 & -0.8629 & 0.195813 \tabularnewline
21 & 0.017077 & 0.1323 & 0.447604 \tabularnewline
22 & -0.033623 & -0.2604 & 0.397706 \tabularnewline
23 & 0.092594 & 0.7172 & 0.238007 \tabularnewline
24 & -0.047118 & -0.365 & 0.358206 \tabularnewline
25 & 0.066131 & 0.5122 & 0.30518 \tabularnewline
26 & -0.09211 & -0.7135 & 0.239158 \tabularnewline
27 & -0.063833 & -0.4945 & 0.311397 \tabularnewline
28 & -0.079486 & -0.6157 & 0.270212 \tabularnewline
29 & -0.05067 & -0.3925 & 0.348043 \tabularnewline
30 & -0.019313 & -0.1496 & 0.440791 \tabularnewline
31 & 0.046327 & 0.3588 & 0.360485 \tabularnewline
32 & -0.141098 & -1.0929 & 0.139394 \tabularnewline
33 & 0.092232 & 0.7144 & 0.238866 \tabularnewline
34 & 0.054108 & 0.4191 & 0.338314 \tabularnewline
35 & -0.074745 & -0.579 & 0.282387 \tabularnewline
36 & -0.025601 & -0.1983 & 0.421739 \tabularnewline
\hline
\end{tabular}
%Source: https://freestatistics.org/blog/index.php?pk=34233&T=2

[TABLE]
[ROW][C]Partial Autocorrelation Function[/C][/ROW]
[ROW][C]Time lag k[/C][C]PACF(k)[/C][C]T-STAT[/C][C]P-value[/C][/ROW]
[ROW][C]1[/C][C]0.387081[/C][C]2.9983[/C][C]0.001973[/C][/ROW]
[ROW][C]2[/C][C]-0.002081[/C][C]-0.0161[/C][C]0.493597[/C][/ROW]
[ROW][C]3[/C][C]0.437463[/C][C]3.3886[/C][C]0.000623[/C][/ROW]
[ROW][C]4[/C][C]-0.204111[/C][C]-1.581[/C][C]0.059564[/C][/ROW]
[ROW][C]5[/C][C]0.247141[/C][C]1.9143[/C][C]0.030174[/C][/ROW]
[ROW][C]6[/C][C]0.143989[/C][C]1.1153[/C][C]0.134577[/C][/ROW]
[ROW][C]7[/C][C]-0.076491[/C][C]-0.5925[/C][C]0.277872[/C][/ROW]
[ROW][C]8[/C][C]0.125276[/C][C]0.9704[/C][C]0.167876[/C][/ROW]
[ROW][C]9[/C][C]-0.021579[/C][C]-0.1671[/C][C]0.433908[/C][/ROW]
[ROW][C]10[/C][C]-0.149362[/C][C]-1.157[/C][C]0.125939[/C][/ROW]
[ROW][C]11[/C][C]0.263484[/C][C]2.0409[/C][C]0.022832[/C][/ROW]
[ROW][C]12[/C][C]0.414158[/C][C]3.2081[/C][C]0.001073[/C][/ROW]
[ROW][C]13[/C][C]-0.259973[/C][C]-2.0137[/C][C]0.024264[/C][/ROW]
[ROW][C]14[/C][C]-0.185045[/C][C]-1.4334[/C][C]0.078474[/C][/ROW]
[ROW][C]15[/C][C]-0.118362[/C][C]-0.9168[/C][C]0.181451[/C][/ROW]
[ROW][C]16[/C][C]-0.05804[/C][C]-0.4496[/C][C]0.327319[/C][/ROW]
[ROW][C]17[/C][C]0.017492[/C][C]0.1355[/C][C]0.446339[/C][/ROW]
[ROW][C]18[/C][C]-0.17714[/C][C]-1.3721[/C][C]0.087568[/C][/ROW]
[ROW][C]19[/C][C]0.064023[/C][C]0.4959[/C][C]0.310881[/C][/ROW]
[ROW][C]20[/C][C]-0.111401[/C][C]-0.8629[/C][C]0.195813[/C][/ROW]
[ROW][C]21[/C][C]0.017077[/C][C]0.1323[/C][C]0.447604[/C][/ROW]
[ROW][C]22[/C][C]-0.033623[/C][C]-0.2604[/C][C]0.397706[/C][/ROW]
[ROW][C]23[/C][C]0.092594[/C][C]0.7172[/C][C]0.238007[/C][/ROW]
[ROW][C]24[/C][C]-0.047118[/C][C]-0.365[/C][C]0.358206[/C][/ROW]
[ROW][C]25[/C][C]0.066131[/C][C]0.5122[/C][C]0.30518[/C][/ROW]
[ROW][C]26[/C][C]-0.09211[/C][C]-0.7135[/C][C]0.239158[/C][/ROW]
[ROW][C]27[/C][C]-0.063833[/C][C]-0.4945[/C][C]0.311397[/C][/ROW]
[ROW][C]28[/C][C]-0.079486[/C][C]-0.6157[/C][C]0.270212[/C][/ROW]
[ROW][C]29[/C][C]-0.05067[/C][C]-0.3925[/C][C]0.348043[/C][/ROW]
[ROW][C]30[/C][C]-0.019313[/C][C]-0.1496[/C][C]0.440791[/C][/ROW]
[ROW][C]31[/C][C]0.046327[/C][C]0.3588[/C][C]0.360485[/C][/ROW]
[ROW][C]32[/C][C]-0.141098[/C][C]-1.0929[/C][C]0.139394[/C][/ROW]
[ROW][C]33[/C][C]0.092232[/C][C]0.7144[/C][C]0.238866[/C][/ROW]
[ROW][C]34[/C][C]0.054108[/C][C]0.4191[/C][C]0.338314[/C][/ROW]
[ROW][C]35[/C][C]-0.074745[/C][C]-0.579[/C][C]0.282387[/C][/ROW]
[ROW][C]36[/C][C]-0.025601[/C][C]-0.1983[/C][C]0.421739[/C][/ROW]
[/TABLE]
Source: https://freestatistics.org/blog/index.php?pk=34233&T=2

Globally Unique Identifier (entire table): ba.freestatistics.org/blog/index.php?pk=34233&T=2

As an alternative you can also use a QR Code:  

The GUIDs for individual cells are displayed in the table below:

Partial Autocorrelation Function
Time lag kPACF(k)T-STATP-value
10.3870812.99830.001973
2-0.002081-0.01610.493597
30.4374633.38860.000623
4-0.204111-1.5810.059564
50.2471411.91430.030174
60.1439891.11530.134577
7-0.076491-0.59250.277872
80.1252760.97040.167876
9-0.021579-0.16710.433908
10-0.149362-1.1570.125939
110.2634842.04090.022832
120.4141583.20810.001073
13-0.259973-2.01370.024264
14-0.185045-1.43340.078474
15-0.118362-0.91680.181451
16-0.05804-0.44960.327319
170.0174920.13550.446339
18-0.17714-1.37210.087568
190.0640230.49590.310881
20-0.111401-0.86290.195813
210.0170770.13230.447604
22-0.033623-0.26040.397706
230.0925940.71720.238007
24-0.047118-0.3650.358206
250.0661310.51220.30518
26-0.09211-0.71350.239158
27-0.063833-0.49450.311397
28-0.079486-0.61570.270212
29-0.05067-0.39250.348043
30-0.019313-0.14960.440791
310.0463270.35880.360485
32-0.141098-1.09290.139394
330.0922320.71440.238866
340.0541080.41910.338314
35-0.074745-0.5790.282387
36-0.025601-0.19830.421739


Parameters (Session):
par1 = 36 ; par2 = 1 ; par3 = 0 ; par4 = 0 ; par5 = 12 ;
Parameters (R input):
par1 = 36 ; par2 = 1 ; par3 = 0 ; par4 = 0 ; par5 = 12 ;
R code (references can be found in the software module):
if (par1 == 'Default') {
par1 = 10*log10(length(x))
} else {
par1 <- as.numeric(par1)
}
par2 <- as.numeric(par2)
par3 <- as.numeric(par3)
par4 <- as.numeric(par4)
par5 <- as.numeric(par5)
if (par2 == 0) {
x <- log(x)
} else {
x <- (x ^ par2 - 1) / par2
}
if (par3 > 0) x <- diff(x,lag=1,difference=par3)
if (par4 > 0) x <- diff(x,lag=par5,difference=par4)
bitmap(file='pic1.png')
racf <- acf(x,par1,main='Autocorrelation',xlab='lags',ylab='ACF')
dev.off()
bitmap(file='pic2.png')
rpacf <- pacf(x,par1,main='Partial Autocorrelation',xlab='lags',ylab='PACF')
dev.off()
(myacf <- c(racf$acf))
(mypacf <- c(rpacf$acf))
lengthx <- length(x)
sqrtn <- sqrt(lengthx)
load(file='createtable')
a<-table.start()
a<-table.row.start(a)
a<-table.element(a,'Autocorrelation Function',4,TRUE)
a<-table.row.end(a)
a<-table.row.start(a)
a<-table.element(a,'Time lag k',header=TRUE)
a<-table.element(a,hyperlink('basics.htm','ACF(k)','click here for more information about the Autocorrelation Function'),header=TRUE)
a<-table.element(a,'T-STAT',header=TRUE)
a<-table.element(a,'P-value',header=TRUE)
a<-table.row.end(a)
for (i in 2:(par1+1)) {
a<-table.row.start(a)
a<-table.element(a,i-1,header=TRUE)
a<-table.element(a,round(myacf[i],6))
mytstat <- myacf[i]*sqrtn
a<-table.element(a,round(mytstat,4))
a<-table.element(a,round(1-pt(abs(mytstat),lengthx),6))
a<-table.row.end(a)
}
a<-table.end(a)
table.save(a,file='mytable.tab')
a<-table.start()
a<-table.row.start(a)
a<-table.element(a,'Partial Autocorrelation Function',4,TRUE)
a<-table.row.end(a)
a<-table.row.start(a)
a<-table.element(a,'Time lag k',header=TRUE)
a<-table.element(a,hyperlink('basics.htm','PACF(k)','click here for more information about the Partial Autocorrelation Function'),header=TRUE)
a<-table.element(a,'T-STAT',header=TRUE)
a<-table.element(a,'P-value',header=TRUE)
a<-table.row.end(a)
for (i in 1:par1) {
a<-table.row.start(a)
a<-table.element(a,i,header=TRUE)
a<-table.element(a,round(mypacf[i],6))
mytstat <- mypacf[i]*sqrtn
a<-table.element(a,round(mytstat,4))
a<-table.element(a,round(1-pt(abs(mytstat),lengthx),6))
a<-table.row.end(a)
}
a<-table.end(a)
table.save(a,file='mytable1.tab')