Free Statistics

of Irreproducible Research!

Author's title

Author*The author of this computation has been verified*
R Software Modulerwasp_multipleregression.wasp
Title produced by softwareMultiple Regression
Date of computationTue, 16 Dec 2008 14:17:12 -0700
Cite this page as followsStatistical Computations at FreeStatistics.org, Office for Research Development and Education, URL https://freestatistics.org/blog/index.php?v=date/2008/Dec/16/t1229462271trfgp4wvc06nugq.htm/, Retrieved Thu, 16 May 2024 01:06:17 +0000
Statistical Computations at FreeStatistics.org, Office for Research Development and Education, URL https://freestatistics.org/blog/index.php?pk=34213, Retrieved Thu, 16 May 2024 01:06:17 +0000
QR Codes:

Original text written by user:
IsPrivate?No (this computation is public)
User-defined keywords
Estimated Impact168
Family? (F = Feedback message, R = changed R code, M = changed R Module, P = changed Parameters, D = changed Data)
-       [Multiple Regression] [Paper H4 Vrouwen ...] [2008-12-16 21:17:12] [5e9e099b83e50415d7642e10d74756e4] [Current]
Feedback Forum

Post a new message
Dataseries X:
308347	0
298427	0
289231	0
291975	0
294912	0
293488	0
290555	0
284736	0
281818	0
287854	0
316263	0
325412	0
326011	0
328282	0
317480	0
317539	0
313737	0
312276	0
309391	0
302950	0
300316	0
304035	0
333476	0
337698	0
335932	0
323931	0
313927	0
314485	1
313218	1
309664	1
302963	1
298989	1
298423	1
301631	1
329765	1
335083	1
327616	1
309119	1
295916	1
291413	1
291542	1
284678	1
276475	1
272566	1
264981	1
263290	1
296806	1
303598	1
286994	1
276427	1
266424	1
267153	1
268381	1
262522	1
255542	1
253158	1
243803	1
250741	1
280445	1
285257	1
270976	1
261076	1
255603	1


Summary of computational transaction
Raw Inputview raw input (R code)
Raw Outputview raw output of R engine
Computing time10 seconds
R Server'George Udny Yule' @ 72.249.76.132

\begin{tabular}{lllllllll}
\hline
Summary of computational transaction \tabularnewline
Raw Input & view raw input (R code)  \tabularnewline
Raw Output & view raw output of R engine  \tabularnewline
Computing time & 10 seconds \tabularnewline
R Server & 'George Udny Yule' @ 72.249.76.132 \tabularnewline
\hline
\end{tabular}
%Source: https://freestatistics.org/blog/index.php?pk=34213&T=0

[TABLE]
[ROW][C]Summary of computational transaction[/C][/ROW]
[ROW][C]Raw Input[/C][C]view raw input (R code) [/C][/ROW]
[ROW][C]Raw Output[/C][C]view raw output of R engine [/C][/ROW]
[ROW][C]Computing time[/C][C]10 seconds[/C][/ROW]
[ROW][C]R Server[/C][C]'George Udny Yule' @ 72.249.76.132[/C][/ROW]
[/TABLE]
Source: https://freestatistics.org/blog/index.php?pk=34213&T=0

Globally Unique Identifier (entire table): ba.freestatistics.org/blog/index.php?pk=34213&T=0

As an alternative you can also use a QR Code:  

The GUIDs for individual cells are displayed in the table below:

Summary of computational transaction
Raw Inputview raw input (R code)
Raw Outputview raw output of R engine
Computing time10 seconds
R Server'George Udny Yule' @ 72.249.76.132


Multiple Linear Regression - Estimated Regression Equation
Vrouwen[t] = + 331454.239215686 -23407.7320261438Dummy[t] -10437.7065359477M1[t] -20206.7065359477M2[t] -29986.8732026144M3[t] -20896.6000000000M4[t] -21051.5999999999M5[t] -24884.0000000000M6[t] -30424.4000000000M7[t] -34929.8M8[t] -39541.4M9[t] -35899.4M10[t] -6058.59999999998M11[t] + e[t]

\begin{tabular}{lllllllll}
\hline
Multiple Linear Regression - Estimated Regression Equation \tabularnewline
Vrouwen[t] =  +  331454.239215686 -23407.7320261438Dummy[t] -10437.7065359477M1[t] -20206.7065359477M2[t] -29986.8732026144M3[t] -20896.6000000000M4[t] -21051.5999999999M5[t] -24884.0000000000M6[t] -30424.4000000000M7[t] -34929.8M8[t] -39541.4M9[t] -35899.4M10[t] -6058.59999999998M11[t]  + e[t] \tabularnewline
\hline
\end{tabular}
%Source: https://freestatistics.org/blog/index.php?pk=34213&T=1

[TABLE]
[ROW][C]Multiple Linear Regression - Estimated Regression Equation[/C][/ROW]
[ROW][C]Vrouwen[t] =  +  331454.239215686 -23407.7320261438Dummy[t] -10437.7065359477M1[t] -20206.7065359477M2[t] -29986.8732026144M3[t] -20896.6000000000M4[t] -21051.5999999999M5[t] -24884.0000000000M6[t] -30424.4000000000M7[t] -34929.8M8[t] -39541.4M9[t] -35899.4M10[t] -6058.59999999998M11[t]  + e[t][/C][/ROW]
[/TABLE]
Source: https://freestatistics.org/blog/index.php?pk=34213&T=1

Globally Unique Identifier (entire table): ba.freestatistics.org/blog/index.php?pk=34213&T=1

As an alternative you can also use a QR Code:  

The GUIDs for individual cells are displayed in the table below:

Multiple Linear Regression - Estimated Regression Equation
Vrouwen[t] = + 331454.239215686 -23407.7320261438Dummy[t] -10437.7065359477M1[t] -20206.7065359477M2[t] -29986.8732026144M3[t] -20896.6000000000M4[t] -21051.5999999999M5[t] -24884.0000000000M6[t] -30424.4000000000M7[t] -34929.8M8[t] -39541.4M9[t] -35899.4M10[t] -6058.59999999998M11[t] + e[t]


Multiple Linear Regression - Ordinary Least Squares
VariableParameterS.D.T-STATH0: parameter = 02-tail p-value1-tail p-value
(Intercept)331454.2392156869046.8949536.637300
Dummy-23407.73202614384892.000519-4.78491.6e-058e-06
M1-10437.706535947711597.240197-0.90.3724260.186213
M2-20206.706535947711597.240197-1.74240.0875920.043796
M3-29986.873202614411597.240197-2.58570.012680.00634
M4-20896.600000000012102.140915-1.72670.0903980.045199
M5-21051.599999999912102.140915-1.73950.0881010.044051
M6-24884.000000000012102.140915-2.05620.0450050.022503
M7-30424.400000000012102.140915-2.5140.0152030.007602
M8-34929.812102.140915-2.88620.0057430.002871
M9-39541.412102.140915-3.26730.0019660.000983
M10-35899.412102.140915-2.96640.0046110.002306
M11-6058.5999999999812102.140915-0.50060.6188340.309417

\begin{tabular}{lllllllll}
\hline
Multiple Linear Regression - Ordinary Least Squares \tabularnewline
Variable & Parameter & S.D. & T-STATH0: parameter = 0 & 2-tail p-value & 1-tail p-value \tabularnewline
(Intercept) & 331454.239215686 & 9046.89495 & 36.6373 & 0 & 0 \tabularnewline
Dummy & -23407.7320261438 & 4892.000519 & -4.7849 & 1.6e-05 & 8e-06 \tabularnewline
M1 & -10437.7065359477 & 11597.240197 & -0.9 & 0.372426 & 0.186213 \tabularnewline
M2 & -20206.7065359477 & 11597.240197 & -1.7424 & 0.087592 & 0.043796 \tabularnewline
M3 & -29986.8732026144 & 11597.240197 & -2.5857 & 0.01268 & 0.00634 \tabularnewline
M4 & -20896.6000000000 & 12102.140915 & -1.7267 & 0.090398 & 0.045199 \tabularnewline
M5 & -21051.5999999999 & 12102.140915 & -1.7395 & 0.088101 & 0.044051 \tabularnewline
M6 & -24884.0000000000 & 12102.140915 & -2.0562 & 0.045005 & 0.022503 \tabularnewline
M7 & -30424.4000000000 & 12102.140915 & -2.514 & 0.015203 & 0.007602 \tabularnewline
M8 & -34929.8 & 12102.140915 & -2.8862 & 0.005743 & 0.002871 \tabularnewline
M9 & -39541.4 & 12102.140915 & -3.2673 & 0.001966 & 0.000983 \tabularnewline
M10 & -35899.4 & 12102.140915 & -2.9664 & 0.004611 & 0.002306 \tabularnewline
M11 & -6058.59999999998 & 12102.140915 & -0.5006 & 0.618834 & 0.309417 \tabularnewline
\hline
\end{tabular}
%Source: https://freestatistics.org/blog/index.php?pk=34213&T=2

[TABLE]
[ROW][C]Multiple Linear Regression - Ordinary Least Squares[/C][/ROW]
[ROW][C]Variable[/C][C]Parameter[/C][C]S.D.[/C][C]T-STATH0: parameter = 0[/C][C]2-tail p-value[/C][C]1-tail p-value[/C][/ROW]
[ROW][C](Intercept)[/C][C]331454.239215686[/C][C]9046.89495[/C][C]36.6373[/C][C]0[/C][C]0[/C][/ROW]
[ROW][C]Dummy[/C][C]-23407.7320261438[/C][C]4892.000519[/C][C]-4.7849[/C][C]1.6e-05[/C][C]8e-06[/C][/ROW]
[ROW][C]M1[/C][C]-10437.7065359477[/C][C]11597.240197[/C][C]-0.9[/C][C]0.372426[/C][C]0.186213[/C][/ROW]
[ROW][C]M2[/C][C]-20206.7065359477[/C][C]11597.240197[/C][C]-1.7424[/C][C]0.087592[/C][C]0.043796[/C][/ROW]
[ROW][C]M3[/C][C]-29986.8732026144[/C][C]11597.240197[/C][C]-2.5857[/C][C]0.01268[/C][C]0.00634[/C][/ROW]
[ROW][C]M4[/C][C]-20896.6000000000[/C][C]12102.140915[/C][C]-1.7267[/C][C]0.090398[/C][C]0.045199[/C][/ROW]
[ROW][C]M5[/C][C]-21051.5999999999[/C][C]12102.140915[/C][C]-1.7395[/C][C]0.088101[/C][C]0.044051[/C][/ROW]
[ROW][C]M6[/C][C]-24884.0000000000[/C][C]12102.140915[/C][C]-2.0562[/C][C]0.045005[/C][C]0.022503[/C][/ROW]
[ROW][C]M7[/C][C]-30424.4000000000[/C][C]12102.140915[/C][C]-2.514[/C][C]0.015203[/C][C]0.007602[/C][/ROW]
[ROW][C]M8[/C][C]-34929.8[/C][C]12102.140915[/C][C]-2.8862[/C][C]0.005743[/C][C]0.002871[/C][/ROW]
[ROW][C]M9[/C][C]-39541.4[/C][C]12102.140915[/C][C]-3.2673[/C][C]0.001966[/C][C]0.000983[/C][/ROW]
[ROW][C]M10[/C][C]-35899.4[/C][C]12102.140915[/C][C]-2.9664[/C][C]0.004611[/C][C]0.002306[/C][/ROW]
[ROW][C]M11[/C][C]-6058.59999999998[/C][C]12102.140915[/C][C]-0.5006[/C][C]0.618834[/C][C]0.309417[/C][/ROW]
[/TABLE]
Source: https://freestatistics.org/blog/index.php?pk=34213&T=2

Globally Unique Identifier (entire table): ba.freestatistics.org/blog/index.php?pk=34213&T=2

As an alternative you can also use a QR Code:  

The GUIDs for individual cells are displayed in the table below:

Multiple Linear Regression - Ordinary Least Squares
VariableParameterS.D.T-STATH0: parameter = 02-tail p-value1-tail p-value
(Intercept)331454.2392156869046.8949536.637300
Dummy-23407.73202614384892.000519-4.78491.6e-058e-06
M1-10437.706535947711597.240197-0.90.3724260.186213
M2-20206.706535947711597.240197-1.74240.0875920.043796
M3-29986.873202614411597.240197-2.58570.012680.00634
M4-20896.600000000012102.140915-1.72670.0903980.045199
M5-21051.599999999912102.140915-1.73950.0881010.044051
M6-24884.000000000012102.140915-2.05620.0450050.022503
M7-30424.400000000012102.140915-2.5140.0152030.007602
M8-34929.812102.140915-2.88620.0057430.002871
M9-39541.412102.140915-3.26730.0019660.000983
M10-35899.412102.140915-2.96640.0046110.002306
M11-6058.5999999999812102.140915-0.50060.6188340.309417


Multiple Linear Regression - Regression Statistics
Multiple R0.696765395071021
R-squared0.485482015768476
Adjusted R-squared0.36199769955291
F-TEST (value)3.93152774900557
F-TEST (DF numerator)12
F-TEST (DF denominator)50
p-value0.000290426128867538
Multiple Linear Regression - Residual Statistics
Residual Standard Deviation19135.1649279895
Sum Squared Residuals18307726841.0680

\begin{tabular}{lllllllll}
\hline
Multiple Linear Regression - Regression Statistics \tabularnewline
Multiple R & 0.696765395071021 \tabularnewline
R-squared & 0.485482015768476 \tabularnewline
Adjusted R-squared & 0.36199769955291 \tabularnewline
F-TEST (value) & 3.93152774900557 \tabularnewline
F-TEST (DF numerator) & 12 \tabularnewline
F-TEST (DF denominator) & 50 \tabularnewline
p-value & 0.000290426128867538 \tabularnewline
Multiple Linear Regression - Residual Statistics \tabularnewline
Residual Standard Deviation & 19135.1649279895 \tabularnewline
Sum Squared Residuals & 18307726841.0680 \tabularnewline
\hline
\end{tabular}
%Source: https://freestatistics.org/blog/index.php?pk=34213&T=3

[TABLE]
[ROW][C]Multiple Linear Regression - Regression Statistics[/C][/ROW]
[ROW][C]Multiple R[/C][C]0.696765395071021[/C][/ROW]
[ROW][C]R-squared[/C][C]0.485482015768476[/C][/ROW]
[ROW][C]Adjusted R-squared[/C][C]0.36199769955291[/C][/ROW]
[ROW][C]F-TEST (value)[/C][C]3.93152774900557[/C][/ROW]
[ROW][C]F-TEST (DF numerator)[/C][C]12[/C][/ROW]
[ROW][C]F-TEST (DF denominator)[/C][C]50[/C][/ROW]
[ROW][C]p-value[/C][C]0.000290426128867538[/C][/ROW]
[ROW][C]Multiple Linear Regression - Residual Statistics[/C][/ROW]
[ROW][C]Residual Standard Deviation[/C][C]19135.1649279895[/C][/ROW]
[ROW][C]Sum Squared Residuals[/C][C]18307726841.0680[/C][/ROW]
[/TABLE]
Source: https://freestatistics.org/blog/index.php?pk=34213&T=3

Globally Unique Identifier (entire table): ba.freestatistics.org/blog/index.php?pk=34213&T=3

As an alternative you can also use a QR Code:  

The GUIDs for individual cells are displayed in the table below:

Multiple Linear Regression - Regression Statistics
Multiple R0.696765395071021
R-squared0.485482015768476
Adjusted R-squared0.36199769955291
F-TEST (value)3.93152774900557
F-TEST (DF numerator)12
F-TEST (DF denominator)50
p-value0.000290426128867538
Multiple Linear Regression - Residual Statistics
Residual Standard Deviation19135.1649279895
Sum Squared Residuals18307726841.0680


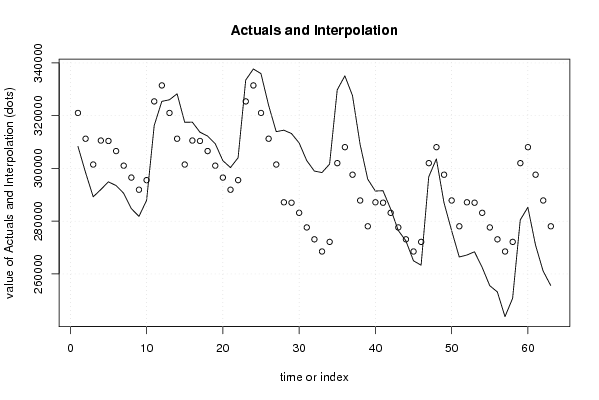
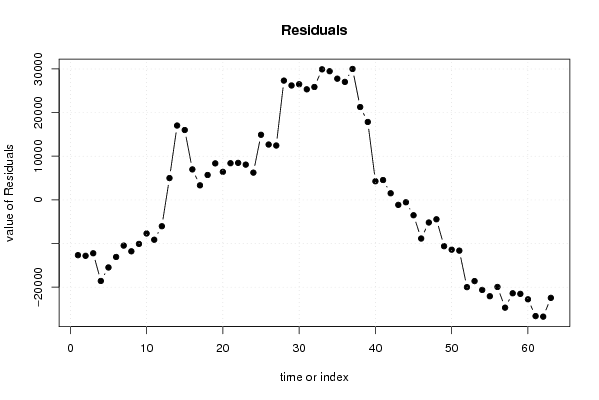
Multiple Linear Regression - Actuals, Interpolation, and Residuals
Time or IndexActualsInterpolationForecastResidualsPrediction Error
1308347321016.532679739-12669.5326797387
2298427311247.532679739-12820.5326797385
3289231301467.366013072-12236.3660130719
4291975310557.639215686-18582.6392156863
5294912310402.639215686-15490.6392156862
6293488306570.239215686-13082.2392156863
7290555301029.839215686-10474.8392156863
8284736296524.439215686-11788.4392156863
9281818291912.839215686-10094.8392156863
10287854295554.839215686-7700.83921568627
11316263325395.639215686-9132.63921568626
12325412331454.239215686-6042.23921568625
13326011321016.5326797394994.46732026147
14328282311247.53267973917034.4673202614
15317480301467.36601307216012.6339869281
16317539310557.6392156866981.36078431373
17313737310402.6392156863334.36078431372
18312276306570.2392156865705.76078431372
19309391301029.8392156868361.16078431374
20302950296524.4392156866425.56078431373
21300316291912.8392156868403.16078431374
22304035295554.8392156868480.16078431372
23333476325395.6392156868080.36078431374
24337698331454.2392156866243.76078431375
25335932321016.53267973914915.4673202615
26323931311247.53267973912683.4673202614
27313927301467.36601307212459.6339869281
28314485287149.90718954227335.0928104575
29313218286994.90718954226223.0928104575
30309664283162.50718954226501.4928104575
31302963277622.10718954225340.8928104575
32298989273116.70718954225872.2928104575
33298423268505.10718954229917.8928104575
34301631272147.10718954229483.8928104575
35329765301987.90718954227777.0928104575
36335083308046.50718954227036.4928104575
37327616297608.80065359530007.1993464053
38309119287839.80065359521279.1993464052
39295916278059.63398692817856.3660130719
40291413287149.9071895424263.09281045751
41291542286994.9071895424547.0928104575
42284678283162.5071895421515.49281045751
43276475277622.107189542-1147.10718954247
44272566273116.707189542-550.707189542478
45264981268505.107189542-3524.10718954247
46263290272147.107189542-8857.10718954249
47296806301987.907189542-5181.90718954248
48303598308046.507189542-4448.50718954247
49286994297608.800653595-10614.8006535947
50276427287839.800653595-11412.8006535948
51266424278059.633986928-11635.6339869281
52267153287149.907189542-19996.9071895425
53268381286994.907189542-18613.9071895425
54262522283162.507189542-20640.5071895425
55255542277622.107189542-22080.1071895425
56253158273116.707189542-19958.7071895425
57243803268505.107189542-24702.1071895425
58250741272147.107189542-21406.1071895425
59280445301987.907189542-21542.9071895425
60285257308046.507189542-22789.5071895425
61270976297608.800653595-26632.8006535947
62261076287839.800653595-26763.8006535948
63255603278059.633986928-22456.6339869281

\begin{tabular}{lllllllll}
\hline
Multiple Linear Regression - Actuals, Interpolation, and Residuals \tabularnewline
Time or Index & Actuals & InterpolationForecast & ResidualsPrediction Error \tabularnewline
1 & 308347 & 321016.532679739 & -12669.5326797387 \tabularnewline
2 & 298427 & 311247.532679739 & -12820.5326797385 \tabularnewline
3 & 289231 & 301467.366013072 & -12236.3660130719 \tabularnewline
4 & 291975 & 310557.639215686 & -18582.6392156863 \tabularnewline
5 & 294912 & 310402.639215686 & -15490.6392156862 \tabularnewline
6 & 293488 & 306570.239215686 & -13082.2392156863 \tabularnewline
7 & 290555 & 301029.839215686 & -10474.8392156863 \tabularnewline
8 & 284736 & 296524.439215686 & -11788.4392156863 \tabularnewline
9 & 281818 & 291912.839215686 & -10094.8392156863 \tabularnewline
10 & 287854 & 295554.839215686 & -7700.83921568627 \tabularnewline
11 & 316263 & 325395.639215686 & -9132.63921568626 \tabularnewline
12 & 325412 & 331454.239215686 & -6042.23921568625 \tabularnewline
13 & 326011 & 321016.532679739 & 4994.46732026147 \tabularnewline
14 & 328282 & 311247.532679739 & 17034.4673202614 \tabularnewline
15 & 317480 & 301467.366013072 & 16012.6339869281 \tabularnewline
16 & 317539 & 310557.639215686 & 6981.36078431373 \tabularnewline
17 & 313737 & 310402.639215686 & 3334.36078431372 \tabularnewline
18 & 312276 & 306570.239215686 & 5705.76078431372 \tabularnewline
19 & 309391 & 301029.839215686 & 8361.16078431374 \tabularnewline
20 & 302950 & 296524.439215686 & 6425.56078431373 \tabularnewline
21 & 300316 & 291912.839215686 & 8403.16078431374 \tabularnewline
22 & 304035 & 295554.839215686 & 8480.16078431372 \tabularnewline
23 & 333476 & 325395.639215686 & 8080.36078431374 \tabularnewline
24 & 337698 & 331454.239215686 & 6243.76078431375 \tabularnewline
25 & 335932 & 321016.532679739 & 14915.4673202615 \tabularnewline
26 & 323931 & 311247.532679739 & 12683.4673202614 \tabularnewline
27 & 313927 & 301467.366013072 & 12459.6339869281 \tabularnewline
28 & 314485 & 287149.907189542 & 27335.0928104575 \tabularnewline
29 & 313218 & 286994.907189542 & 26223.0928104575 \tabularnewline
30 & 309664 & 283162.507189542 & 26501.4928104575 \tabularnewline
31 & 302963 & 277622.107189542 & 25340.8928104575 \tabularnewline
32 & 298989 & 273116.707189542 & 25872.2928104575 \tabularnewline
33 & 298423 & 268505.107189542 & 29917.8928104575 \tabularnewline
34 & 301631 & 272147.107189542 & 29483.8928104575 \tabularnewline
35 & 329765 & 301987.907189542 & 27777.0928104575 \tabularnewline
36 & 335083 & 308046.507189542 & 27036.4928104575 \tabularnewline
37 & 327616 & 297608.800653595 & 30007.1993464053 \tabularnewline
38 & 309119 & 287839.800653595 & 21279.1993464052 \tabularnewline
39 & 295916 & 278059.633986928 & 17856.3660130719 \tabularnewline
40 & 291413 & 287149.907189542 & 4263.09281045751 \tabularnewline
41 & 291542 & 286994.907189542 & 4547.0928104575 \tabularnewline
42 & 284678 & 283162.507189542 & 1515.49281045751 \tabularnewline
43 & 276475 & 277622.107189542 & -1147.10718954247 \tabularnewline
44 & 272566 & 273116.707189542 & -550.707189542478 \tabularnewline
45 & 264981 & 268505.107189542 & -3524.10718954247 \tabularnewline
46 & 263290 & 272147.107189542 & -8857.10718954249 \tabularnewline
47 & 296806 & 301987.907189542 & -5181.90718954248 \tabularnewline
48 & 303598 & 308046.507189542 & -4448.50718954247 \tabularnewline
49 & 286994 & 297608.800653595 & -10614.8006535947 \tabularnewline
50 & 276427 & 287839.800653595 & -11412.8006535948 \tabularnewline
51 & 266424 & 278059.633986928 & -11635.6339869281 \tabularnewline
52 & 267153 & 287149.907189542 & -19996.9071895425 \tabularnewline
53 & 268381 & 286994.907189542 & -18613.9071895425 \tabularnewline
54 & 262522 & 283162.507189542 & -20640.5071895425 \tabularnewline
55 & 255542 & 277622.107189542 & -22080.1071895425 \tabularnewline
56 & 253158 & 273116.707189542 & -19958.7071895425 \tabularnewline
57 & 243803 & 268505.107189542 & -24702.1071895425 \tabularnewline
58 & 250741 & 272147.107189542 & -21406.1071895425 \tabularnewline
59 & 280445 & 301987.907189542 & -21542.9071895425 \tabularnewline
60 & 285257 & 308046.507189542 & -22789.5071895425 \tabularnewline
61 & 270976 & 297608.800653595 & -26632.8006535947 \tabularnewline
62 & 261076 & 287839.800653595 & -26763.8006535948 \tabularnewline
63 & 255603 & 278059.633986928 & -22456.6339869281 \tabularnewline
\hline
\end{tabular}
%Source: https://freestatistics.org/blog/index.php?pk=34213&T=4

[TABLE]
[ROW][C]Multiple Linear Regression - Actuals, Interpolation, and Residuals[/C][/ROW]
[ROW][C]Time or Index[/C][C]Actuals[/C][C]InterpolationForecast[/C][C]ResidualsPrediction Error[/C][/ROW]
[ROW][C]1[/C][C]308347[/C][C]321016.532679739[/C][C]-12669.5326797387[/C][/ROW]
[ROW][C]2[/C][C]298427[/C][C]311247.532679739[/C][C]-12820.5326797385[/C][/ROW]
[ROW][C]3[/C][C]289231[/C][C]301467.366013072[/C][C]-12236.3660130719[/C][/ROW]
[ROW][C]4[/C][C]291975[/C][C]310557.639215686[/C][C]-18582.6392156863[/C][/ROW]
[ROW][C]5[/C][C]294912[/C][C]310402.639215686[/C][C]-15490.6392156862[/C][/ROW]
[ROW][C]6[/C][C]293488[/C][C]306570.239215686[/C][C]-13082.2392156863[/C][/ROW]
[ROW][C]7[/C][C]290555[/C][C]301029.839215686[/C][C]-10474.8392156863[/C][/ROW]
[ROW][C]8[/C][C]284736[/C][C]296524.439215686[/C][C]-11788.4392156863[/C][/ROW]
[ROW][C]9[/C][C]281818[/C][C]291912.839215686[/C][C]-10094.8392156863[/C][/ROW]
[ROW][C]10[/C][C]287854[/C][C]295554.839215686[/C][C]-7700.83921568627[/C][/ROW]
[ROW][C]11[/C][C]316263[/C][C]325395.639215686[/C][C]-9132.63921568626[/C][/ROW]
[ROW][C]12[/C][C]325412[/C][C]331454.239215686[/C][C]-6042.23921568625[/C][/ROW]
[ROW][C]13[/C][C]326011[/C][C]321016.532679739[/C][C]4994.46732026147[/C][/ROW]
[ROW][C]14[/C][C]328282[/C][C]311247.532679739[/C][C]17034.4673202614[/C][/ROW]
[ROW][C]15[/C][C]317480[/C][C]301467.366013072[/C][C]16012.6339869281[/C][/ROW]
[ROW][C]16[/C][C]317539[/C][C]310557.639215686[/C][C]6981.36078431373[/C][/ROW]
[ROW][C]17[/C][C]313737[/C][C]310402.639215686[/C][C]3334.36078431372[/C][/ROW]
[ROW][C]18[/C][C]312276[/C][C]306570.239215686[/C][C]5705.76078431372[/C][/ROW]
[ROW][C]19[/C][C]309391[/C][C]301029.839215686[/C][C]8361.16078431374[/C][/ROW]
[ROW][C]20[/C][C]302950[/C][C]296524.439215686[/C][C]6425.56078431373[/C][/ROW]
[ROW][C]21[/C][C]300316[/C][C]291912.839215686[/C][C]8403.16078431374[/C][/ROW]
[ROW][C]22[/C][C]304035[/C][C]295554.839215686[/C][C]8480.16078431372[/C][/ROW]
[ROW][C]23[/C][C]333476[/C][C]325395.639215686[/C][C]8080.36078431374[/C][/ROW]
[ROW][C]24[/C][C]337698[/C][C]331454.239215686[/C][C]6243.76078431375[/C][/ROW]
[ROW][C]25[/C][C]335932[/C][C]321016.532679739[/C][C]14915.4673202615[/C][/ROW]
[ROW][C]26[/C][C]323931[/C][C]311247.532679739[/C][C]12683.4673202614[/C][/ROW]
[ROW][C]27[/C][C]313927[/C][C]301467.366013072[/C][C]12459.6339869281[/C][/ROW]
[ROW][C]28[/C][C]314485[/C][C]287149.907189542[/C][C]27335.0928104575[/C][/ROW]
[ROW][C]29[/C][C]313218[/C][C]286994.907189542[/C][C]26223.0928104575[/C][/ROW]
[ROW][C]30[/C][C]309664[/C][C]283162.507189542[/C][C]26501.4928104575[/C][/ROW]
[ROW][C]31[/C][C]302963[/C][C]277622.107189542[/C][C]25340.8928104575[/C][/ROW]
[ROW][C]32[/C][C]298989[/C][C]273116.707189542[/C][C]25872.2928104575[/C][/ROW]
[ROW][C]33[/C][C]298423[/C][C]268505.107189542[/C][C]29917.8928104575[/C][/ROW]
[ROW][C]34[/C][C]301631[/C][C]272147.107189542[/C][C]29483.8928104575[/C][/ROW]
[ROW][C]35[/C][C]329765[/C][C]301987.907189542[/C][C]27777.0928104575[/C][/ROW]
[ROW][C]36[/C][C]335083[/C][C]308046.507189542[/C][C]27036.4928104575[/C][/ROW]
[ROW][C]37[/C][C]327616[/C][C]297608.800653595[/C][C]30007.1993464053[/C][/ROW]
[ROW][C]38[/C][C]309119[/C][C]287839.800653595[/C][C]21279.1993464052[/C][/ROW]
[ROW][C]39[/C][C]295916[/C][C]278059.633986928[/C][C]17856.3660130719[/C][/ROW]
[ROW][C]40[/C][C]291413[/C][C]287149.907189542[/C][C]4263.09281045751[/C][/ROW]
[ROW][C]41[/C][C]291542[/C][C]286994.907189542[/C][C]4547.0928104575[/C][/ROW]
[ROW][C]42[/C][C]284678[/C][C]283162.507189542[/C][C]1515.49281045751[/C][/ROW]
[ROW][C]43[/C][C]276475[/C][C]277622.107189542[/C][C]-1147.10718954247[/C][/ROW]
[ROW][C]44[/C][C]272566[/C][C]273116.707189542[/C][C]-550.707189542478[/C][/ROW]
[ROW][C]45[/C][C]264981[/C][C]268505.107189542[/C][C]-3524.10718954247[/C][/ROW]
[ROW][C]46[/C][C]263290[/C][C]272147.107189542[/C][C]-8857.10718954249[/C][/ROW]
[ROW][C]47[/C][C]296806[/C][C]301987.907189542[/C][C]-5181.90718954248[/C][/ROW]
[ROW][C]48[/C][C]303598[/C][C]308046.507189542[/C][C]-4448.50718954247[/C][/ROW]
[ROW][C]49[/C][C]286994[/C][C]297608.800653595[/C][C]-10614.8006535947[/C][/ROW]
[ROW][C]50[/C][C]276427[/C][C]287839.800653595[/C][C]-11412.8006535948[/C][/ROW]
[ROW][C]51[/C][C]266424[/C][C]278059.633986928[/C][C]-11635.6339869281[/C][/ROW]
[ROW][C]52[/C][C]267153[/C][C]287149.907189542[/C][C]-19996.9071895425[/C][/ROW]
[ROW][C]53[/C][C]268381[/C][C]286994.907189542[/C][C]-18613.9071895425[/C][/ROW]
[ROW][C]54[/C][C]262522[/C][C]283162.507189542[/C][C]-20640.5071895425[/C][/ROW]
[ROW][C]55[/C][C]255542[/C][C]277622.107189542[/C][C]-22080.1071895425[/C][/ROW]
[ROW][C]56[/C][C]253158[/C][C]273116.707189542[/C][C]-19958.7071895425[/C][/ROW]
[ROW][C]57[/C][C]243803[/C][C]268505.107189542[/C][C]-24702.1071895425[/C][/ROW]
[ROW][C]58[/C][C]250741[/C][C]272147.107189542[/C][C]-21406.1071895425[/C][/ROW]
[ROW][C]59[/C][C]280445[/C][C]301987.907189542[/C][C]-21542.9071895425[/C][/ROW]
[ROW][C]60[/C][C]285257[/C][C]308046.507189542[/C][C]-22789.5071895425[/C][/ROW]
[ROW][C]61[/C][C]270976[/C][C]297608.800653595[/C][C]-26632.8006535947[/C][/ROW]
[ROW][C]62[/C][C]261076[/C][C]287839.800653595[/C][C]-26763.8006535948[/C][/ROW]
[ROW][C]63[/C][C]255603[/C][C]278059.633986928[/C][C]-22456.6339869281[/C][/ROW]
[/TABLE]
Source: https://freestatistics.org/blog/index.php?pk=34213&T=4

Globally Unique Identifier (entire table): ba.freestatistics.org/blog/index.php?pk=34213&T=4

As an alternative you can also use a QR Code:  

The GUIDs for individual cells are displayed in the table below:

Multiple Linear Regression - Actuals, Interpolation, and Residuals
Time or IndexActualsInterpolationForecastResidualsPrediction Error
1308347321016.532679739-12669.5326797387
2298427311247.532679739-12820.5326797385
3289231301467.366013072-12236.3660130719
4291975310557.639215686-18582.6392156863
5294912310402.639215686-15490.6392156862
6293488306570.239215686-13082.2392156863
7290555301029.839215686-10474.8392156863
8284736296524.439215686-11788.4392156863
9281818291912.839215686-10094.8392156863
10287854295554.839215686-7700.83921568627
11316263325395.639215686-9132.63921568626
12325412331454.239215686-6042.23921568625
13326011321016.5326797394994.46732026147
14328282311247.53267973917034.4673202614
15317480301467.36601307216012.6339869281
16317539310557.6392156866981.36078431373
17313737310402.6392156863334.36078431372
18312276306570.2392156865705.76078431372
19309391301029.8392156868361.16078431374
20302950296524.4392156866425.56078431373
21300316291912.8392156868403.16078431374
22304035295554.8392156868480.16078431372
23333476325395.6392156868080.36078431374
24337698331454.2392156866243.76078431375
25335932321016.53267973914915.4673202615
26323931311247.53267973912683.4673202614
27313927301467.36601307212459.6339869281
28314485287149.90718954227335.0928104575
29313218286994.90718954226223.0928104575
30309664283162.50718954226501.4928104575
31302963277622.10718954225340.8928104575
32298989273116.70718954225872.2928104575
33298423268505.10718954229917.8928104575
34301631272147.10718954229483.8928104575
35329765301987.90718954227777.0928104575
36335083308046.50718954227036.4928104575
37327616297608.80065359530007.1993464053
38309119287839.80065359521279.1993464052
39295916278059.63398692817856.3660130719
40291413287149.9071895424263.09281045751
41291542286994.9071895424547.0928104575
42284678283162.5071895421515.49281045751
43276475277622.107189542-1147.10718954247
44272566273116.707189542-550.707189542478
45264981268505.107189542-3524.10718954247
46263290272147.107189542-8857.10718954249
47296806301987.907189542-5181.90718954248
48303598308046.507189542-4448.50718954247
49286994297608.800653595-10614.8006535947
50276427287839.800653595-11412.8006535948
51266424278059.633986928-11635.6339869281
52267153287149.907189542-19996.9071895425
53268381286994.907189542-18613.9071895425
54262522283162.507189542-20640.5071895425
55255542277622.107189542-22080.1071895425
56253158273116.707189542-19958.7071895425
57243803268505.107189542-24702.1071895425
58250741272147.107189542-21406.1071895425
59280445301987.907189542-21542.9071895425
60285257308046.507189542-22789.5071895425
61270976297608.800653595-26632.8006535947
62261076287839.800653595-26763.8006535948
63255603278059.633986928-22456.6339869281


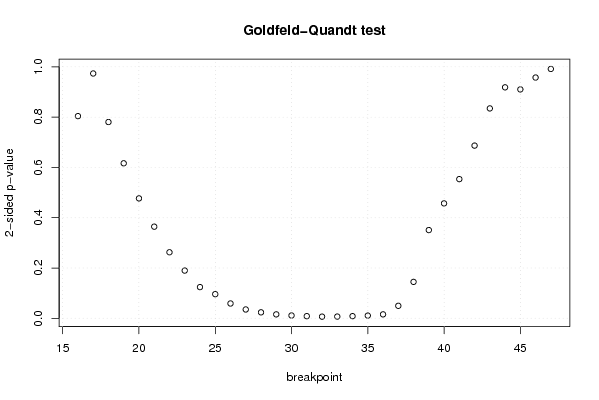
Goldfeld-Quandt test for Heteroskedasticity
p-valuesAlternative Hypothesis
breakpoint indexgreater2-sidedless
160.5979123324475870.8041753351048250.402087667552413
170.4868158030703510.9736316061407020.513184196929649
180.3902758637829310.7805517275658620.609724136217069
190.3082366455789040.6164732911578090.691763354421096
200.2384197233003480.4768394466006970.761580276699652
210.1821960490818410.3643920981636810.81780395091816
220.1312782859162060.2625565718324120.868721714083794
230.09486051197070880.1897210239414180.90513948802929
240.06203240823438450.1240648164687690.937967591765616
250.04793961425215410.09587922850430820.952060385747846
260.02945433893294270.05890867786588540.970545661067057
270.01752236870061670.03504473740123350.982477631299383
280.01180851520664190.02361703041328380.988191484793358
290.007796906977208250.01559381395441650.992203093022792
300.005534015225091160.01106803045018230.994465984774909
310.004237655918165990.008475311836331990.995762344081834
320.003239394342482370.006478788684964730.996760605657518
330.003403518156608540.006807036313217090.996596481843391
340.004232050807408390.008464101614816770.995767949192592
350.005321487538465660.01064297507693130.994678512461534
360.00779249728809420.01558499457618840.992207502711906
370.02479144290297190.04958288580594370.975208557097028
380.07240643228385740.1448128645677150.927593567716143
390.1754397220323660.3508794440647320.824560277967634
400.2284594534338640.4569189068677270.771540546566136
410.2767381005656410.5534762011312810.72326189943436
420.3433834989489650.686766997897930.656616501051035
430.4173591349308070.8347182698616130.582640865069193
440.4592934288295980.9185868576591960.540706571170402
450.5448040828818540.9103918342362920.455195917118146
460.5212360662443680.9575278675112630.478763933755632
470.495843957669940.991687915339880.50415604233006

\begin{tabular}{lllllllll}
\hline
Goldfeld-Quandt test for Heteroskedasticity \tabularnewline
p-values & Alternative Hypothesis \tabularnewline
breakpoint index & greater & 2-sided & less \tabularnewline
16 & 0.597912332447587 & 0.804175335104825 & 0.402087667552413 \tabularnewline
17 & 0.486815803070351 & 0.973631606140702 & 0.513184196929649 \tabularnewline
18 & 0.390275863782931 & 0.780551727565862 & 0.609724136217069 \tabularnewline
19 & 0.308236645578904 & 0.616473291157809 & 0.691763354421096 \tabularnewline
20 & 0.238419723300348 & 0.476839446600697 & 0.761580276699652 \tabularnewline
21 & 0.182196049081841 & 0.364392098163681 & 0.81780395091816 \tabularnewline
22 & 0.131278285916206 & 0.262556571832412 & 0.868721714083794 \tabularnewline
23 & 0.0948605119707088 & 0.189721023941418 & 0.90513948802929 \tabularnewline
24 & 0.0620324082343845 & 0.124064816468769 & 0.937967591765616 \tabularnewline
25 & 0.0479396142521541 & 0.0958792285043082 & 0.952060385747846 \tabularnewline
26 & 0.0294543389329427 & 0.0589086778658854 & 0.970545661067057 \tabularnewline
27 & 0.0175223687006167 & 0.0350447374012335 & 0.982477631299383 \tabularnewline
28 & 0.0118085152066419 & 0.0236170304132838 & 0.988191484793358 \tabularnewline
29 & 0.00779690697720825 & 0.0155938139544165 & 0.992203093022792 \tabularnewline
30 & 0.00553401522509116 & 0.0110680304501823 & 0.994465984774909 \tabularnewline
31 & 0.00423765591816599 & 0.00847531183633199 & 0.995762344081834 \tabularnewline
32 & 0.00323939434248237 & 0.00647878868496473 & 0.996760605657518 \tabularnewline
33 & 0.00340351815660854 & 0.00680703631321709 & 0.996596481843391 \tabularnewline
34 & 0.00423205080740839 & 0.00846410161481677 & 0.995767949192592 \tabularnewline
35 & 0.00532148753846566 & 0.0106429750769313 & 0.994678512461534 \tabularnewline
36 & 0.0077924972880942 & 0.0155849945761884 & 0.992207502711906 \tabularnewline
37 & 0.0247914429029719 & 0.0495828858059437 & 0.975208557097028 \tabularnewline
38 & 0.0724064322838574 & 0.144812864567715 & 0.927593567716143 \tabularnewline
39 & 0.175439722032366 & 0.350879444064732 & 0.824560277967634 \tabularnewline
40 & 0.228459453433864 & 0.456918906867727 & 0.771540546566136 \tabularnewline
41 & 0.276738100565641 & 0.553476201131281 & 0.72326189943436 \tabularnewline
42 & 0.343383498948965 & 0.68676699789793 & 0.656616501051035 \tabularnewline
43 & 0.417359134930807 & 0.834718269861613 & 0.582640865069193 \tabularnewline
44 & 0.459293428829598 & 0.918586857659196 & 0.540706571170402 \tabularnewline
45 & 0.544804082881854 & 0.910391834236292 & 0.455195917118146 \tabularnewline
46 & 0.521236066244368 & 0.957527867511263 & 0.478763933755632 \tabularnewline
47 & 0.49584395766994 & 0.99168791533988 & 0.50415604233006 \tabularnewline
\hline
\end{tabular}
%Source: https://freestatistics.org/blog/index.php?pk=34213&T=5

[TABLE]
[ROW][C]Goldfeld-Quandt test for Heteroskedasticity[/C][/ROW]
[ROW][C]p-values[/C][C]Alternative Hypothesis[/C][/ROW]
[ROW][C]breakpoint index[/C][C]greater[/C][C]2-sided[/C][C]less[/C][/ROW]
[ROW][C]16[/C][C]0.597912332447587[/C][C]0.804175335104825[/C][C]0.402087667552413[/C][/ROW]
[ROW][C]17[/C][C]0.486815803070351[/C][C]0.973631606140702[/C][C]0.513184196929649[/C][/ROW]
[ROW][C]18[/C][C]0.390275863782931[/C][C]0.780551727565862[/C][C]0.609724136217069[/C][/ROW]
[ROW][C]19[/C][C]0.308236645578904[/C][C]0.616473291157809[/C][C]0.691763354421096[/C][/ROW]
[ROW][C]20[/C][C]0.238419723300348[/C][C]0.476839446600697[/C][C]0.761580276699652[/C][/ROW]
[ROW][C]21[/C][C]0.182196049081841[/C][C]0.364392098163681[/C][C]0.81780395091816[/C][/ROW]
[ROW][C]22[/C][C]0.131278285916206[/C][C]0.262556571832412[/C][C]0.868721714083794[/C][/ROW]
[ROW][C]23[/C][C]0.0948605119707088[/C][C]0.189721023941418[/C][C]0.90513948802929[/C][/ROW]
[ROW][C]24[/C][C]0.0620324082343845[/C][C]0.124064816468769[/C][C]0.937967591765616[/C][/ROW]
[ROW][C]25[/C][C]0.0479396142521541[/C][C]0.0958792285043082[/C][C]0.952060385747846[/C][/ROW]
[ROW][C]26[/C][C]0.0294543389329427[/C][C]0.0589086778658854[/C][C]0.970545661067057[/C][/ROW]
[ROW][C]27[/C][C]0.0175223687006167[/C][C]0.0350447374012335[/C][C]0.982477631299383[/C][/ROW]
[ROW][C]28[/C][C]0.0118085152066419[/C][C]0.0236170304132838[/C][C]0.988191484793358[/C][/ROW]
[ROW][C]29[/C][C]0.00779690697720825[/C][C]0.0155938139544165[/C][C]0.992203093022792[/C][/ROW]
[ROW][C]30[/C][C]0.00553401522509116[/C][C]0.0110680304501823[/C][C]0.994465984774909[/C][/ROW]
[ROW][C]31[/C][C]0.00423765591816599[/C][C]0.00847531183633199[/C][C]0.995762344081834[/C][/ROW]
[ROW][C]32[/C][C]0.00323939434248237[/C][C]0.00647878868496473[/C][C]0.996760605657518[/C][/ROW]
[ROW][C]33[/C][C]0.00340351815660854[/C][C]0.00680703631321709[/C][C]0.996596481843391[/C][/ROW]
[ROW][C]34[/C][C]0.00423205080740839[/C][C]0.00846410161481677[/C][C]0.995767949192592[/C][/ROW]
[ROW][C]35[/C][C]0.00532148753846566[/C][C]0.0106429750769313[/C][C]0.994678512461534[/C][/ROW]
[ROW][C]36[/C][C]0.0077924972880942[/C][C]0.0155849945761884[/C][C]0.992207502711906[/C][/ROW]
[ROW][C]37[/C][C]0.0247914429029719[/C][C]0.0495828858059437[/C][C]0.975208557097028[/C][/ROW]
[ROW][C]38[/C][C]0.0724064322838574[/C][C]0.144812864567715[/C][C]0.927593567716143[/C][/ROW]
[ROW][C]39[/C][C]0.175439722032366[/C][C]0.350879444064732[/C][C]0.824560277967634[/C][/ROW]
[ROW][C]40[/C][C]0.228459453433864[/C][C]0.456918906867727[/C][C]0.771540546566136[/C][/ROW]
[ROW][C]41[/C][C]0.276738100565641[/C][C]0.553476201131281[/C][C]0.72326189943436[/C][/ROW]
[ROW][C]42[/C][C]0.343383498948965[/C][C]0.68676699789793[/C][C]0.656616501051035[/C][/ROW]
[ROW][C]43[/C][C]0.417359134930807[/C][C]0.834718269861613[/C][C]0.582640865069193[/C][/ROW]
[ROW][C]44[/C][C]0.459293428829598[/C][C]0.918586857659196[/C][C]0.540706571170402[/C][/ROW]
[ROW][C]45[/C][C]0.544804082881854[/C][C]0.910391834236292[/C][C]0.455195917118146[/C][/ROW]
[ROW][C]46[/C][C]0.521236066244368[/C][C]0.957527867511263[/C][C]0.478763933755632[/C][/ROW]
[ROW][C]47[/C][C]0.49584395766994[/C][C]0.99168791533988[/C][C]0.50415604233006[/C][/ROW]
[/TABLE]
Source: https://freestatistics.org/blog/index.php?pk=34213&T=5

Globally Unique Identifier (entire table): ba.freestatistics.org/blog/index.php?pk=34213&T=5

As an alternative you can also use a QR Code:  

The GUIDs for individual cells are displayed in the table below:

Goldfeld-Quandt test for Heteroskedasticity
p-valuesAlternative Hypothesis
breakpoint indexgreater2-sidedless
160.5979123324475870.8041753351048250.402087667552413
170.4868158030703510.9736316061407020.513184196929649
180.3902758637829310.7805517275658620.609724136217069
190.3082366455789040.6164732911578090.691763354421096
200.2384197233003480.4768394466006970.761580276699652
210.1821960490818410.3643920981636810.81780395091816
220.1312782859162060.2625565718324120.868721714083794
230.09486051197070880.1897210239414180.90513948802929
240.06203240823438450.1240648164687690.937967591765616
250.04793961425215410.09587922850430820.952060385747846
260.02945433893294270.05890867786588540.970545661067057
270.01752236870061670.03504473740123350.982477631299383
280.01180851520664190.02361703041328380.988191484793358
290.007796906977208250.01559381395441650.992203093022792
300.005534015225091160.01106803045018230.994465984774909
310.004237655918165990.008475311836331990.995762344081834
320.003239394342482370.006478788684964730.996760605657518
330.003403518156608540.006807036313217090.996596481843391
340.004232050807408390.008464101614816770.995767949192592
350.005321487538465660.01064297507693130.994678512461534
360.00779249728809420.01558499457618840.992207502711906
370.02479144290297190.04958288580594370.975208557097028
380.07240643228385740.1448128645677150.927593567716143
390.1754397220323660.3508794440647320.824560277967634
400.2284594534338640.4569189068677270.771540546566136
410.2767381005656410.5534762011312810.72326189943436
420.3433834989489650.686766997897930.656616501051035
430.4173591349308070.8347182698616130.582640865069193
440.4592934288295980.9185868576591960.540706571170402
450.5448040828818540.9103918342362920.455195917118146
460.5212360662443680.9575278675112630.478763933755632
470.495843957669940.991687915339880.50415604233006


Meta Analysis of Goldfeld-Quandt test for Heteroskedasticity
Description# significant tests% significant testsOK/NOK
1% type I error level40.125NOK
5% type I error level110.34375NOK
10% type I error level130.40625NOK

\begin{tabular}{lllllllll}
\hline
Meta Analysis of Goldfeld-Quandt test for Heteroskedasticity \tabularnewline
Description & # significant tests & % significant tests & OK/NOK \tabularnewline
1% type I error level & 4 & 0.125 & NOK \tabularnewline
5% type I error level & 11 & 0.34375 & NOK \tabularnewline
10% type I error level & 13 & 0.40625 & NOK \tabularnewline
\hline
\end{tabular}
%Source: https://freestatistics.org/blog/index.php?pk=34213&T=6

[TABLE]
[ROW][C]Meta Analysis of Goldfeld-Quandt test for Heteroskedasticity[/C][/ROW]
[ROW][C]Description[/C][C]# significant tests[/C][C]% significant tests[/C][C]OK/NOK[/C][/ROW]
[ROW][C]1% type I error level[/C][C]4[/C][C]0.125[/C][C]NOK[/C][/ROW]
[ROW][C]5% type I error level[/C][C]11[/C][C]0.34375[/C][C]NOK[/C][/ROW]
[ROW][C]10% type I error level[/C][C]13[/C][C]0.40625[/C][C]NOK[/C][/ROW]
[/TABLE]
Source: https://freestatistics.org/blog/index.php?pk=34213&T=6

Globally Unique Identifier (entire table): ba.freestatistics.org/blog/index.php?pk=34213&T=6

As an alternative you can also use a QR Code:  

The GUIDs for individual cells are displayed in the table below:

Meta Analysis of Goldfeld-Quandt test for Heteroskedasticity
Description# significant tests% significant testsOK/NOK
1% type I error level40.125NOK
5% type I error level110.34375NOK
10% type I error level130.40625NOK


Parameters (Session):
par1 = 1 ; par2 = Include Monthly Dummies ; par3 = No Linear Trend ;
Parameters (R input):
par1 = 1 ; par2 = Include Monthly Dummies ; par3 = No Linear Trend ;
R code (references can be found in the software module):
library(lattice)
library(lmtest)
n25 <- 25 #minimum number of obs. for Goldfeld-Quandt test
par1 <- as.numeric(par1)
x <- t(y)
k <- length(x[1,])
n <- length(x[,1])
x1 <- cbind(x[,par1], x[,1:k!=par1])
mycolnames <- c(colnames(x)[par1], colnames(x)[1:k!=par1])
colnames(x1) <- mycolnames #colnames(x)[par1]
x <- x1
if (par3 == 'First Differences'){
x2 <- array(0, dim=c(n-1,k), dimnames=list(1:(n-1), paste('(1-B)',colnames(x),sep='')))
for (i in 1:n-1) {
for (j in 1:k) {
x2[i,j] <- x[i+1,j] - x[i,j]
}
}
x <- x2
}
if (par2 == 'Include Monthly Dummies'){
x2 <- array(0, dim=c(n,11), dimnames=list(1:n, paste('M', seq(1:11), sep ='')))
for (i in 1:11){
x2[seq(i,n,12),i] <- 1
}
x <- cbind(x, x2)
}
if (par2 == 'Include Quarterly Dummies'){
x2 <- array(0, dim=c(n,3), dimnames=list(1:n, paste('Q', seq(1:3), sep ='')))
for (i in 1:3){
x2[seq(i,n,4),i] <- 1
}
x <- cbind(x, x2)
}
k <- length(x[1,])
if (par3 == 'Linear Trend'){
x <- cbind(x, c(1:n))
colnames(x)[k+1] <- 't'
}
x
k <- length(x[1,])
df <- as.data.frame(x)
(mylm <- lm(df))
(mysum <- summary(mylm))
if (n > n25) {
kp3 <- k + 3
nmkm3 <- n - k - 3
gqarr <- array(NA, dim=c(nmkm3-kp3+1,3))
numgqtests <- 0
numsignificant1 <- 0
numsignificant5 <- 0
numsignificant10 <- 0
for (mypoint in kp3:nmkm3) {
j <- 0
numgqtests <- numgqtests + 1
for (myalt in c('greater', 'two.sided', 'less')) {
j <- j + 1
gqarr[mypoint-kp3+1,j] <- gqtest(mylm, point=mypoint, alternative=myalt)$p.value
}
if (gqarr[mypoint-kp3+1,2] < 0.01) numsignificant1 <- numsignificant1 + 1
if (gqarr[mypoint-kp3+1,2] < 0.05) numsignificant5 <- numsignificant5 + 1
if (gqarr[mypoint-kp3+1,2] < 0.10) numsignificant10 <- numsignificant10 + 1
}
gqarr
}
bitmap(file='test0.png')
plot(x[,1], type='l', main='Actuals and Interpolation', ylab='value of Actuals and Interpolation (dots)', xlab='time or index')
points(x[,1]-mysum$resid)
grid()
dev.off()
bitmap(file='test1.png')
plot(mysum$resid, type='b', pch=19, main='Residuals', ylab='value of Residuals', xlab='time or index')
grid()
dev.off()
bitmap(file='test2.png')
hist(mysum$resid, main='Residual Histogram', xlab='values of Residuals')
grid()
dev.off()
bitmap(file='test3.png')
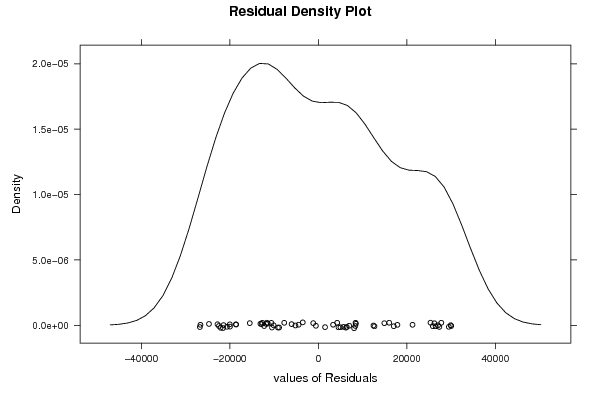
densityplot(~mysum$resid,col='black',main='Residual Density Plot', xlab='values of Residuals')
dev.off()
bitmap(file='test4.png')
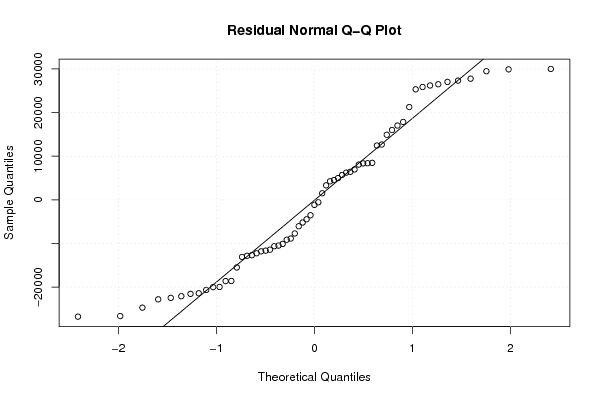
qqnorm(mysum$resid, main='Residual Normal Q-Q Plot')
qqline(mysum$resid)
grid()
dev.off()
(myerror <- as.ts(mysum$resid))
bitmap(file='test5.png')
dum <- cbind(lag(myerror,k=1),myerror)
dum
dum1 <- dum[2:length(myerror),]
dum1
z <- as.data.frame(dum1)
z
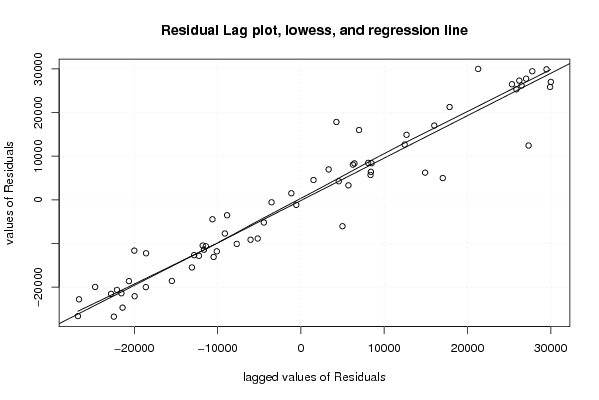
plot(z,main=paste('Residual Lag plot, lowess, and regression line'), ylab='values of Residuals', xlab='lagged values of Residuals')
lines(lowess(z))
abline(lm(z))
grid()
dev.off()
bitmap(file='test6.png')
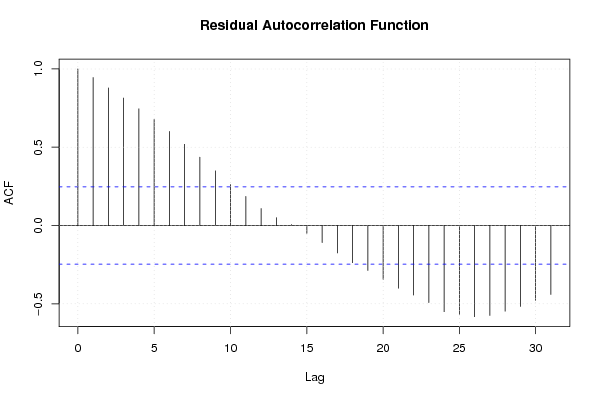
acf(mysum$resid, lag.max=length(mysum$resid)/2, main='Residual Autocorrelation Function')
grid()
dev.off()
bitmap(file='test7.png')
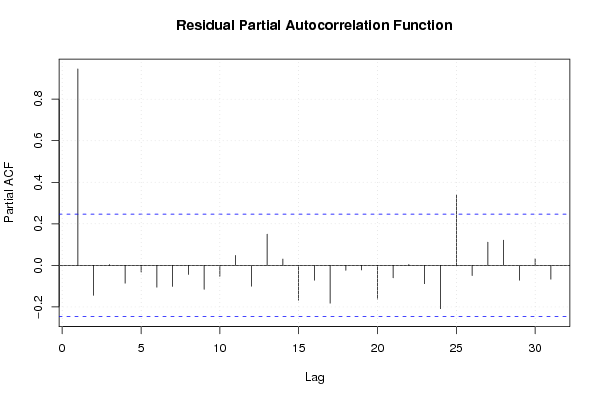
pacf(mysum$resid, lag.max=length(mysum$resid)/2, main='Residual Partial Autocorrelation Function')
grid()
dev.off()
bitmap(file='test8.png')
opar <- par(mfrow = c(2,2), oma = c(0, 0, 1.1, 0))
plot(mylm, las = 1, sub='Residual Diagnostics')
par(opar)
dev.off()
if (n > n25) {
bitmap(file='test9.png')
plot(kp3:nmkm3,gqarr[,2], main='Goldfeld-Quandt test',ylab='2-sided p-value',xlab='breakpoint')
grid()
dev.off()
}
load(file='createtable')
a<-table.start()
a<-table.row.start(a)
a<-table.element(a, 'Multiple Linear Regression - Estimated Regression Equation', 1, TRUE)
a<-table.row.end(a)
myeq <- colnames(x)[1]
myeq <- paste(myeq, '[t] = ', sep='')
for (i in 1:k){
if (mysum$coefficients[i,1] > 0) myeq <- paste(myeq, '+', '')
myeq <- paste(myeq, mysum$coefficients[i,1], sep=' ')
if (rownames(mysum$coefficients)[i] != '(Intercept)') {
myeq <- paste(myeq, rownames(mysum$coefficients)[i], sep='')
if (rownames(mysum$coefficients)[i] != 't') myeq <- paste(myeq, '[t]', sep='')
}
}
myeq <- paste(myeq, ' + e[t]')
a<-table.row.start(a)
a<-table.element(a, myeq)
a<-table.row.end(a)
a<-table.end(a)
table.save(a,file='mytable1.tab')
a<-table.start()
a<-table.row.start(a)
a<-table.element(a,hyperlink('ols1.htm','Multiple Linear Regression - Ordinary Least Squares',''), 6, TRUE)
a<-table.row.end(a)
a<-table.row.start(a)
a<-table.element(a,'Variable',header=TRUE)
a<-table.element(a,'Parameter',header=TRUE)
a<-table.element(a,'S.D.',header=TRUE)
a<-table.element(a,'T-STAT
H0: parameter = 0',header=TRUE)
a<-table.element(a,'2-tail p-value',header=TRUE)
a<-table.element(a,'1-tail p-value',header=TRUE)
a<-table.row.end(a)
for (i in 1:k){
a<-table.row.start(a)
a<-table.element(a,rownames(mysum$coefficients)[i],header=TRUE)
a<-table.element(a,mysum$coefficients[i,1])
a<-table.element(a, round(mysum$coefficients[i,2],6))
a<-table.element(a, round(mysum$coefficients[i,3],4))
a<-table.element(a, round(mysum$coefficients[i,4],6))
a<-table.element(a, round(mysum$coefficients[i,4]/2,6))
a<-table.row.end(a)
}
a<-table.end(a)
table.save(a,file='mytable2.tab')
a<-table.start()
a<-table.row.start(a)
a<-table.element(a, 'Multiple Linear Regression - Regression Statistics', 2, TRUE)
a<-table.row.end(a)
a<-table.row.start(a)
a<-table.element(a, 'Multiple R',1,TRUE)
a<-table.element(a, sqrt(mysum$r.squared))
a<-table.row.end(a)
a<-table.row.start(a)
a<-table.element(a, 'R-squared',1,TRUE)
a<-table.element(a, mysum$r.squared)
a<-table.row.end(a)
a<-table.row.start(a)
a<-table.element(a, 'Adjusted R-squared',1,TRUE)
a<-table.element(a, mysum$adj.r.squared)
a<-table.row.end(a)
a<-table.row.start(a)
a<-table.element(a, 'F-TEST (value)',1,TRUE)
a<-table.element(a, mysum$fstatistic[1])
a<-table.row.end(a)
a<-table.row.start(a)
a<-table.element(a, 'F-TEST (DF numerator)',1,TRUE)
a<-table.element(a, mysum$fstatistic[2])
a<-table.row.end(a)
a<-table.row.start(a)
a<-table.element(a, 'F-TEST (DF denominator)',1,TRUE)
a<-table.element(a, mysum$fstatistic[3])
a<-table.row.end(a)
a<-table.row.start(a)
a<-table.element(a, 'p-value',1,TRUE)
a<-table.element(a, 1-pf(mysum$fstatistic[1],mysum$fstatistic[2],mysum$fstatistic[3]))
a<-table.row.end(a)
a<-table.row.start(a)
a<-table.element(a, 'Multiple Linear Regression - Residual Statistics', 2, TRUE)
a<-table.row.end(a)
a<-table.row.start(a)
a<-table.element(a, 'Residual Standard Deviation',1,TRUE)
a<-table.element(a, mysum$sigma)
a<-table.row.end(a)
a<-table.row.start(a)
a<-table.element(a, 'Sum Squared Residuals',1,TRUE)
a<-table.element(a, sum(myerror*myerror))
a<-table.row.end(a)
a<-table.end(a)
table.save(a,file='mytable3.tab')
a<-table.start()
a<-table.row.start(a)
a<-table.element(a, 'Multiple Linear Regression - Actuals, Interpolation, and Residuals', 4, TRUE)
a<-table.row.end(a)
a<-table.row.start(a)
a<-table.element(a, 'Time or Index', 1, TRUE)
a<-table.element(a, 'Actuals', 1, TRUE)
a<-table.element(a, 'Interpolation
Forecast', 1, TRUE)
a<-table.element(a, 'Residuals
Prediction Error', 1, TRUE)
a<-table.row.end(a)
for (i in 1:n) {
a<-table.row.start(a)
a<-table.element(a,i, 1, TRUE)
a<-table.element(a,x[i])
a<-table.element(a,x[i]-mysum$resid[i])
a<-table.element(a,mysum$resid[i])
a<-table.row.end(a)
}
a<-table.end(a)
table.save(a,file='mytable4.tab')
if (n > n25) {
a<-table.start()
a<-table.row.start(a)
a<-table.element(a,'Goldfeld-Quandt test for Heteroskedasticity',4,TRUE)
a<-table.row.end(a)
a<-table.row.start(a)
a<-table.element(a,'p-values',header=TRUE)
a<-table.element(a,'Alternative Hypothesis',3,header=TRUE)
a<-table.row.end(a)
a<-table.row.start(a)
a<-table.element(a,'breakpoint index',header=TRUE)
a<-table.element(a,'greater',header=TRUE)
a<-table.element(a,'2-sided',header=TRUE)
a<-table.element(a,'less',header=TRUE)
a<-table.row.end(a)
for (mypoint in kp3:nmkm3) {
a<-table.row.start(a)
a<-table.element(a,mypoint,header=TRUE)
a<-table.element(a,gqarr[mypoint-kp3+1,1])
a<-table.element(a,gqarr[mypoint-kp3+1,2])
a<-table.element(a,gqarr[mypoint-kp3+1,3])
a<-table.row.end(a)
}
a<-table.end(a)
table.save(a,file='mytable5.tab')
a<-table.start()
a<-table.row.start(a)
a<-table.element(a,'Meta Analysis of Goldfeld-Quandt test for Heteroskedasticity',4,TRUE)
a<-table.row.end(a)
a<-table.row.start(a)
a<-table.element(a,'Description',header=TRUE)
a<-table.element(a,'# significant tests',header=TRUE)
a<-table.element(a,'% significant tests',header=TRUE)
a<-table.element(a,'OK/NOK',header=TRUE)
a<-table.row.end(a)
a<-table.row.start(a)
a<-table.element(a,'1% type I error level',header=TRUE)
a<-table.element(a,numsignificant1)
a<-table.element(a,numsignificant1/numgqtests)
if (numsignificant1/numgqtests < 0.01) dum <- 'OK' else dum <- 'NOK'
a<-table.element(a,dum)
a<-table.row.end(a)
a<-table.row.start(a)
a<-table.element(a,'5% type I error level',header=TRUE)
a<-table.element(a,numsignificant5)
a<-table.element(a,numsignificant5/numgqtests)
if (numsignificant5/numgqtests < 0.05) dum <- 'OK' else dum <- 'NOK'
a<-table.element(a,dum)
a<-table.row.end(a)
a<-table.row.start(a)
a<-table.element(a,'10% type I error level',header=TRUE)
a<-table.element(a,numsignificant10)
a<-table.element(a,numsignificant10/numgqtests)
if (numsignificant10/numgqtests < 0.1) dum <- 'OK' else dum <- 'NOK'
a<-table.element(a,dum)
a<-table.row.end(a)
a<-table.end(a)
table.save(a,file='mytable6.tab')
}