Free Statistics

of Irreproducible Research!

Author's title

Author*Unverified author*
R Software Modulerwasp_arimaforecasting.wasp
Title produced by softwareARIMA Forecasting
Date of computationTue, 16 Dec 2008 13:58:56 -0700
Cite this page as followsStatistical Computations at FreeStatistics.org, Office for Research Development and Education, URL https://freestatistics.org/blog/index.php?v=date/2008/Dec/16/t1229461176iz3b1t271g2n3nr.htm/, Retrieved Wed, 15 May 2024 23:26:25 +0000
Statistical Computations at FreeStatistics.org, Office for Research Development and Education, URL https://freestatistics.org/blog/index.php?pk=34200, Retrieved Wed, 15 May 2024 23:26:25 +0000
QR Codes:

Original text written by user:
IsPrivate?No (this computation is public)
User-defined keywords
Estimated Impact160
Family? (F = Feedback message, R = changed R code, M = changed R Module, P = changed Parameters, D = changed Data)
F       [ARIMA Forecasting] [step 4] [2008-12-16 20:58:56] [4feaea4b7a1dc404ed7b3613ea3a9f56] [Current]
Feedback Forum
2008-12-18 11:53:33 [72e979bcc364082694890d2eccc1a66f] [reply
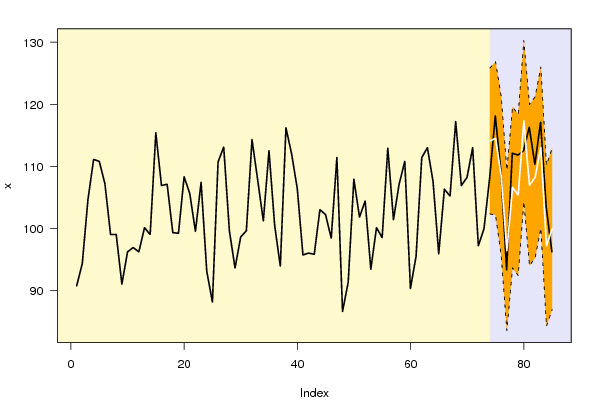
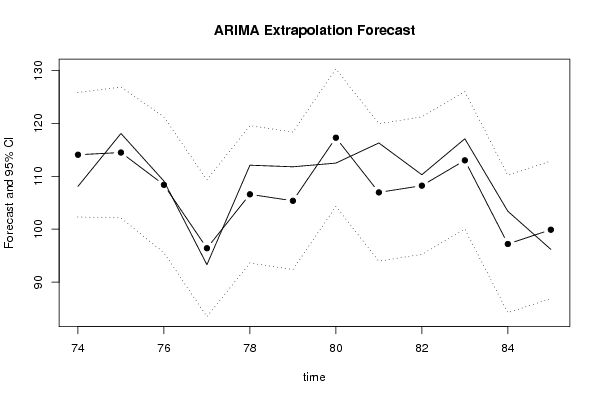
Voor stap 4 moet je naar de laatste 3 kolommen kijken van de eerste tabel. Het model dat berekend wordt, gaat uit van een normaalverdeling. Alle residu’s moeten normaal verdeeld zijn. Dit kun je zien door te kijken naar de density plot, de QQ-plot,... van de residu’s die in de vorige workshop berekend zijn. Zo kun je zien of deze assumptie vervuld is. Wanneer dit niet het geval blijkt te zijn, zullen de p-waarde, de waarschijnlijkheden,... anders zijn omdat het model van een normaalverdeling uitgaat.
2008-12-19 12:03:04 [006ad2c49b6a7c2ad6ab685cfc1dae56] [reply
De vorige student heeft de juiste uitleg gegeven.
2008-12-24 09:11:36 [Sofie Mertens] [reply
Deze vraag werd niet goed beantwoord. Hier moest men de 3 laatste kolommen van de 1ste tabel bekijken en bespreken. Wat is de kans op een stijging tov de vorige periode/vorig jaar/de laatst gekende waarde?

Post a new message
Dataseries X:
90.7
94.3
104.6
111.1
110.8
107.2
99
99
91
96.2
96.9
96.2
100.1
99
115.4
106.9
107.1
99.3
99.2
108.3
105.6
99.5
107.4
93.1
88.1
110.7
113.1
99.6
93.6
98.6
99.6
114.3
107.8
101.2
112.5
100.5
93.9
116.2
112
106.4
95.7
96
95.8
103
102.2
98.4
111.4
86.6
91.3
107.9
101.8
104.4
93.4
100.1
98.5
112.9
101.4
107.1
110.8
90.3
95.5
111.4
113
107.5
95.9
106.3
105.2
117.2
106.9
108.2
113
97.2
99.9
108.1
118.1
109.1
93.3
112.1
111.8
112.5
116.3
110.3
117.1
103.4
96.2


Summary of computational transaction
Raw Inputview raw input (R code)
Raw Outputview raw output of R engine
Computing time1 seconds
R Server'George Udny Yule' @ 72.249.76.132

\begin{tabular}{lllllllll}
\hline
Summary of computational transaction \tabularnewline
Raw Input & view raw input (R code)  \tabularnewline
Raw Output & view raw output of R engine  \tabularnewline
Computing time & 1 seconds \tabularnewline
R Server & 'George Udny Yule' @ 72.249.76.132 \tabularnewline
\hline
\end{tabular}
%Source: https://freestatistics.org/blog/index.php?pk=34200&T=0

[TABLE]
[ROW][C]Summary of computational transaction[/C][/ROW]
[ROW][C]Raw Input[/C][C]view raw input (R code) [/C][/ROW]
[ROW][C]Raw Output[/C][C]view raw output of R engine [/C][/ROW]
[ROW][C]Computing time[/C][C]1 seconds[/C][/ROW]
[ROW][C]R Server[/C][C]'George Udny Yule' @ 72.249.76.132[/C][/ROW]
[/TABLE]
Source: https://freestatistics.org/blog/index.php?pk=34200&T=0

Globally Unique Identifier (entire table): ba.freestatistics.org/blog/index.php?pk=34200&T=0

As an alternative you can also use a QR Code:  

The GUIDs for individual cells are displayed in the table below:

Summary of computational transaction
Raw Inputview raw input (R code)
Raw Outputview raw output of R engine
Computing time1 seconds
R Server'George Udny Yule' @ 72.249.76.132


Univariate ARIMA Extrapolation Forecast
timeY[t]F[t]95% LB95% UBp-value(H0: Y[t] = F[t])P(F[t]>Y[t-1])P(F[t]>Y[t-s])P(F[t]>Y[73])
6195.5-------
62111.4-------
63113-------
64107.5-------
6595.9-------
66106.3-------
67105.2-------
68117.2-------
69106.9-------
70108.2-------
71113-------
7297.2-------
7399.9-------
74108.1114.0776102.3151125.84010.15960.99090.67230.9909
75118.1114.4976102.1339126.86130.2840.84480.59380.9897
76109.1108.391195.5445121.23770.45690.06930.55410.9024
7793.396.406683.4755109.33770.31890.02720.53060.2982
78112.1106.597893.621119.57460.2030.97770.51790.8441
79111.8105.370892.3831118.35850.1660.15490.51030.7955
80112.5117.2998104.3074130.29220.23450.79660.5060.9957
81116.3106.957593.9638119.95120.07940.20160.50350.8565
82110.3108.233595.2392121.22770.37760.11190.5020.8956
83117.1113.0193100.0249126.01370.26910.65920.50120.9761
84103.497.211284.2168110.20570.17530.00140.50070.3425
8596.299.906586.912112.9010.28810.29910.50040.5004

\begin{tabular}{lllllllll}
\hline
Univariate ARIMA Extrapolation Forecast \tabularnewline
time & Y[t] & F[t] & 95% LB & 95% UB & p-value(H0: Y[t] = F[t]) & P(F[t]>Y[t-1]) & P(F[t]>Y[t-s]) & P(F[t]>Y[73]) \tabularnewline
61 & 95.5 & - & - & - & - & - & - & - \tabularnewline
62 & 111.4 & - & - & - & - & - & - & - \tabularnewline
63 & 113 & - & - & - & - & - & - & - \tabularnewline
64 & 107.5 & - & - & - & - & - & - & - \tabularnewline
65 & 95.9 & - & - & - & - & - & - & - \tabularnewline
66 & 106.3 & - & - & - & - & - & - & - \tabularnewline
67 & 105.2 & - & - & - & - & - & - & - \tabularnewline
68 & 117.2 & - & - & - & - & - & - & - \tabularnewline
69 & 106.9 & - & - & - & - & - & - & - \tabularnewline
70 & 108.2 & - & - & - & - & - & - & - \tabularnewline
71 & 113 & - & - & - & - & - & - & - \tabularnewline
72 & 97.2 & - & - & - & - & - & - & - \tabularnewline
73 & 99.9 & - & - & - & - & - & - & - \tabularnewline
74 & 108.1 & 114.0776 & 102.3151 & 125.8401 & 0.1596 & 0.9909 & 0.6723 & 0.9909 \tabularnewline
75 & 118.1 & 114.4976 & 102.1339 & 126.8613 & 0.284 & 0.8448 & 0.5938 & 0.9897 \tabularnewline
76 & 109.1 & 108.3911 & 95.5445 & 121.2377 & 0.4569 & 0.0693 & 0.5541 & 0.9024 \tabularnewline
77 & 93.3 & 96.4066 & 83.4755 & 109.3377 & 0.3189 & 0.0272 & 0.5306 & 0.2982 \tabularnewline
78 & 112.1 & 106.5978 & 93.621 & 119.5746 & 0.203 & 0.9777 & 0.5179 & 0.8441 \tabularnewline
79 & 111.8 & 105.3708 & 92.3831 & 118.3585 & 0.166 & 0.1549 & 0.5103 & 0.7955 \tabularnewline
80 & 112.5 & 117.2998 & 104.3074 & 130.2922 & 0.2345 & 0.7966 & 0.506 & 0.9957 \tabularnewline
81 & 116.3 & 106.9575 & 93.9638 & 119.9512 & 0.0794 & 0.2016 & 0.5035 & 0.8565 \tabularnewline
82 & 110.3 & 108.2335 & 95.2392 & 121.2277 & 0.3776 & 0.1119 & 0.502 & 0.8956 \tabularnewline
83 & 117.1 & 113.0193 & 100.0249 & 126.0137 & 0.2691 & 0.6592 & 0.5012 & 0.9761 \tabularnewline
84 & 103.4 & 97.2112 & 84.2168 & 110.2057 & 0.1753 & 0.0014 & 0.5007 & 0.3425 \tabularnewline
85 & 96.2 & 99.9065 & 86.912 & 112.901 & 0.2881 & 0.2991 & 0.5004 & 0.5004 \tabularnewline
\hline
\end{tabular}
%Source: https://freestatistics.org/blog/index.php?pk=34200&T=1

[TABLE]
[ROW][C]Univariate ARIMA Extrapolation Forecast[/C][/ROW]
[ROW][C]time[/C][C]Y[t][/C][C]F[t][/C][C]95% LB[/C][C]95% UB[/C][C]p-value(H0: Y[t] = F[t])[/C][C]P(F[t]>Y[t-1])[/C][C]P(F[t]>Y[t-s])[/C][C]P(F[t]>Y[73])[/C][/ROW]
[ROW][C]61[/C][C]95.5[/C][C]-[/C][C]-[/C][C]-[/C][C]-[/C][C]-[/C][C]-[/C][C]-[/C][/ROW]
[ROW][C]62[/C][C]111.4[/C][C]-[/C][C]-[/C][C]-[/C][C]-[/C][C]-[/C][C]-[/C][C]-[/C][/ROW]
[ROW][C]63[/C][C]113[/C][C]-[/C][C]-[/C][C]-[/C][C]-[/C][C]-[/C][C]-[/C][C]-[/C][/ROW]
[ROW][C]64[/C][C]107.5[/C][C]-[/C][C]-[/C][C]-[/C][C]-[/C][C]-[/C][C]-[/C][C]-[/C][/ROW]
[ROW][C]65[/C][C]95.9[/C][C]-[/C][C]-[/C][C]-[/C][C]-[/C][C]-[/C][C]-[/C][C]-[/C][/ROW]
[ROW][C]66[/C][C]106.3[/C][C]-[/C][C]-[/C][C]-[/C][C]-[/C][C]-[/C][C]-[/C][C]-[/C][/ROW]
[ROW][C]67[/C][C]105.2[/C][C]-[/C][C]-[/C][C]-[/C][C]-[/C][C]-[/C][C]-[/C][C]-[/C][/ROW]
[ROW][C]68[/C][C]117.2[/C][C]-[/C][C]-[/C][C]-[/C][C]-[/C][C]-[/C][C]-[/C][C]-[/C][/ROW]
[ROW][C]69[/C][C]106.9[/C][C]-[/C][C]-[/C][C]-[/C][C]-[/C][C]-[/C][C]-[/C][C]-[/C][/ROW]
[ROW][C]70[/C][C]108.2[/C][C]-[/C][C]-[/C][C]-[/C][C]-[/C][C]-[/C][C]-[/C][C]-[/C][/ROW]
[ROW][C]71[/C][C]113[/C][C]-[/C][C]-[/C][C]-[/C][C]-[/C][C]-[/C][C]-[/C][C]-[/C][/ROW]
[ROW][C]72[/C][C]97.2[/C][C]-[/C][C]-[/C][C]-[/C][C]-[/C][C]-[/C][C]-[/C][C]-[/C][/ROW]
[ROW][C]73[/C][C]99.9[/C][C]-[/C][C]-[/C][C]-[/C][C]-[/C][C]-[/C][C]-[/C][C]-[/C][/ROW]
[ROW][C]74[/C][C]108.1[/C][C]114.0776[/C][C]102.3151[/C][C]125.8401[/C][C]0.1596[/C][C]0.9909[/C][C]0.6723[/C][C]0.9909[/C][/ROW]
[ROW][C]75[/C][C]118.1[/C][C]114.4976[/C][C]102.1339[/C][C]126.8613[/C][C]0.284[/C][C]0.8448[/C][C]0.5938[/C][C]0.9897[/C][/ROW]
[ROW][C]76[/C][C]109.1[/C][C]108.3911[/C][C]95.5445[/C][C]121.2377[/C][C]0.4569[/C][C]0.0693[/C][C]0.5541[/C][C]0.9024[/C][/ROW]
[ROW][C]77[/C][C]93.3[/C][C]96.4066[/C][C]83.4755[/C][C]109.3377[/C][C]0.3189[/C][C]0.0272[/C][C]0.5306[/C][C]0.2982[/C][/ROW]
[ROW][C]78[/C][C]112.1[/C][C]106.5978[/C][C]93.621[/C][C]119.5746[/C][C]0.203[/C][C]0.9777[/C][C]0.5179[/C][C]0.8441[/C][/ROW]
[ROW][C]79[/C][C]111.8[/C][C]105.3708[/C][C]92.3831[/C][C]118.3585[/C][C]0.166[/C][C]0.1549[/C][C]0.5103[/C][C]0.7955[/C][/ROW]
[ROW][C]80[/C][C]112.5[/C][C]117.2998[/C][C]104.3074[/C][C]130.2922[/C][C]0.2345[/C][C]0.7966[/C][C]0.506[/C][C]0.9957[/C][/ROW]
[ROW][C]81[/C][C]116.3[/C][C]106.9575[/C][C]93.9638[/C][C]119.9512[/C][C]0.0794[/C][C]0.2016[/C][C]0.5035[/C][C]0.8565[/C][/ROW]
[ROW][C]82[/C][C]110.3[/C][C]108.2335[/C][C]95.2392[/C][C]121.2277[/C][C]0.3776[/C][C]0.1119[/C][C]0.502[/C][C]0.8956[/C][/ROW]
[ROW][C]83[/C][C]117.1[/C][C]113.0193[/C][C]100.0249[/C][C]126.0137[/C][C]0.2691[/C][C]0.6592[/C][C]0.5012[/C][C]0.9761[/C][/ROW]
[ROW][C]84[/C][C]103.4[/C][C]97.2112[/C][C]84.2168[/C][C]110.2057[/C][C]0.1753[/C][C]0.0014[/C][C]0.5007[/C][C]0.3425[/C][/ROW]
[ROW][C]85[/C][C]96.2[/C][C]99.9065[/C][C]86.912[/C][C]112.901[/C][C]0.2881[/C][C]0.2991[/C][C]0.5004[/C][C]0.5004[/C][/ROW]
[/TABLE]
Source: https://freestatistics.org/blog/index.php?pk=34200&T=1

Globally Unique Identifier (entire table): ba.freestatistics.org/blog/index.php?pk=34200&T=1

As an alternative you can also use a QR Code:  

The GUIDs for individual cells are displayed in the table below:

Univariate ARIMA Extrapolation Forecast
timeY[t]F[t]95% LB95% UBp-value(H0: Y[t] = F[t])P(F[t]>Y[t-1])P(F[t]>Y[t-s])P(F[t]>Y[73])
6195.5-------
62111.4-------
63113-------
64107.5-------
6595.9-------
66106.3-------
67105.2-------
68117.2-------
69106.9-------
70108.2-------
71113-------
7297.2-------
7399.9-------
74108.1114.0776102.3151125.84010.15960.99090.67230.9909
75118.1114.4976102.1339126.86130.2840.84480.59380.9897
76109.1108.391195.5445121.23770.45690.06930.55410.9024
7793.396.406683.4755109.33770.31890.02720.53060.2982
78112.1106.597893.621119.57460.2030.97770.51790.8441
79111.8105.370892.3831118.35850.1660.15490.51030.7955
80112.5117.2998104.3074130.29220.23450.79660.5060.9957
81116.3106.957593.9638119.95120.07940.20160.50350.8565
82110.3108.233595.2392121.22770.37760.11190.5020.8956
83117.1113.0193100.0249126.01370.26910.65920.50120.9761
84103.497.211284.2168110.20570.17530.00140.50070.3425
8596.299.906586.912112.9010.28810.29910.50040.5004


Univariate ARIMA Extrapolation Forecast Performance
time% S.E.PEMAPESq.EMSERMSE
740.0526-0.05240.004435.73172.97761.7256
750.05510.03150.002612.97731.08141.0399
760.06050.00655e-040.50250.04190.2046
770.0684-0.03220.00279.65110.80430.8968
780.06210.05160.004330.2742.52281.5883
790.06290.0610.005141.33433.44451.8559
800.0565-0.04090.003423.03781.91981.3856
810.0620.08730.007387.28237.27352.6969
820.06130.01910.00164.27060.35590.5966
830.05870.03610.00316.65181.38771.178
840.06820.06370.005338.30093.19171.7865
850.0664-0.03710.003113.73811.14481.07

\begin{tabular}{lllllllll}
\hline
Univariate ARIMA Extrapolation Forecast Performance \tabularnewline
time & % S.E. & PE & MAPE & Sq.E & MSE & RMSE \tabularnewline
74 & 0.0526 & -0.0524 & 0.0044 & 35.7317 & 2.9776 & 1.7256 \tabularnewline
75 & 0.0551 & 0.0315 & 0.0026 & 12.9773 & 1.0814 & 1.0399 \tabularnewline
76 & 0.0605 & 0.0065 & 5e-04 & 0.5025 & 0.0419 & 0.2046 \tabularnewline
77 & 0.0684 & -0.0322 & 0.0027 & 9.6511 & 0.8043 & 0.8968 \tabularnewline
78 & 0.0621 & 0.0516 & 0.0043 & 30.274 & 2.5228 & 1.5883 \tabularnewline
79 & 0.0629 & 0.061 & 0.0051 & 41.3343 & 3.4445 & 1.8559 \tabularnewline
80 & 0.0565 & -0.0409 & 0.0034 & 23.0378 & 1.9198 & 1.3856 \tabularnewline
81 & 0.062 & 0.0873 & 0.0073 & 87.2823 & 7.2735 & 2.6969 \tabularnewline
82 & 0.0613 & 0.0191 & 0.0016 & 4.2706 & 0.3559 & 0.5966 \tabularnewline
83 & 0.0587 & 0.0361 & 0.003 & 16.6518 & 1.3877 & 1.178 \tabularnewline
84 & 0.0682 & 0.0637 & 0.0053 & 38.3009 & 3.1917 & 1.7865 \tabularnewline
85 & 0.0664 & -0.0371 & 0.0031 & 13.7381 & 1.1448 & 1.07 \tabularnewline
\hline
\end{tabular}
%Source: https://freestatistics.org/blog/index.php?pk=34200&T=2

[TABLE]
[ROW][C]Univariate ARIMA Extrapolation Forecast Performance[/C][/ROW]
[ROW][C]time[/C][C]% S.E.[/C][C]PE[/C][C]MAPE[/C][C]Sq.E[/C][C]MSE[/C][C]RMSE[/C][/ROW]
[ROW][C]74[/C][C]0.0526[/C][C]-0.0524[/C][C]0.0044[/C][C]35.7317[/C][C]2.9776[/C][C]1.7256[/C][/ROW]
[ROW][C]75[/C][C]0.0551[/C][C]0.0315[/C][C]0.0026[/C][C]12.9773[/C][C]1.0814[/C][C]1.0399[/C][/ROW]
[ROW][C]76[/C][C]0.0605[/C][C]0.0065[/C][C]5e-04[/C][C]0.5025[/C][C]0.0419[/C][C]0.2046[/C][/ROW]
[ROW][C]77[/C][C]0.0684[/C][C]-0.0322[/C][C]0.0027[/C][C]9.6511[/C][C]0.8043[/C][C]0.8968[/C][/ROW]
[ROW][C]78[/C][C]0.0621[/C][C]0.0516[/C][C]0.0043[/C][C]30.274[/C][C]2.5228[/C][C]1.5883[/C][/ROW]
[ROW][C]79[/C][C]0.0629[/C][C]0.061[/C][C]0.0051[/C][C]41.3343[/C][C]3.4445[/C][C]1.8559[/C][/ROW]
[ROW][C]80[/C][C]0.0565[/C][C]-0.0409[/C][C]0.0034[/C][C]23.0378[/C][C]1.9198[/C][C]1.3856[/C][/ROW]
[ROW][C]81[/C][C]0.062[/C][C]0.0873[/C][C]0.0073[/C][C]87.2823[/C][C]7.2735[/C][C]2.6969[/C][/ROW]
[ROW][C]82[/C][C]0.0613[/C][C]0.0191[/C][C]0.0016[/C][C]4.2706[/C][C]0.3559[/C][C]0.5966[/C][/ROW]
[ROW][C]83[/C][C]0.0587[/C][C]0.0361[/C][C]0.003[/C][C]16.6518[/C][C]1.3877[/C][C]1.178[/C][/ROW]
[ROW][C]84[/C][C]0.0682[/C][C]0.0637[/C][C]0.0053[/C][C]38.3009[/C][C]3.1917[/C][C]1.7865[/C][/ROW]
[ROW][C]85[/C][C]0.0664[/C][C]-0.0371[/C][C]0.0031[/C][C]13.7381[/C][C]1.1448[/C][C]1.07[/C][/ROW]
[/TABLE]
Source: https://freestatistics.org/blog/index.php?pk=34200&T=2

Globally Unique Identifier (entire table): ba.freestatistics.org/blog/index.php?pk=34200&T=2

As an alternative you can also use a QR Code:  

The GUIDs for individual cells are displayed in the table below:

Univariate ARIMA Extrapolation Forecast Performance
time% S.E.PEMAPESq.EMSERMSE
740.0526-0.05240.004435.73172.97761.7256
750.05510.03150.002612.97731.08141.0399
760.06050.00655e-040.50250.04190.2046
770.0684-0.03220.00279.65110.80430.8968
780.06210.05160.004330.2742.52281.5883
790.06290.0610.005141.33433.44451.8559
800.0565-0.04090.003423.03781.91981.3856
810.0620.08730.007387.28237.27352.6969
820.06130.01910.00164.27060.35590.5966
830.05870.03610.00316.65181.38771.178
840.06820.06370.005338.30093.19171.7865
850.0664-0.03710.003113.73811.14481.07


Parameters (Session):
par1 = 12 ; par2 = 1.0 ; par3 = 0 ; par4 = 1 ; par5 = 12 ; par6 = 2 ; par7 = 1 ; par8 = 0 ; par9 = 0 ; par10 = FALSE ;
Parameters (R input):
par1 = 12 ; par2 = 1.0 ; par3 = 0 ; par4 = 1 ; par5 = 12 ; par6 = 2 ; par7 = 1 ; par8 = 0 ; par9 = 0 ; par10 = FALSE ;
R code (references can be found in the software module):
par1 <- as.numeric(par1) #cut off periods
par2 <- as.numeric(par2) #lambda
par3 <- as.numeric(par3) #degree of non-seasonal differencing
par4 <- as.numeric(par4) #degree of seasonal differencing
par5 <- as.numeric(par5) #seasonal period
par6 <- as.numeric(par6) #p
par7 <- as.numeric(par7) #q
par8 <- as.numeric(par8) #P
par9 <- as.numeric(par9) #Q
if (par10 == 'TRUE') par10 <- TRUE
if (par10 == 'FALSE') par10 <- FALSE
if (par2 == 0) x <- log(x)
if (par2 != 0) x <- x^par2
lx <- length(x)
first <- lx - 2*par1
nx <- lx - par1
nx1 <- nx + 1
fx <- lx - nx
if (fx < 1) {
fx <- par5
nx1 <- lx + fx - 1
first <- lx - 2*fx
}
first <- 1
if (fx < 3) fx <- round(lx/10,0)
(arima.out <- arima(x[1:nx], order=c(par6,par3,par7), seasonal=list(order=c(par8,par4,par9), period=par5), include.mean=par10, method='ML'))
(forecast <- predict(arima.out,fx))
(lb <- forecast$pred - 1.96 * forecast$se)
(ub <- forecast$pred + 1.96 * forecast$se)
if (par2 == 0) {
x <- exp(x)
forecast$pred <- exp(forecast$pred)
lb <- exp(lb)
ub <- exp(ub)
}
if (par2 != 0) {
x <- x^(1/par2)
forecast$pred <- forecast$pred^(1/par2)
lb <- lb^(1/par2)
ub <- ub^(1/par2)
}
if (par2 < 0) {
olb <- lb
lb <- ub
ub <- olb
}
(actandfor <- c(x[1:nx], forecast$pred))
(perc.se <- (ub-forecast$pred)/1.96/forecast$pred)
bitmap(file='test1.png')
opar <- par(mar=c(4,4,2,2),las=1)
ylim <- c( min(x[first:nx],lb), max(x[first:nx],ub))
plot(x,ylim=ylim,type='n',xlim=c(first,lx))
usr <- par('usr')
rect(usr[1],usr[3],nx+1,usr[4],border=NA,col='lemonchiffon')
rect(nx1,usr[3],usr[2],usr[4],border=NA,col='lavender')
abline(h= (-3:3)*2 , col ='gray', lty =3)
polygon( c(nx1:lx,lx:nx1), c(lb,rev(ub)), col = 'orange', lty=2,border=NA)
lines(nx1:lx, lb , lty=2)
lines(nx1:lx, ub , lty=2)
lines(x, lwd=2)
lines(nx1:lx, forecast$pred , lwd=2 , col ='white')
box()
par(opar)
dev.off()
prob.dec <- array(NA, dim=fx)
prob.sdec <- array(NA, dim=fx)
prob.ldec <- array(NA, dim=fx)
prob.pval <- array(NA, dim=fx)
perf.pe <- array(0, dim=fx)
perf.mape <- array(0, dim=fx)
perf.se <- array(0, dim=fx)
perf.mse <- array(0, dim=fx)
perf.rmse <- array(0, dim=fx)
for (i in 1:fx) {
locSD <- (ub[i] - forecast$pred[i]) / 1.96
perf.pe[i] = (x[nx+i] - forecast$pred[i]) / forecast$pred[i]
perf.mape[i] = perf.mape[i] + abs(perf.pe[i])
perf.se[i] = (x[nx+i] - forecast$pred[i])^2
perf.mse[i] = perf.mse[i] + perf.se[i]
prob.dec[i] = pnorm((x[nx+i-1] - forecast$pred[i]) / locSD)
prob.sdec[i] = pnorm((x[nx+i-par5] - forecast$pred[i]) / locSD)
prob.ldec[i] = pnorm((x[nx] - forecast$pred[i]) / locSD)
prob.pval[i] = pnorm(abs(x[nx+i] - forecast$pred[i]) / locSD)
}
perf.mape = perf.mape / fx
perf.mse = perf.mse / fx
perf.rmse = sqrt(perf.mse)
bitmap(file='test2.png')
plot(forecast$pred, pch=19, type='b',main='ARIMA Extrapolation Forecast', ylab='Forecast and 95% CI', xlab='time',ylim=c(min(lb),max(ub)))
dum <- forecast$pred
dum[1:12] <- x[(nx+1):lx]
lines(dum, lty=1)
lines(ub,lty=3)
lines(lb,lty=3)
dev.off()
load(file='createtable')
a<-table.start()
a<-table.row.start(a)
a<-table.element(a,'Univariate ARIMA Extrapolation Forecast',9,TRUE)
a<-table.row.end(a)
a<-table.row.start(a)
a<-table.element(a,'time',1,header=TRUE)
a<-table.element(a,'Y[t]',1,header=TRUE)
a<-table.element(a,'F[t]',1,header=TRUE)
a<-table.element(a,'95% LB',1,header=TRUE)
a<-table.element(a,'95% UB',1,header=TRUE)
a<-table.element(a,'p-value
(H0: Y[t] = F[t])',1,header=TRUE)
a<-table.element(a,'P(F[t]>Y[t-1])',1,header=TRUE)
a<-table.element(a,'P(F[t]>Y[t-s])',1,header=TRUE)
mylab <- paste('P(F[t]>Y[',nx,sep='')
mylab <- paste(mylab,'])',sep='')
a<-table.element(a,mylab,1,header=TRUE)
a<-table.row.end(a)
for (i in (nx-par5):nx) {
a<-table.row.start(a)
a<-table.element(a,i,header=TRUE)
a<-table.element(a,x[i])
a<-table.element(a,'-')
a<-table.row.end(a)
}
for (i in 1:fx) {
a<-table.row.start(a)
a<-table.element(a,nx+i,header=TRUE)
a<-table.element(a,round(x[nx+i],4))
a<-table.element(a,round(forecast$pred[i],4))
a<-table.element(a,round(lb[i],4))
a<-table.element(a,round(ub[i],4))
a<-table.element(a,round((1-prob.pval[i]),4))
a<-table.element(a,round((1-prob.dec[i]),4))
a<-table.element(a,round((1-prob.sdec[i]),4))
a<-table.element(a,round((1-prob.ldec[i]),4))
a<-table.row.end(a)
}
a<-table.end(a)
table.save(a,file='mytable.tab')
a<-table.start()
a<-table.row.start(a)
a<-table.element(a,'Univariate ARIMA Extrapolation Forecast Performance',7,TRUE)
a<-table.row.end(a)
a<-table.row.start(a)
a<-table.element(a,'time',1,header=TRUE)
a<-table.element(a,'% S.E.',1,header=TRUE)
a<-table.element(a,'PE',1,header=TRUE)
a<-table.element(a,'MAPE',1,header=TRUE)
a<-table.element(a,'Sq.E',1,header=TRUE)
a<-table.element(a,'MSE',1,header=TRUE)
a<-table.element(a,'RMSE',1,header=TRUE)
a<-table.row.end(a)
for (i in 1:fx) {
a<-table.row.start(a)
a<-table.element(a,nx+i,header=TRUE)
a<-table.element(a,round(perc.se[i],4))
a<-table.element(a,round(perf.pe[i],4))
a<-table.element(a,round(perf.mape[i],4))
a<-table.element(a,round(perf.se[i],4))
a<-table.element(a,round(perf.mse[i],4))
a<-table.element(a,round(perf.rmse[i],4))
a<-table.row.end(a)
}
a<-table.end(a)
table.save(a,file='mytable1.tab')